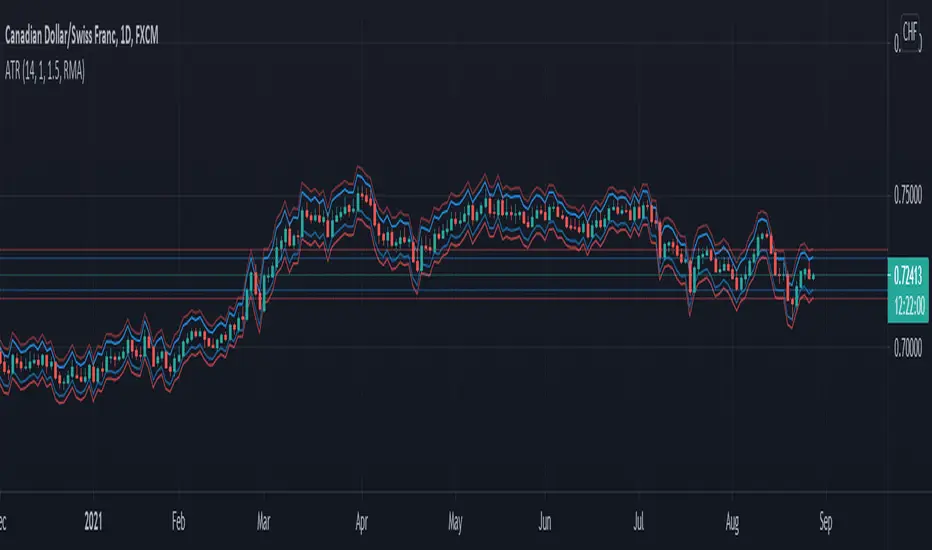
To appreciate dear Mr.Khakestar efforts i have converted his mt4 ATR formula to pine script. All credits goes to him. Plots You can enable plots from the settings tab and then disable five first plots from the style tabs (finally save as default). Then you can view the ATR result of each candle in the past: Green number is the HL range of the candle. ...
Black line = Trade Range from the last X periods. Red Line = 61.8% of black line value. Green bar = The current trade period range. Default Value = 21 (21 days = I business month) Generally speaking, a stock moves approximately the same value daily. Knowing the approximate value it likes to stay within calms the nerves when you see retracement of price...
This is an indicator I created recently, with the mind of spotting where price might reverse and where the price is trending. You can see this as the primary indicator for your system, however, it is recommended you use this in conjunction with other confirmation indicators. This script focus solely on ATR or Average True Range. This indicator is the...
This indicator includes a customizable mobile average with ATR levels
A lot of times I don't like my chart crowding with indicators, thus the reason for creating this script for my strategy QuarryLake. This script also comes with alert. Below is the explanation for QuarryLake I have also updated the script in version 4. This strategy consists of 3 indicators that I found works quite well together. Keltner Channel, Waddah...
Just one more go at a zigzag, this time with the aid of renko emulator.
This is an indicator I have been working on for the past 2 years, developed specifically for cryptocurrency. It is primarily a trend following indicator with great success and it performs the best in 4hrs to the weekly chart. There are two components of this indicator. The baseline from Ichimoku cloud and volatility stop . baseline period = 26 volatility...
Just a bunch of things I like, to determine trend direction. This script uses faster EMAs and slower SMAs. Also ATR for stops and trend reversals.
Average True Range for trailing stops, can be set to any timeframe independently of currently-displayed timeframe This indicator is derived from but more customizable. Many thanks to HPotter for the original version
ATR Channels help you to identify where to place your stop-loss or trailing stop-loss based on price volatility, according to the Average True Range (ATR).
Credits to @Fractured Adapted the "Many Moving Averages" script to VP's NNFX No Nonsense Forex method. Includes: - ATR bands and labels - Price is > 1 ATR away from baseline indication Without ATR Bands and bar colors Available MAs "ALMA", "EMA", "DEMA", "TEMA", "WMA", "VWMA", "SMA", "SMMA", "HMA", "Kijun", "McGinley"
This indicator consists of a fast and slow EMA (default lengths are 50 and 9 periods) and an upper and lower ATR band. When combined, this combination gives traders an accurate picture of both trend strength and direction. Users can modify the lengths of the fast and slow EMA , as well as the multipliers and length for the upper and lower ATR bands.
Slight modification on my previous script "ATR-Overlay" This script plots the max value of the ATR in a given period. Really straight forward, but has given me better stop-loss levels on trade entries.
ATR, with sma of ATR, made into a histogram.
ATR shows volatility. SMA of ATR measures the average volatility over a chosen look-back period (default 200). Divergence of ATR and sma is represented as a histogram. Low periods of volatility are below the zero line. High periods of volatility are above the zero line. Average volatility over a 200 period look-back is the zero value.