Bar By Bar ATR [upslidedown]After seeing strategy after strategy refer to calculating ATR values using a "calculator" (how barbaric!), I thought I'd take a stab at one possible solution to the "problem" as an overlay indicator on the main chart that replaces traditional standard ATR bands. This indicator presents ATR within a channel with a slick trick: invisible hover-able tooltips for you to know the ATR value for your strategy from bar to bar. Just zoom in and hover over the high ATR range and you'll see take profit and stop loss values for whatever strategy you might be running. I defaulted the indicator to a 1:1.5 ATR standard setup because that is good for many strategies but this is as configurable as you'd like to make it. One notable improvement for this indicator over standard ATR bands is that many existing ATR bands only use integers and this one uses a float value, so you can endlessly customize based on whatever strategy you might be running.
Note: Because labels are limited by default, the best way to historically see ATR values is to use TV's replay feature. I did this on purpose to limit resource usage. One could certainly print more labels but I felt it unnecessary to go beyond the default number of labels.
ATR

Supertrend Ext1st it exactly looks like the original Supertrend indicator. But if you see the options, you can see it is totally different:
It uses my other indicator inside: Zero Lag Keltner Channels, so you can use smoothed ATR bands for calculation instead of the raw ATR. By default it's length is 1 so it works like the original Supertrend.
You can choose different sources and moving averages for Keltner Channel calculation
It can filter outliers in ATR calculation
The indicator code is in my TAExt library, so it can easily be used in custom strategies.
Average True Range (VStop) Cloud SignalsThis indicator extends the built-in Volatility Stop indicator to a visual signals type indicator based on the crossover of a small VStop value (default 1.5x ATR) and a larger VStop value (default 3x ATR). The two values form a "cloud" with default coloring based on RSI/strength of trend.

Minimalistic ATRI have a thing for efficiency, as I'm sure many of you do as well. One could say we are minimalist. As such, wasting precious chart space is absolutely unacceptable. Such precious commodity should only be used for things that are pleasing to the eye and mind. This minimalistic ATR filter will give you all the functions a regular ATR provide, without all the clutter of plotting on the chart. Enjoy
The height of cultivation always runs to simplicity.
ATR TREXTry to visualize TREX method.
-4 types of candle based on TR :
1. Spinning ( Candle < 0.8*ATR )
2. Standard ( 0.8*ATR < Candle < 1.2*ATR )
3. Long bar ( 1.2*ATR < Candle < 2.5*ATR )
4. Spike ( 2.5*ATR < Candle )
ATR length is different base on FRACTAL timeframes.
you can now find what is type of candle as colored ATR.
-Time frames :
1 Min
5 Min
15 Min
1 Hour
4 Hour
1 Day
1 Week
1 Month
I am working on TREX method and this indicator will change and improve . (V1.0)
Br
Amin
CHOPperIt is based on the Choppiness Index indicator. It can show you when the market is in range. If the lines are below the lower band, it can be a strong trend, if it is inside the 2 bands, it is considered to be a choppy market, and if it is crossed down the upper band, it can be a developing trend.
This indicator does not show you the trend direction! This may be used as a confirmation indicator.
The improvements this indicator provides over the original:
It uses ATR instead of just TR (if ATR length is 1, it is the original TR)
It uses my ATRWO (ATR Without Outliers) indicator inside, which can remove extreme highs and lows from calculation. You can tune this by the "ATRWO STDev Mult" parameter. Higher value means more outliers are allowed.
It has 2 lines, one uses ATR(WO) (the blue one), which can be similar to the original Choppiness Index, the other uses standard deviation (the teal one).
The 2 lines can be used together, or you can hide one of them.

ATR vs Day Trading Range and PercentageThis indicator displays the Current Daily ATR vs the current Day Range and displays the percentage.
For example if the Daily ATR is $5 and the current range of the day is $10 this would be 200% the original move.
It is color coded (and can be modified) to change color when the Daily range is over 100% the ATR.
The time frame can be changed from Daily just be aware you must be on a lower timeframe then selected. So if you want to compare the current 30 minute ATR to the current 30 minute range you will need to be showing a 30 min chart or lower for it to calculate correctly.

ATR Position Size AutomationAll you have to fill out is your account balance, the % amount of your account you want to risk, and the percentage of ATR you want calculated. If you have 100% it will do a full ATR calculation. So if the ATR is $2 then your risk per share would be $2. If you had 50% in the same example it would be risking $1 per share.
You can also customize what time frame you want the ATR to be calculating off of. Just be aware the calculation will only be right if you are showing a lower time frame on your chart then the one selected on the indicator. (If you are calculating a daily dont be on a weekly chart. You have to be on a Daily or lower)
You can select what boxes you want displayed and if you want the ATR lines on the chart.

Average True Range (ATR) invisible price markers / linesThis script provides the ATR price when added to the top and bottom of the currently hovered candle.
The prices are shown top left next to the indicators' name.
This means you do not have to manually subtract or add ATR to price.
Line opacity allows you to show the lines where the ATR is, however, I recommend to keep this disabled.
Line type allows you to choose where ATR is calculated from (LowHigh or LowHighBody), the second ignoring the wicks, however LH is standard.
I also recommend to keep the other parameters as default.
I hope this indicator provides useful to you and your trading.

Buy / Sell alert indicator [Crypto_BCT]Hello everyone!
I bring to your attention a indicator to determine the point of buy and sell purchase.
It is based on oscillators and a moving average.
It can be used to work with bots, for example 3COMMAS DCA bot.
Signal Condition Settings:
ATR
The current candle is larger than the ATR for this period
EMA
The signal is necessarily below (for buy) and above (for sell) the EMA of the specified period
(Buy) RSI low
The RSI index is below this value
(Sell) RSI High
The RSI index is higher than this value
(Buy) MFI low
The MFI index is below this value
(Sell) MFI High
The MFI index is higher than this value
(Buy) CCI low
CCI index is below this value
(Sell) CCI High
The CCI index is higher than this value
(Buy) Lowest bar from
The closing of the current bar is lower than the closing of the bars back in this range
(Sell) Highest bar from
The closing of the current bar is higher than the closing of bars in this range
(Buy) Lowest EMA bar ago
During a given distance back, the EMA value only decreased
(Sell) Highest EMA bar ago
At a given distance back, the EMA value only increased
I hope it will be useful!

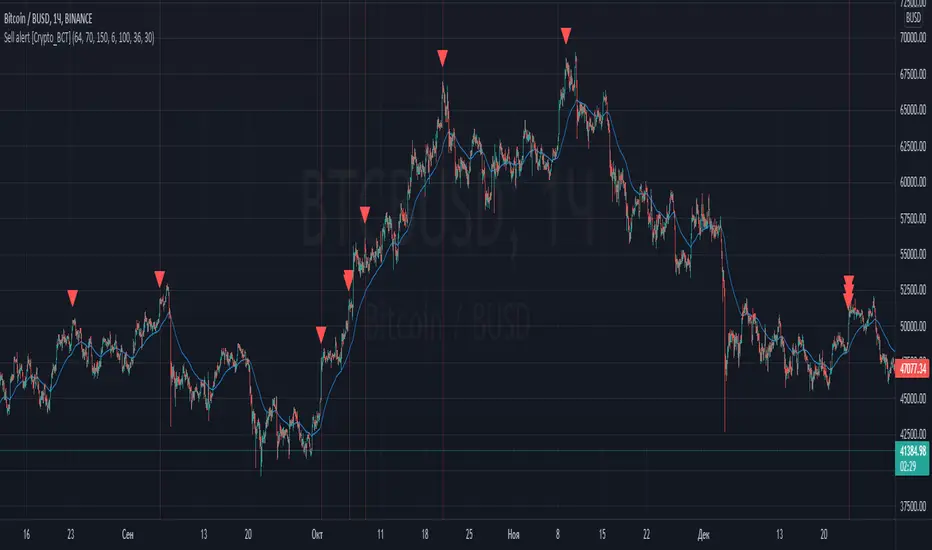
Sell alert [Crypto_BCT]Hello everybody!
I bring to your attention an indicator for determining the point of sell.
It is based on oscillators and a moving average.
Signal Condition Settings:
ATR
The current candle is larger than the ATR for this period
EMA
The signal must be above the EMA of the specified period
MFI High
The MFI index is higher than this value
CCI High
The CCI index is higher than this value
RSI High
The RSI index is higher than this value
Highest bar from
The closing of the current bar is higher than the closing of bars in this range
Highest EMA bar ago
At a given distance back, the EMA value only increased
I hope it will be useful!
Buy alert [Crypto_BCT]Hello everyone!
I bring to your attention a simple indicator to determine the point of purchase.
It is based on oscillators and a moving average.
It can be used to work with bots, for example 3COMMAS DCA bot.
Signal Condition Settings:
ATR
The current candle is larger than the ATR for this period
EMA
The signal is necessarily below the EMA of the specified period
MFI low
The MFI index is below this value
CCI low
CCI index is below this value
RSI low
The RSI index is below this value
Lowest bar from
The closing of the current bar is lower than the closing of the bars back in this range
Lowest EMA bar ago
During a given distance back, the EMA value only decreased
I hope it will be useful!

Trendlines with Breaks [LuxAlgo]The trendlines with breaks indicator return pivot point based trendlines with highlighted breakouts. Users can control the steepness of the trendlines as well as their slope calculation method.
Trendline breakouts occur in real-time and are not subject to backpainting. Trendlines can however be subject to repainting unless turned off from the user settings.
The indicator includes integrated alerts for trendline breakouts.
🔶 USAGE
Any valid trendlines methodology can be used with the indicator, users can identify breakouts in order to infer future price movements.
The calculation method of the slope greatly affects the trendline's behaviors. By default, an average true range is used, returning a more constant slope amongst trendlines. Other methods might return trendlines with significantly different slopes.
Stdev makes use of the standard deviation for the slope calculation, while Linreg makes use of the slope of a linear regression.
The above chart shows the indicator using "Stdev" as a slope calculation method. The chart below makes use of the "Linreg" method.
By default trendlines are subject to backpainting, and as such are offset by length bars in the past. Disabling backpainting will not offset the trendlines.
🔶 SETTINGS
Length: Pivot points period
Slope: Slope steepness, values greater than 1 return a steeper slope. Using a slope of 0 would be equivalent to obtaining levels.
Slope Calculation Method: Determines how the slope is calculated.
Backpaint: Determine whether trendlines are backpainted, that is offset to past.

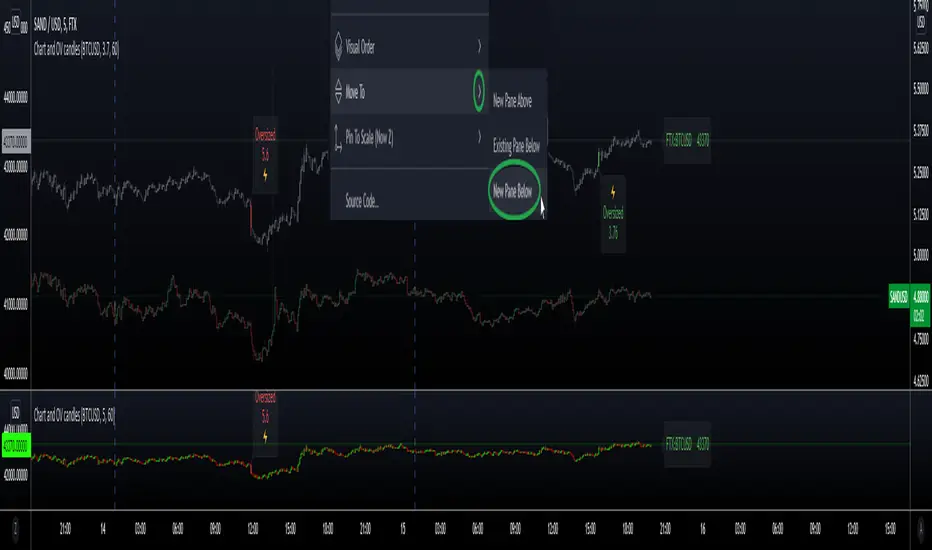
Secondary Chart with OverSized CandlesHi everyone, I'm sharing a simple script I made for a friend. He was looking for a way to add another asset to his chart, and monitor relevant movements \ spot eventual correlation, especially when trading Cryptocurrencies.
We couldn't find a similar script already available so here it is - the code is commented and I hope it's clear enough :)
Notes:
- The parameter scale = scale.left keeps the scales separated and therefore the chart is more organized, otherwise the chart would appear flat if the price difference is too big (e.g. BTC vs XRP)
- It is possible to have the script running in a separate panel (instead of overlay) by moving it to a new pane (when added to the chart) or by removing the parameter overlay = true at the beginning of the code.
- In case you wish to add indicators to this sub-chart (e.g. Bollinger Bands, EMA, etc..) you can do that by adding the relevant code and feed it with the variables OPEN \ HIGH \ LOW \ CLOSE as well as using the same method to retrieve new variables from the target asset with the request.security function.
Hope this comes handy.
Val - Protervus
ATR Volume DivergenceThe indicator measures ATR relative to VOLUME of each candle, marks the candles where there is more volume than in the previous one, but a lower ATR - signifying a compression in price movement - resistance. It also marks the candle where there is a greater ATR than in the previous candle, but lower volume - signifying an expansion in price movement - vacuum.
P.S. Bring indicator to FRONT to see the colored candles clearly

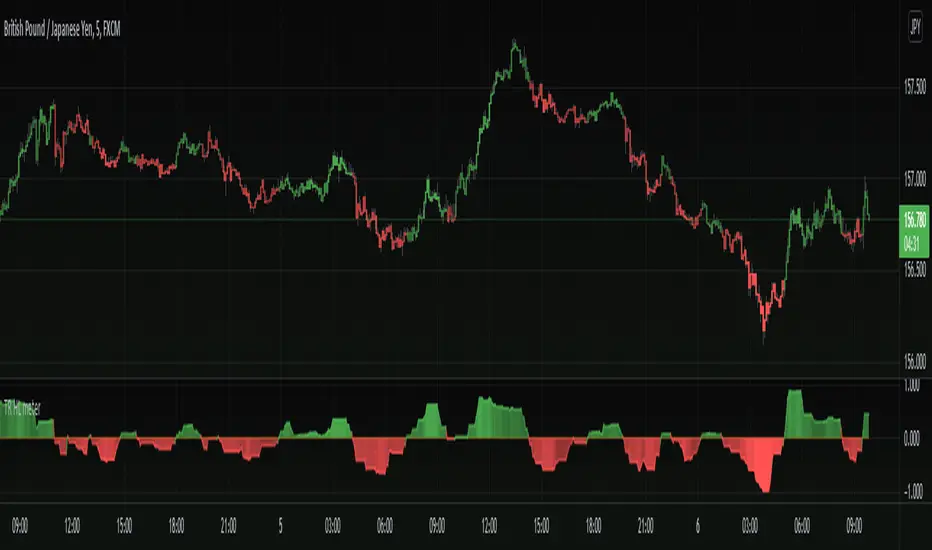
TR High/Low meterInteresting take for a velocity and trend analysis indicator, I call it The TR high/low meter.
First it will find the highest high and lowest low based on X bars back.
Now comes the twist, instead of storing these lowest or highest prices, we store the TR (true range) into the appropriate array (one array for lowest and one array for highest).
Finally, we sum up these two arrays for highest TR's and lowest TR's and subtract each other to get the difference, Hench, see who is stronger.
In the end we plot the difference into the indicator we have here.
The plot is colored with gradient color in which bright color emphasizes the movement is strong and weaker color emphasizes the movement is getting weaker.
Basically this indicator shows us the asset trend direction and strength. Awesome!
==Colors and Bar Colors==
Green: Up Trending
Light Green: Weakening up trend
Red: Down Trending.
Light Red: Weakening Down Trending.
==Notes==
Bar coloring is enabled on this chart!
Supports EMA smoothing (disabled by default)
Like if you like and Enjoy! Follow for more upcoming indicators/strategies: www.tradingview.com
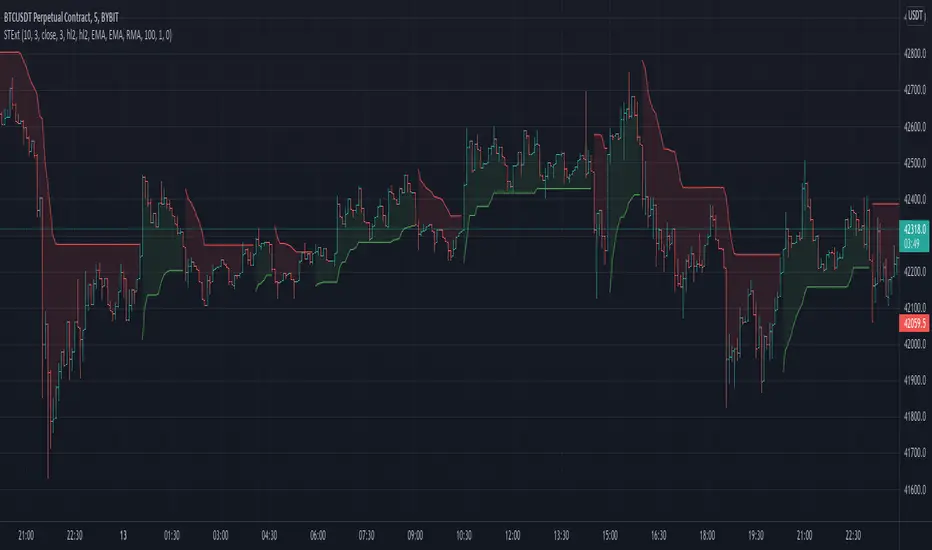
8X Trend ATR SAR Dingue V58X Trend ATR SAR Dingue V5 - This is the updated version for Pine Script 5.
8x indicator into 1 :
2x ATR indicator - 3x Trend indicator - 3x SAR indicator
Trends are helpful to spot reversal and support resistance, especially on bigger time frames.
This indicator gives you a global view of various trends all at once. You can easily turn them On or Off as to not clog the screen.
Each trend is also color-coded to visualize quickly the position of the price compared to it.
You can customize lengths, adjust line sizes, have the start of a new trend marked with a circle, fill in colors.
'Tool tips' explain other settings and if you have any questions, feel free to ask in the comments below.
Thank you for the feedback and check all my ‘Dingue’ indicators.

[TTI] ATR channelsHISTORY AND CREDITS
Used by John Carter in his indicator’s toolbox. The ATR channels or the Keltner Channels represent the railroads or the natural movement of stocks.
WHAT IT DOES
Movements between the the The first multiplier lines (white) represent standard movement for the timeframe you are trading. Movements between the second multiplier (green/red lines) represent a 2stdv move of the stock in a single direction. Once a stock starts reaching the 3rd multiplier lines there’s an exponential chance that it will revert to the mean (cyan line)
Additionally, we have added the Institutional lines. These are thought in a Small Account Mastery class 2019 by John Carter, as the levels heavily watched by institutions. The default settings represent what John is teaching but they can be further customised.
HOW TO USE IT
ATRs channels or Keltner Channels can be great source for target or stop losses and can be used as a indicator for confluence with other technical tools like the Fibonacci lines.

Signal Table - AutoFib - SMA - EMA - RSI - ATR - VolWith this indicator you can add a table on top of your chart.
What's in this table?
On which graph you open this table, the indicator data at the selected time of that graph are written. In the image below, you can see the table in the upper right.
You can also see two EMAs above the chart in this indicator. You can adjust their length.
You can add automatic fibonacci retracement levels to the top of the chart. In this way, you can see the Fibonacci levels on the chart and determine the support resistance. If the price is above the Fibonacci level, it will appear green on the chart, and red if below. You will understand as you use it.
It turns red if the RSI is below 30 and green if it is above 70.
Likewise, if the price is above the moving averages you have set, it appears as green, and if it is below it, it appears as red.
You can hide and activate the EMA and Fibonacci levels above the chart.
For example, you can get the ETH chart while the BTC chart is open in front of you. I think you will understand everything clearly from the settings tab below. Please support me. I hope you will be satisfied using it.

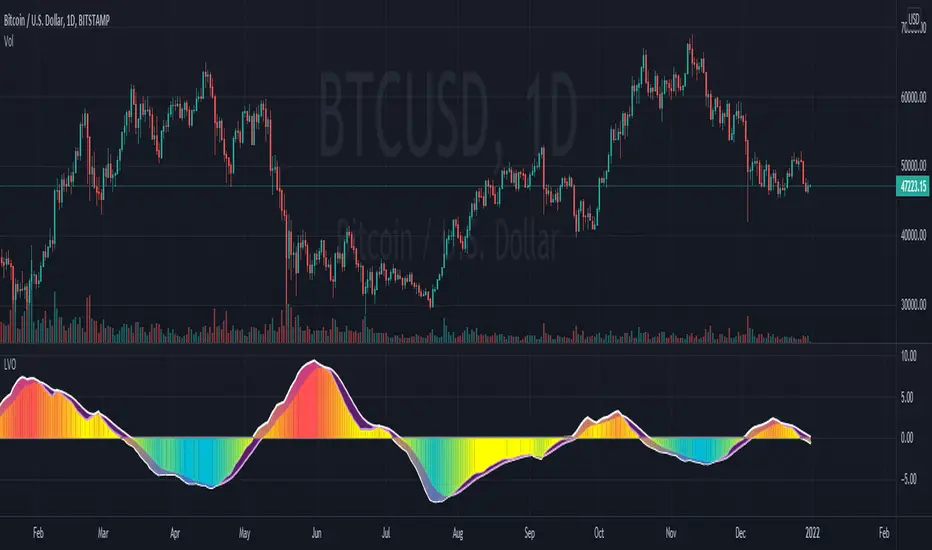
Leonidas Volatility OscillatorThis indicator is showing the volatility based on ATR or Historical Volatility.
Volatility is one of the most powerful tools to catch explosive moves or identify when the market is in consolidation/distribution phase.
How to use this indicator:
Colors:
Blue Color is they most important color for this indicator .
This color is suggesting the volatility is reaching the lowest point the market is in consolidation/distribution phase. Depending of the time frame after this phase you will see an expansion.
Yellow/Red Color
Usually we will see this when the market is trending.
Trend.
This indicator is interesting because you will know if the volatility is trending powerful to keep your positions or ride the trend .
This indicator will not tell you when to sell or buy.
This indicator will help you to identify explosive moves, consolidation/distribution phases.
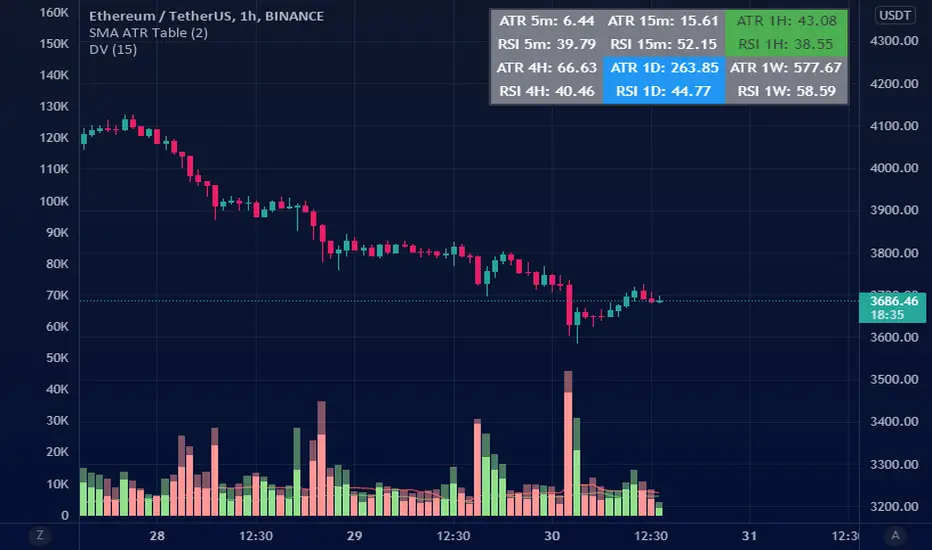
ATR Table (SMA)ATR table for select time frames.
Using Simple Moving Average (SMA) to get ATR.
MA periods is based on numbers suggested by Saeed Khakestar (Trigger Price Action)
You can change them in code
5m => 12
15m => 16
1H => 24
4H => 42
1D => 30
1W => 52
RSI is calculated the same way
EMA MTF PlusI like trading the 1 minute and 3 minutes time-frames. I'm what is commonly called a "scalper". Long term investments yes, I have some, but for trading, I don't have neither the time,
nor the patience to wait hours or days for my trade to be complete.
This doesn't mean I discount the higher time-frames, no, I actually rely heavily on them. I found that EMAs do a decent job as support/resistance, sometimes to a tick level of precision. And this is important for a 1 minute trader.
As such, I made this script that tracks the higher time-frames EMAs and displays the last value as a line.
I do not need the whole EMA, I'm not interested in crossovers or crossunders, these are anyway late signals for me.
What's with the triangles? These are local tops/bottoms , candles that have a have decent size of the wick. These tops and bottoms are by no means "final", they are merely a rejection at certain levels of price. Due to markets complexities (and human erratic behaviors hehe) these levels could be breached at the very next candle. For a more "final" version (nothing is really final but..) I added Schaff Trend Cycle as filter, so a triangle will pop only when a trend is mature enough ( STC with a value near 0 or near 100).
Colored bars. When the body of the candle is big, it shows strength. Strong bars tend to have follow through, especially when breaking key levels. The script looks at the body of the candle and compares it with ATR (Average True Range), if it's at least 0.8 of ATR it changes the bar color to yellow (bull candles) or fuchsia(bear candles).
Range identifier. This code is copied from Lazy Bear (if there are any issues please let me know), it's very useful in conjunction with colored bars.
I look for breakout candles that go outside of the range as a signal for a trade.
There are many ways in which this script can be useful, like trading mean reversions or momentum trades (breakouts) or simply trend following trades.
I hope you guys find it useful, you can play with default values and change them as you like, these are what I found to be working best for me and my trading universe (mostly crypto).
Special thanks for the original work of:
LazyBear
everget
Jim8080

ATR Bands with QQE [LM]Hello traders,
I would like to present you ATR Bands with QQE. This indicator is different than my other indicators I used QQE oscillator as an entry indicator, and atr bands I have used as an exit indicator.
You can see 2 set of bands with different multiplicator, first is used as first target profit, stop loss and second as a second target
There are two modes that takes, first is static mode that gives you lines with 1st, 2nd target profit and in red color stop loss.
Second mode has static first target and trailing stop loss
Settings:
Genreal settings - basic setting of source for atr bands, line settings,
First atr bands setting
Second atr bands setting
QQE settings
Cheers,
Lukas
