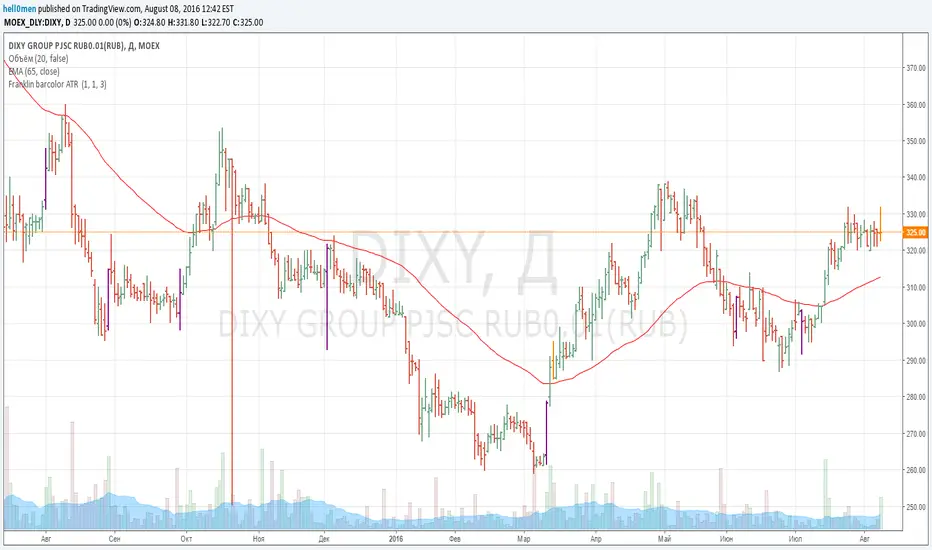
Franklin ATR Bar highlight by els (robotfarm.ru)Script highlights signal bars for tfc3.ru school trading strategy. Working timeframe D. Pine Script® indicatorby hell0men47
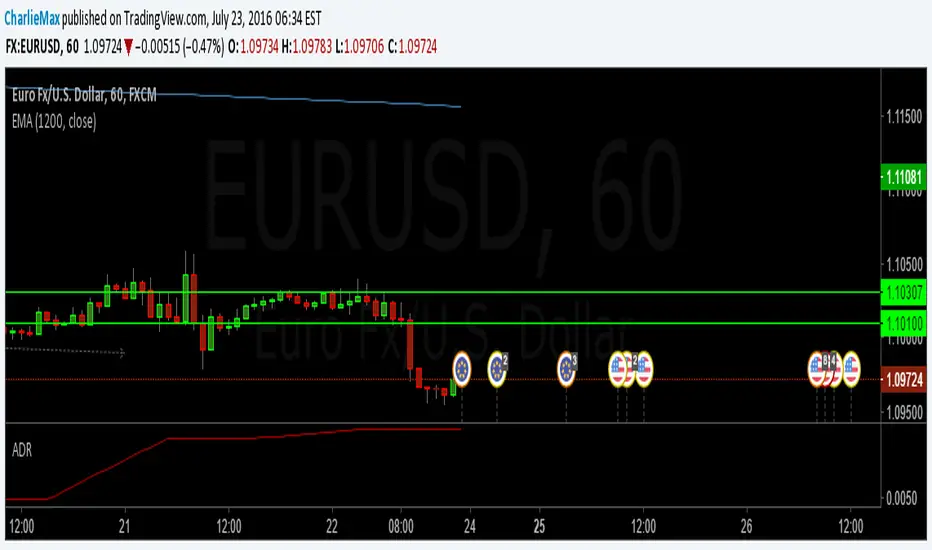
Average Daily RangeCalculates the Average Daily Range for the past 14 days high - low. Pine Script® indicatorby SuddenFX22 1.2 K
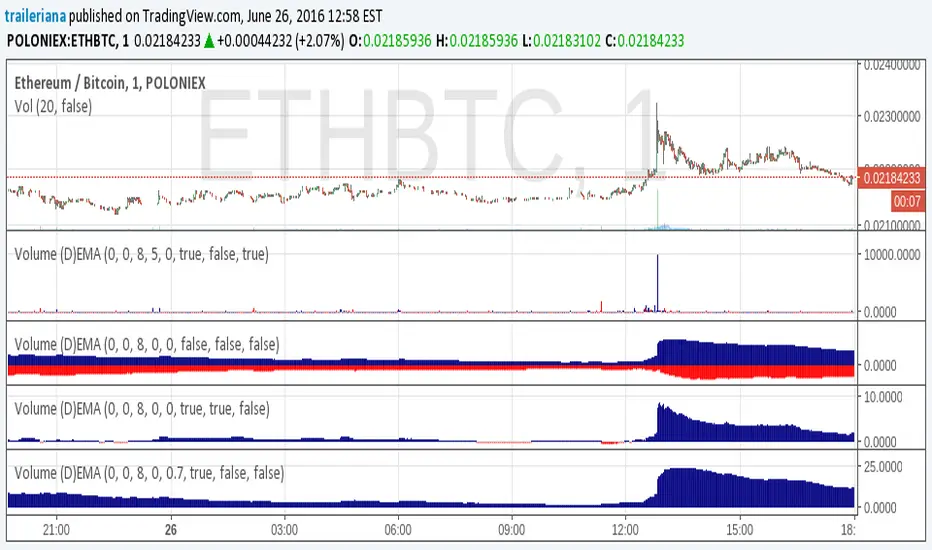
Volume (D)EMAA simple yet configurable indicator that shows recent traffic volumes. The time period is specified as weeks/days/hours/minutes, not as bars. Set the volume period to non-zero if you want to use a generalized double EMA instead of plain. The "ratio" option will show the size of the current volume compared to the average volume as computed for the specified time period; say hello to fat tails and goodby to "standard" and "normal" and "average". With the "together" option, it compares the current volume to the both sides together (buy+sell), otherwise it compares it to just its respective side.Pine Script® indicatorby timtom8583
Volume (D)EMAA simple yet configurable indicator that shows recent traffic volumes. The time period is specified as weeks/days/hours/minutes, not as bars. Set the volume period to non-zero if you want to use a generalized double EMA instead of plain. The ratio option will show the size of the current volume compared to the volume in the specified time period (expect to see something very non-Gaussian, say goodby to trusting your ATR and stddev, and say hello to fat tails.) With the "together" option, it compares the current volume to the both sides together (buy+sell), otherwise it compares it to just its own. Pine Script® indicatorby timtom851126
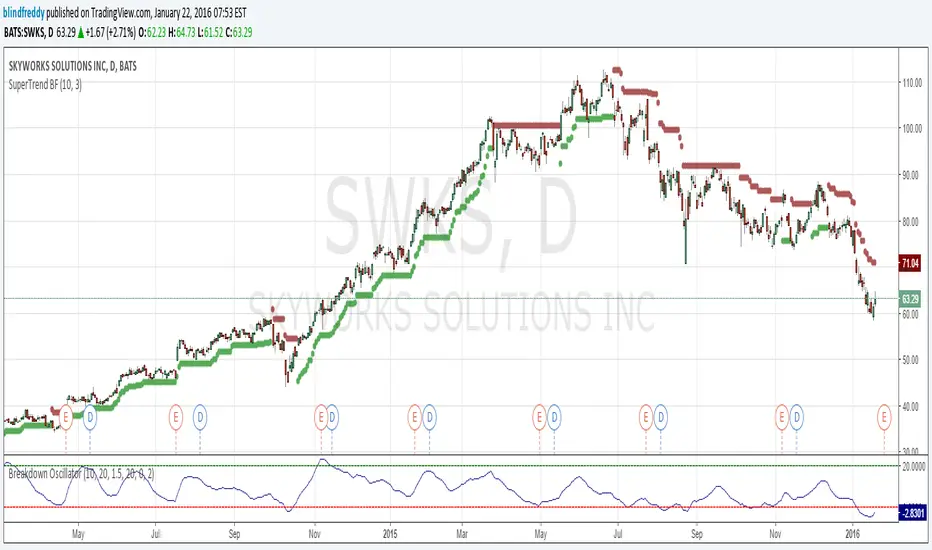
SuperTrend BFI am republishing this indicator as something changed within TradingView's script engine so that the old script ceased to function ( a minor syntax error that used to be acceptable but no longer is). Anyhow here's the fixed version which as you can see has done a great job of keeping us on the right side of the trend with once-hot stocks like Skyworks !Pine Script® indicatorby blindfreddy77991
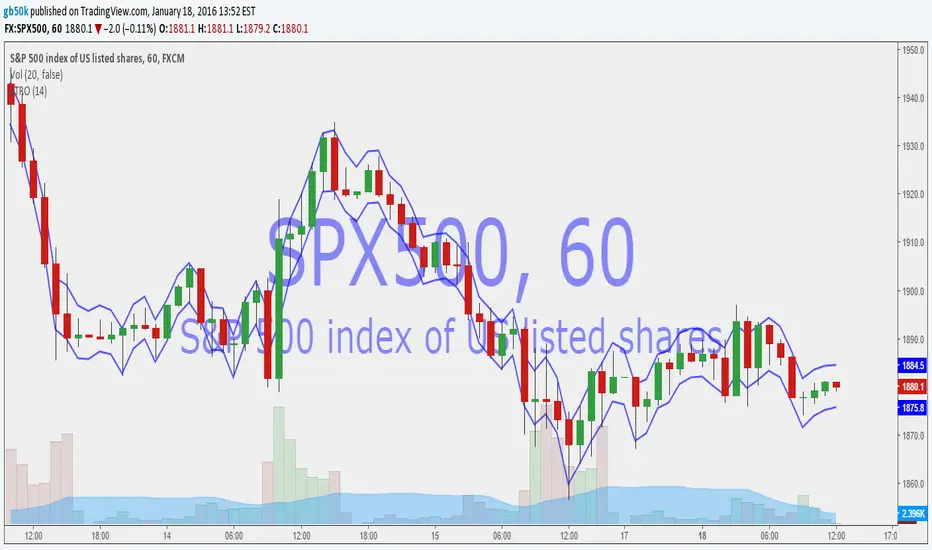
Average True Range Overlay - BandPlots a band of width 1 ATR around the midpoint (HL2) Settings: - Length of ATRPine Script® indicatorby gb50k66
Stochastic In BandsWhat about to display Stochastic Oscilator in EMA-ATR Bands? If you like the idea I would code advanced versionPine Script® indicatorby CapnOscar77389
ET-ATR-Price-OverlayOverlays the Average True Range high/low over Price. Shifts between support and resistance levels (based on ATR-21) according to price trend and breaks. Average true range: en.wikipedia.org @EmpoweredTraderPine Script® indicatorby EmpoweredTrader11422
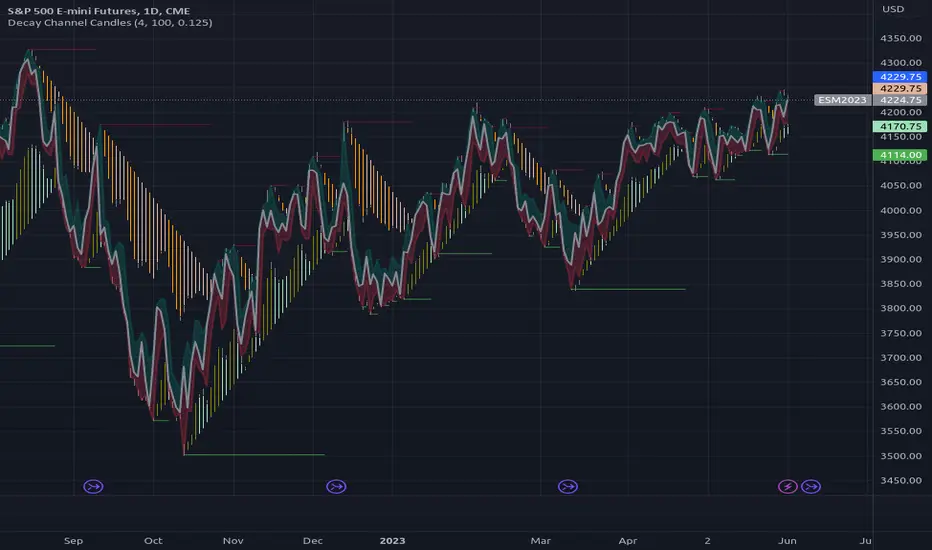
[RS]Decay Channel Candles V0EXPERIMENTAL: Experiment using Linear Regression based on %atr for decay(decay option is a mutiplier for the atr).Pine Script® indicatorby RicardoSantosUpdated 99469
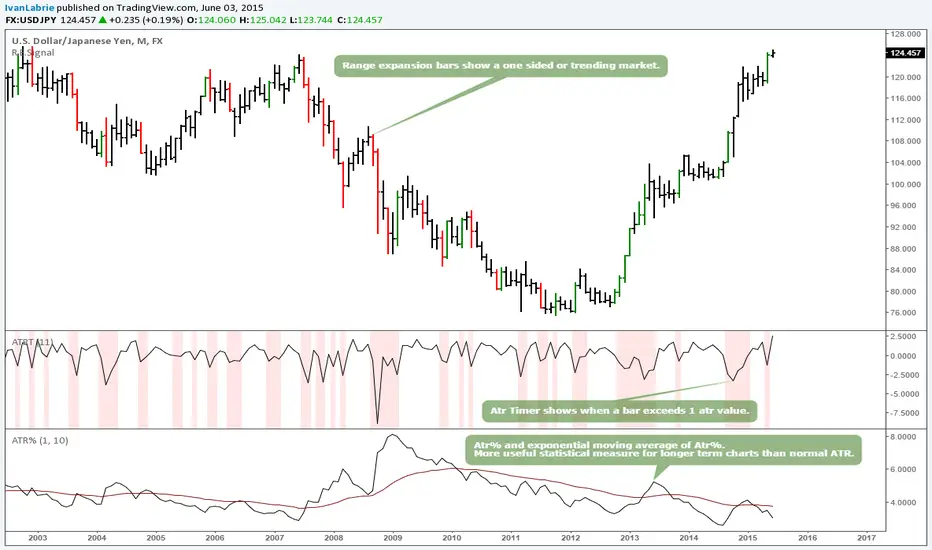
ATR%, ATR Timer and Range Expansion signalThese 3 indicators can be really useful. The usage is fairly straightforward, if you understand price action, having an statistical edge like these provide can be useful. Refer to Tim West's charts to learn more about range expansion bars. The idea for the Atr% and Atr timer come from discussions I had with Yacine Kanoun, props to him for his contribution.Pine Script® indicatorby IvanLabrie1818817
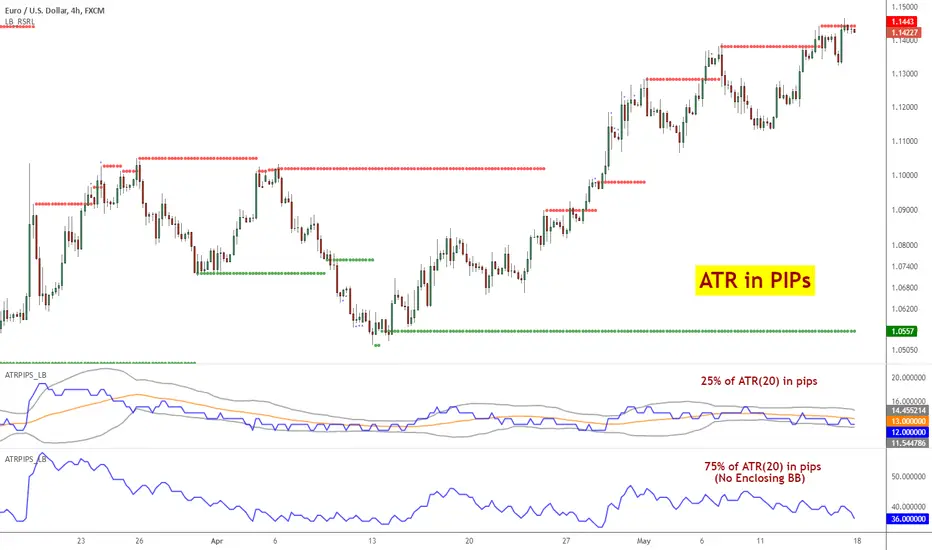
ATR Pips [LazyBear]This is ATR in pips. This was requested by user @ElixiumCapital. ATRPIPs in his words: "ATR PIPs is useful for finding markets with your desired amount of volatility, for example I prefer to trade forex pairs with the highest amount of volatility in the past 5 days, setting the length parameter to 5 days. And setting my stop loss at 25% to 33% of the the indicators value." I have added options to show a BB around ATR, as well as normal ATR (not in PIPs). All the parameters are configurable. List of my public indicators: bit.ly List of my app-store indicators: blog.tradingview.com Pine Script® indicatorby LazyBear99 3.8 K
Daily ATR%If You are using a percentage of the Daily Average True Range in determining your stop placement, this quick indicator is for You. excerpt from investopedia.com/articles/trading/06/stopplacement.asp ATR % Stop Method The ATR% stop method can be used by any type of trader because the width of the stop is determined by the percentage of average true range (ATR). ATR is a measure of volatility over a specified period of time. The most common length is 14, which is also a common length for oscillators such as the relative strength index (RSI) and stochastics. A higher ATR indicates a more volatile market, while a lower ATR indicates a less volatile market. By using a certain percentage of ATR, you ensure that your stop is dynamic and changes appropriately with market conditions. For example, for the first four months of 2006, the GBP/USD average daily range was around 110 to 140 pips. A day trader may want to use a 10% ATR stop - meaning that the stop is placed 10% x ATR pips from the entry price.In this instance, the stop would be anywhere from 11 to 14 pips from your entry price. A swing trader might use 50% or 100% of ATR as a stop. In May and June of 2006, daily ATR was anywhere from 150 to 180 pips. As such, the day trader with the 10% stop would have stops from entry of 15 to 18 pips while the swing trader with 50% stops would have stops of 75 to 90 pips from entry.Pine Script® indicatorby netixen11758
Average True RangeThe Default Average True Range doesn't appear to be accurate, not sure why. Rewrote it, hopefully it works better for everyone than the original.Pine Script® indicatorby zachary.mickelson33399
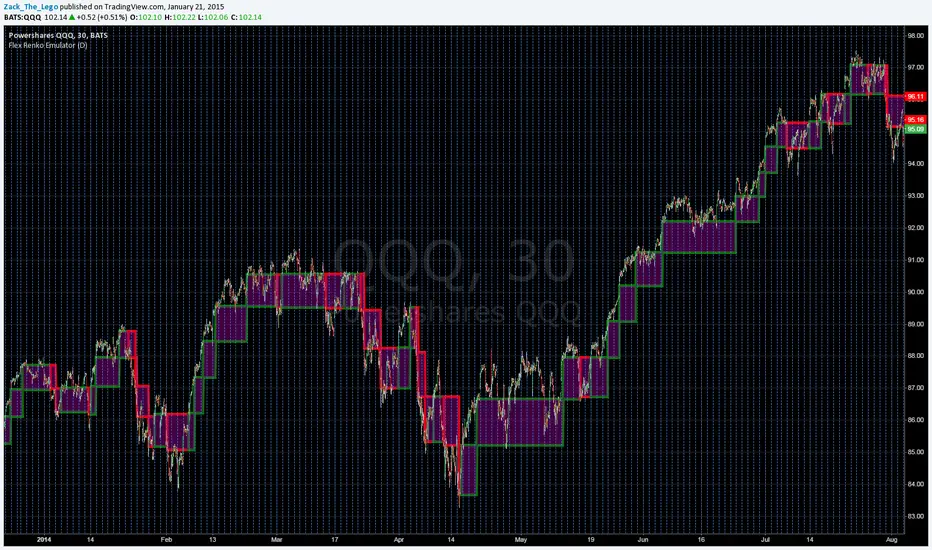
Flex Renko Emulatorupdate: As far as my algorithm design will take me this is it. So It's complete in my eyes. Here is a "working" version of something I've been looking for for a long time: "Flex" Renko Charting. Bricks' sizes are determined by ATR and are set by simply choosing a resolution for the ATR calculation. No need to go in and choose renko granulation(resolution) AND brick size. Renko granulation is current chart resolution. Feel free to send me feedback on how to manage the reversal bricks' calculation or any other thoughts and ideas. Replace the "close" in the main body of the renko calculation with 'high' and 'low' to get more consistent paintings across different aggregations since renkos aren't technically based off closing prices but where the price has been. Of course it's all a matter of preference: Brick1 = high > nz(Brick1) + BrickSize ? nz(Brick1) + BrickSize : low < nz(Brick1) - BrickSize ? nz(Brick1) - BrickSize : nz(Brick1) Pine Script® indicatorby Zack_The_Lego1919824
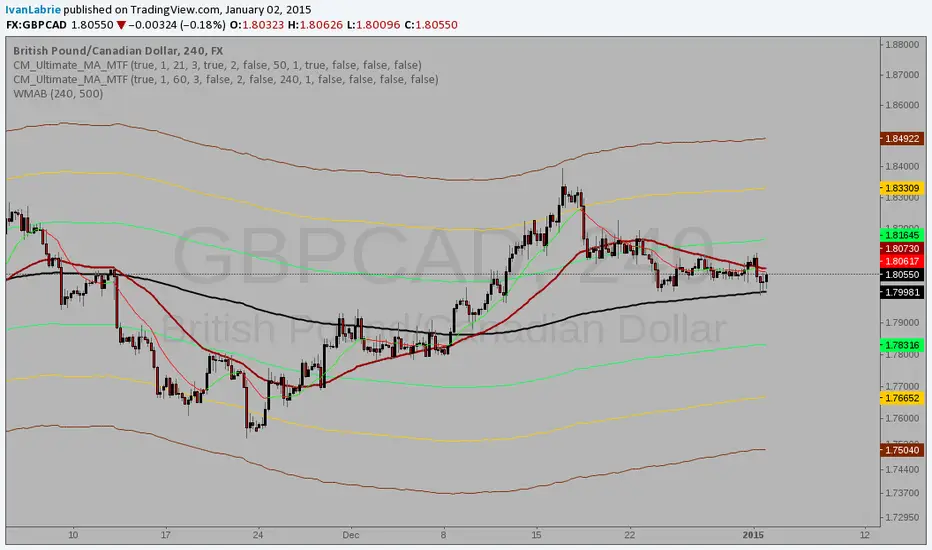
WMA BandsIn this chart we can see an adaptation I made of an indicator a certain fellow named nanningbob uses in one of his trading systems. It's a great thing to have, since Forex pairs are mostly ranging markets. It captures price movement very well, and gives realistic take profit levels, without having to risk major drawdown if used wisely. Hope you like it and find it useful. *Props to ucsgears for the original code I modified.Pine Script® indicatorby IvanLabrie11173
CM ATR Stops/Bands - Multi-TimeFrameCM_MTF ATR Bands/Stops Many Options Available Via Input Tab: -Chart Defaults to Upper and Lower ATR's Based on Current Chart TimeFrame -Ability to Plot either Upper and/or Lower ATR's -Ability to Change the Time Frame ATR's are Based On! -Ability to change Look Back Period and ATR Multiplier Individually for Both Time Frames -This Gives you the ability to plot same Time Frame with (for ex.) a 5 ATR with a 1.5 Mult and a 14 ATR with a 2.0 Mult etc. -Or you can plot Daily ATR's on a 60 minute Chart etc. -ATR Multipliers are Calculated with Code that allows "Non Whole Numbers" Allowing Ability to use 1.5 ATR's, 1.8 ATR's etc. ***Endless # of Combinations can be used!!!!Pine Script® indicatorby ChrisMoody1212 1.9 K
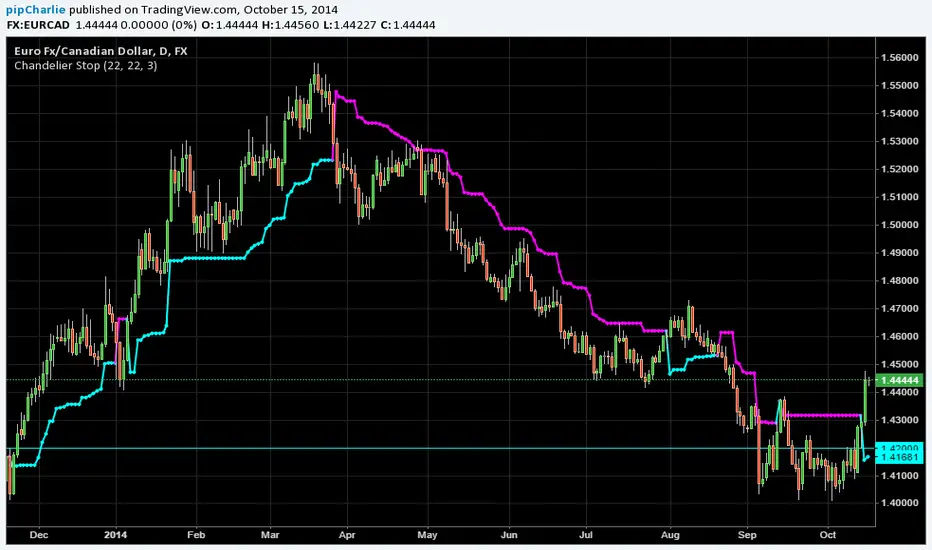
Chandelier StopA modified verion of the Chande & Kroll's Stop indicator.Pine Script® indicatorby pipCharlie3636 5.6 K
CM ATR PercentileRankCM ATR PercentileRank - Great For Showing Market Bottoms. When Increased Volatility to the Downside Reaches Extreme Levels it’s Usually a Sign of a Market Bottom. This Indicator Takes the ATR and uses a different LookBack Period to calculate the Percentile Rank of ATR Which is a Great Way To Calculate Volatility Be Careful Of Using w/ Market Tops. Not As Reliable. ***Ability to Control ATR Period and set PercentileRank to Different Lookback Period ***Ability to Plot Histogram Just Showing Percentiles or Histogram Based on Up/Down Close Fuchsia Lines = Greater Than 90th Percentile of Volatility based on ATR and LookBack Period. Red Lines = Warning — 80-90th Percentile Orange Lines = 70-80th Percentile Other Useful Indicators Williams Vix Fix CM_RSI EMA Is a Great Filter for Williams Vix Fix Pine Script® indicatorby ChrisMoody2727 2.4 K
Indicator: Custom COG channelThis is my custom channel (Bear Channel!? :)) derived from BB/STARC. It uses both ATR/STDEV for plotting the bounds. I use COG (Center of Gravity) for deriving the baseline. This enables it to track the price action better than many other channels that make use of MAs or simply "close". Indicator also marks "squeezes" (stdev bands come inside ATR bands). Pay attention to these, as these usually indicate a move. I am still exploring this indicator on different BTCUSD time frames, would love to hear your feedback / setups for other instruments. Code for this indicator: pastebin.com Code for COG fibs I mentioned in the comments: pastebin.com Pine Script® indicatorby LazyBear5757 4.8 K