Smoothing ATR bandThere are two bands calculated with the ATR and I added "Smoothing" into the script.
Smoothing ATR with multiplier can display two bands above and below the price.
We can ONLY find some ATR bands in Community Scripts with "Basic" setting which is used to set Stop Loss.
And yet , Smoothing ATR with multiplier is capable of making traders manifestly recognize OverBought & OverSold.
FurtherMore, I added a condition with "plotshape", which is "Stop Hunt"
Stop Hunt is an absolutely usual strategy to clean the leverage and it always makes high volatility moves.
When high> above band and close< above band , long signal, it means it had been abundantly bought but the larger traders weren't satisfied; therefore, they quickly sold out to lower the price. The sell condition is on the contrary.
The signals mainly make traders manifestly recognize OverBought & OverSold.
Average True Range (ATR)

TTP SuperTrend ADXThis indicator uses the strength of the trend from ADX to decide how the SuperTrend (ST) should behave.
Motivation
ST is a great trend following indicator but it's not capable of adapting to the trend strength.
The ADX, Average Directional Index measures the strength of the trend and can be use to dynamically tweak the ST factor so that it's sensitivity can adapt to the trend strength.
Implementation
The indicator calculates a normalised value of the ADX based on the data available in the chart.
Based on these values ST will use different factors to increase or reduce the factor use by ST: expansion or compression.
ST expansion vs compression
Expanding the ST would mean that the stronger a trends get the ST factor will grow causing it to distance further from the price delaying the next ST trend flip.
Compressing the ST would mean that the stronger a trends get the ST factor will shrink causing it to get closer to the price speeding up the next ST trend flip.
Features
- Alerts for trend flip
- Alerts for trend status
- Backtestable stream
- SuperTrend color gets more intense with the strength of the trend

Advanced Weighted Residual Arbitrage AnalyzerThe Advanced Weighted Residual Arbitrage Analyzer is a sophisticated tool designed for traders aiming to exploit price deviations between various asset pairs. By examining the differences in normalized price relations and their weighted residuals, this indicator provides insights into potential arbitrage opportunities in the market.
Key Features:
Multiple Relation Analysis: Analyze up to five different asset relations simultaneously, offering a comprehensive view of potential arbitrage setups.
Normalization Functions: Choose from a variety of normalization techniques like SMA, EMA, WMA, and HMA to ensure accurate comparisons between different price series.
Dynamic Weighting: Residuals are weighted based on their correlation, ensuring that stronger correlations have a more pronounced impact on the analysis. Weighting can be adjusted using several functions including square, sigmoid, and logistic.
Regression Flexibility: Incorporate linear, polynomial, or robust regression to calculate residuals, tailoring the analysis to different market conditions.
Customizable Display: Decide which plots to display for clarity and focus, including normalized relations, weighted residuals, and the difference between the screen relation and the average weighted residual.
Usage Guidelines:
Configure the asset pairs you wish to analyze using the Symbol Relations group in the settings.
Adjust the normalization, volatility, regression, and weighting functions based on your preference and the specific characteristics of the asset pairs.
Monitor the weighted residuals for deviations from the mean. Larger deviations suggest stronger arbitrage opportunities.
Use the difference plot (between the screen relation and average weighted residual) as a quick visual cue for potential trade setups. When this plot deviates significantly from zero, it indicates a possible arbitrage opportunity.
Regularly update and adjust the parameters to account for changing market conditions and ensure the most accurate analysis.
In the Advanced Weighted Residual Arbitrage Analyzer , the value set in Alert Threshold plays a crucial role in delineating a normalized band. This band serves as a guide to identify significant deviations and potential trading opportunities.
When we observe the plots of the green line and the purple line, the Alert Threshold provides a boundary for these plots. The following points explain the significance:
Breach of the Band: When either the green or purple line crosses above or below the Alert Threshold , it indicates a significant deviation from the mean. This breach can be interpreted as a potential trading signal, suggesting a possible arbitrage opportunity.
Convergence to the Mean: If the green line converges with the purple line , it denotes that the price relation has reverted to its mean. This convergence typically suggests that the arbitrage opportunity has been exhausted, and the market dynamics are returning to equilibrium.
Trade Execution: A trader can consider entering a trade when the lines breach the Alert Threshold . The return of the green line to align closely with the purple line can be seen as a signal to exit the trade, capitalizing on the reversion to the mean.
By monitoring these plots in conjunction with the Alert Threshold , traders can gain insights into market imbalances and exploit potential arbitrage opportunities. The convergence and divergence of these lines, relative to the normalized band, serve as valuable visual cues for trade initiation and termination.
When you're analyzing relations between two symbols (for instance, BINANCE:SANDUSDT/BINANCE:NEARUSDT ), you're essentially looking at the price relationship between the two underlying assets. This relationship provides insights into potential imbalances between the assets, which arbitrage traders can exploit.
Breach of the Lower Band: If the purple line touches or crosses below the lower Alert Threshold , it indicates that the first symbol (in our example, SANDUSDT ) is undervalued relative to the second symbol ( NEARUSDT ). In practical terms:
Action: You would consider buying the first symbol ( SANDUSDT ) and selling the second symbol ( NEARUSDT ).
Rationale: The expectation is that the price of the first symbol will rise, or the price of the second symbol will fall, or both, thereby converging back to their historical mean relationship.
Breach of the Upper Band: Conversely, if the difference plot touches or crosses above the upper Alert Threshold , it suggests that the first symbol is overvalued compared to the second. This implies:
Action: You'd consider selling the first symbol ( SANDUSDT ) and buying the second symbol ( NEARUSDT ).
Rationale: The anticipation here is that the price of the first symbol will decrease, or the price of the second will increase, or both, bringing the relationship back to its historical average.
Convergence to the Mean: As mentioned earlier, when the green line aligns closely with the purple line, it's an indication that the assets have returned to their typical price relationship. This serves as a signal for traders to consider closing out their positions, locking in the gains from the arbitrage opportunity.
It's important to note that when you're trading based on symbol relations, you're essentially betting on the relative performance of the two assets. This strategy, often referred to as "pairs trading," seeks to capitalize on price imbalances between related financial instruments. By taking opposing positions in the two symbols, traders aim to profit from the eventual reversion of the price difference to the mean.

Double Supertrend HTF FilterDouble Supertrend HTF Filter: A Comprehensive Market Direction Tool
The Double Supertrend HTF Filter is an innovative tool designed for traders who seek a more holistic view of market trends. At its core, the indicator combines two Supertrends from different higher timeframes, providing a layered perspective on the market's direction. Instead of juggling between multiple timeframes or charts, traders get a consolidated view with this indicator. One of its standout features is the horizontal line at the bottom of the chart, which visually represents the alignment of the two Supertrends – a simple yet powerful way to gauge the combined sentiment of the two higher timeframes on your chart.
The Supertrend Indicator: Origins and Rationale
The Supertrend indicator, a popular tool among traders, was developed by Olivier Seban. At its essence, the Supertrend is a trend-following indicator, designed to identify and visualize the current market trend. It operates using average true range (ATR) values and price data, effectively smoothing out market noise to present clearer trend directions. When prices move with a consistent momentum upwards or downwards, the Supertrend remains below or above the price respectively, signaling the prevailing trend's direction. The rationale behind the Supertrend is its ability to adapt to price volatility. By factoring in the average true range, it dynamically adjusts itself, ensuring that it's not just based on price but also the inherent volatility of the market. This adaptability makes it a valuable tool for traders, offering insights into potential trend reversals and potential entry or exit points.
Filter Usage
The main idea behind the Double Supertrend HTF is to use the indicator as a filter in addition to a signal indicator to your liking. To illustrate, consider incorporating it with a MACD Oscillator, such as the one detailed in this article: When the solid line at the bottom of the chart turns green, it signals that both supertrends are up and thus allows for long positions, indicating a bullish sentiment across both the chosen higher timeframes. Conversely, a red line permits short positions, hinting at a bearish trend. Should the line turn yellow, it's a sign of caution. The market is indecisive, and it might be prudent to refrain from taking any trades until a clearer direction emerges.
Features of the Indicator
Understanding that traders have different preferences, the Double Supertrend HTF Filter comes with customizable features. With the easy user interface you can change the timeframe, ATR and factor to your preferred trading strategy. The default settings are set for the 30 minutes and 4 hour timeframe, which is my personal preference for scalping trades on lower timeframes (eg. 1min, 5 min, 10 min, 15 min). While the dual Supertrend lines offer valuable insights, a chart can become cluttered when combined with other indicators. Therefore, traders have the option to toggle on or off the display of the Supertrends. This ensures that you have the flexibility to maintain a clean chart view while still benefiting from the insights the tool provides at the bottom of the chart.
A Note on Usage
It's essential to highlight that the Double Supertrend HTF Filter is for educational purposes. While it offers a unique perspective on market trends and can be a valuable addition to a trader's toolkit, it's merely an example of how one can use the Supertrend as a filter. Always conduct thorough research and consider your trading strategy before making any decisions.
If you have any comments or ideas how to combine this filter with other indicators feel free to leave a comment.

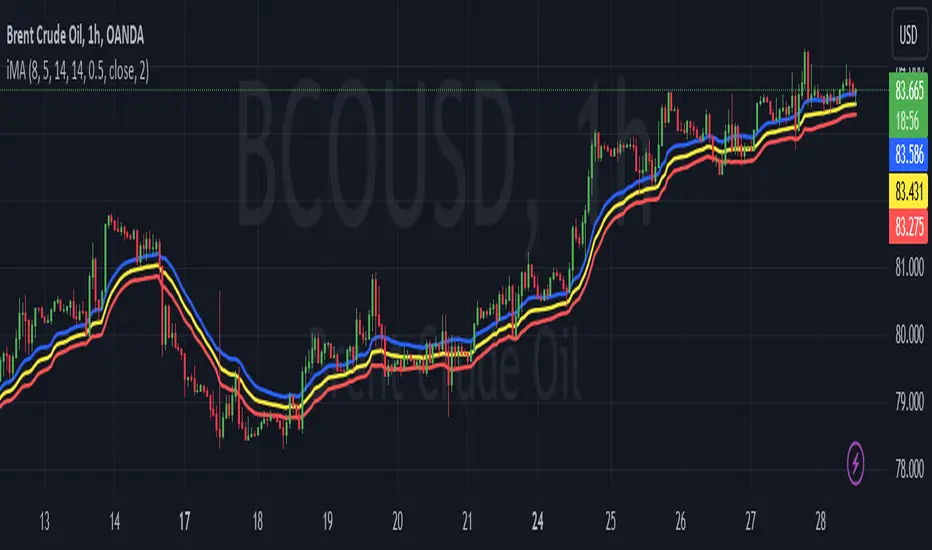
Pro Supertrend CalculatorThis indicator is an adapted version of Julien_Eche's 'Pro Momentum Calculator' tailored specifically for TradingView's 'Supertrend indicator'.
The "Pro Supertrend Calculator" indicator has been developed to provide traders with a data-driven perspective on price movements in financial markets. Its primary objective is to analyze historical price data and make probabilistic predictions about the future direction of price movements, specifically in terms of whether the next candlestick will be bullish (green) or bearish (red). Here's a deeper technical insight into how it accomplishes this task:
1. Supertrend Computation:
The indicator initiates by computing the Supertrend indicator, a sophisticated technical analysis tool. This calculation involves two essential parameters:
- ATR Length (Average True Range Length): This parameter determines the sensitivity of the Supertrend to price fluctuations.
- Factor: This multiplier plays a pivotal role in establishing the distance between the Supertrend line and prevailing market prices. A higher factor value results in a more significant separation.
2. Supertrend Visualization:
The Supertrend values derived from the calculation are meticulously plotted on the price chart, manifesting as two distinct lines:
- Green Line: This line represents the Supertrend when it indicates a bullish trend, signifying an anticipation of rising prices.
- Red Line: This line signifies the Supertrend in bearish market conditions, indicating an expectation of falling prices.
3. Consecutive Candle Analysis:
- The core function of the indicator revolves around tracking successive candlestick patterns concerning their relationship with the Supertrend line.
- To be included in the analysis, a candlestick must consistently close either above (green candles) or below (red candles) the Supertrend line for multiple consecutive periods.
4.Labeling and Enumeration:
- To communicate the count of consecutive candles displaying uniform trend behavior, the indicator meticulously applies labels to the price chart.
- The positioning of these labels varies based on the direction of the trend, residing either below (for bullish patterns) or above (for bearish patterns) the candlestick.
- The color scheme employed aligns with the color of the candle, using green labels for bullish candles and red labels for bearish ones.
5. Tabular Data Presentation:
- The indicator augments its graphical analysis with a customizable table prominently displayed on the chart. This table delivers comprehensive statistical insights.
- The tabular data comprises the following key elements for each consecutive period:
a. Consecutive Candles: A tally of the number of consecutive candles displaying identical trend characteristics.
b. Candles Above Supertrend: A count of candles that remained above the Supertrend during the sequential period.
3. Candles Below Supertrend: A count of candles that remained below the Supertrend during the sequential period.
4. Upcoming Green Candle: An estimation of the probability that the next candlestick will be bullish, grounded in historical data.
5. Upcoming Red Candle: An estimation of the probability that the next candlestick will be bearish, based on historical data.
6. Tailored Configuration:
To accommodate diverse trading strategies and preferences, the indicator offers extensive customization options. Traders can fine-tune parameters such as ATR length, factor, label and table placement, and table size to align with their unique trading approaches.
In summation, the "Pro Supertrend Calculator" indicator is an intricately designed tool that leverages the Supertrend indicator in conjunction with historical price data to furnish traders with an informed outlook on potential future price dynamics, with a particular emphasis on the likelihood of specific bullish or bearish candlestick patterns stemming from consecutive price behavior.

[TTI] Jon Tr3ndy ATR Label📜 ––––HISTORY & CREDITS––––
The Jon Tr3ndy ATR Label is another creation inspired by Tr3ndy Jon (Jonathan McKeever,) and his Supply and Demand System. Building on the legacy of our premium scripts Tr3ndy Bands, Tr3ndy Edges, Tr3ndy LIS and the Tr3ndy PMZ, this script brings the power of the Average True Range (ATR) to your fingertips, but with a Tr3ndy twist.
🦄 ––––CALCULATIONS––––
The indicator uses different calculations methods to determine (Average True Range) ATR for the stock. The available calculation are:
👉 Exponential Moving Average EMA,
👉 Simple Moving Average SMA,
👉 Relative Moving Average RMA,
👉 Weighted Moving Average WMA.
The available timeframes are:
👉 Daily D
👉 Weekly W
👉 Monthly M
When you hoover with the mouse above the label, you will see what type of calculation you have chosen.
🎯 ––––WHAT IT DOES––––
The Jon Tr3ndy ATR Label is designed to dynamically calculate and display the Average True Range (ATR) of the asset directly on your chart for any of the chosen timeframes (e.g. show Weekly ATR on a Daily chart).
It can be used on equities, forex, crypto and many more. ATR is a volatility indicator that measures the degree of price volatility. This script allows users to select between daily, weekly, or monthly ATR calculations and offers a choice of four averaging methods: EMA, SMA, RMA, and WMA. The resulting ATR value is then presented as an easily readable label on your chart, ensuring you're always informed about the market's volatility.
🛠️ ––––HOW TO USE IT––––
ATR Length : Set the desired period for the ATR calculation.
Average Type : Choose your preferred averaging method from EMA, SMA, RMA, or WMA.
Day Period : Select the desired time frame for the ATR calculation: Daily (D), Weekly (W), or Monthly (M).
Label Position : Adjust the position of the ATR label on your chart using the 'Panel Position' and 'Text Size' options.
Banner : Toggle the 'Banner' option to display the ATR label as a banner on your chart.
Interpreting the ATR Label : A higher ATR value indicates greater volatility, while a lower ATR suggests less volatility. Use this information in conjunction with other indicators and analysis techniques to make informed trading decisions.

Average Range LinesThis Average Range Lines indicator identifies high and low price levels based on a chosen time period (day, week, month, etc.) and then uses a simple moving average over the length of the lookback period chosen to project support and resistance levels, otherwise referred to as average range. The calculation of these levels are slightly different than Average True Range and I have found this to be more accurate for intraday price bounces.
Lines are plotted and labeled on the chart based on the following methodology:
+3.0: 3x the average high over the chosen timeframe and lookback period.
+2.5: 2.5x the average high over the chosen timeframe and lookback period.
+2.0: 2x the average high over the chosen timeframe and lookback period.
+1.5: 1.5x the average high over the chosen timeframe and lookback period.
+1.0: The average high over the chosen timeframe and lookback period.
+0.5: One-half the average high over the chosen timeframe and lookback period.
Open: Opening price for the chosen time period.
-0.5: One-half the average low over the chosen timeframe and lookback period.
-1.0: The average low over the chosen timeframe and lookback period.
-1.5: 1.5x the average low over the chosen timeframe and lookback period.
-2.0: 2x the average low over the chosen timeframe and lookback period.
-2.5: 2.5x the average low over the chosen timeframe and lookback period.
-3.0: 3x the average low over the chosen timeframe and lookback period.
Look for price to find support or resistance at these levels for either entries or to take profit. When price crosses the +/- 2.0 or beyond, the likelihood of a reversal is very high, especially if set to weekly and monthly levels.
This indicator can be used/viewed on any timeframe. For intraday trading and viewing on a 15 minute or less timeframe, I recommend using the 4 hour, 1 day, and/or 1 week levels. For swing trading and viewing on a 30 minute or higher timeframe, I recommend using the 1 week, 1 month, or longer timeframes. I don’t believe this would be useful on a 1 hour or less timeframe, but let me know if the comments if you find otherwise.
Based on my testing, recommended lookback periods by timeframe include:
Timeframe: 4 hour; Lookback period: 60 (recommend viewing on a 5 minute or less timeframe)
Timeframe: 1 day; Lookback period: 10 (also check out 25 if your chart doesn’t show good support/resistance at 10 days lookback – I have found 25 to be useful on charts like SPX)
Timeframe: 1 week; Lookback period: 14
Timeframe: 1 month; Lookback period: 10
The line style and colors are all editable. You can apply a global coloring scheme in the event you want to add this indicator to your chart multiple times with different time frames like I do for the weekly and monthly.
I appreciate your comments/feedback on this indicator to improve. Also let me know if you find this useful, and what settings/ticker you find it works best with!
Also check out my profile for more indicators!

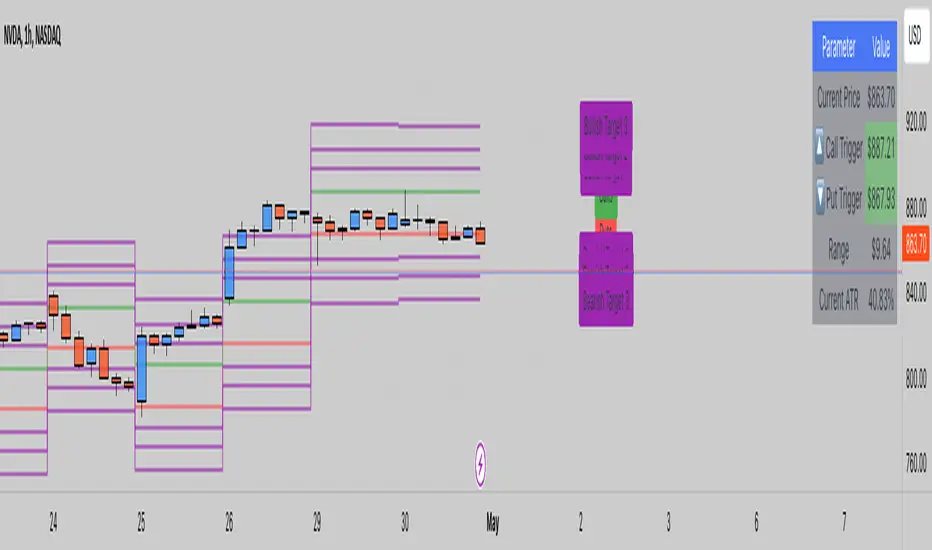
ATR LevelsThe indicator calculates and displays key levels based on the Average True Range (ATR) of an asset's price. The ATR is a measure of market volatility, and this indicator uses it to create trigger levels and ATR target levels. The "ATR Levels" indicator helps traders identify potential entry and exit points based on market volatility, providing valuable information for their trading decisions.
The indicator adds text labels to indicate whether the levels are for "Puts" or "Calls" on the trigger levels, and "Target 1" or "Target 2" on the ATR target levels.
Input Description:
ATR Length: This is an input parameter that allows the user to set the number of periods used to calculate the Average True Range (ATR). The ATR measures the market's volatility, and a higher length value will result in a smoother ATR line.
Trigger Percentage: Another input parameter that determines the percentage above and below the previous day's close at which the trigger levels will be plotted. It allows traders to set the sensitivity of the trigger levels.
Lower Trigger Level Color and Upper Trigger Level Color: These input parameters allow the user to customize the colors of the trigger levels. The indicator will plot two lines representing the lower and upper trigger levels.
Level Size: This input parameter allows the user to adjust the thickness of the trigger level lines.
ATR Target Color: An input parameter that sets the color for the ATR target level lines.
ATR Target Multiplier 1 and ATR Target Multiplier 2: These are input parameters that allow the user to set the multiplier for calculating the ATR target levels. The indicator will plot two ATR target lines above and below the previous day's close, each multiplied by the specified multiplier.
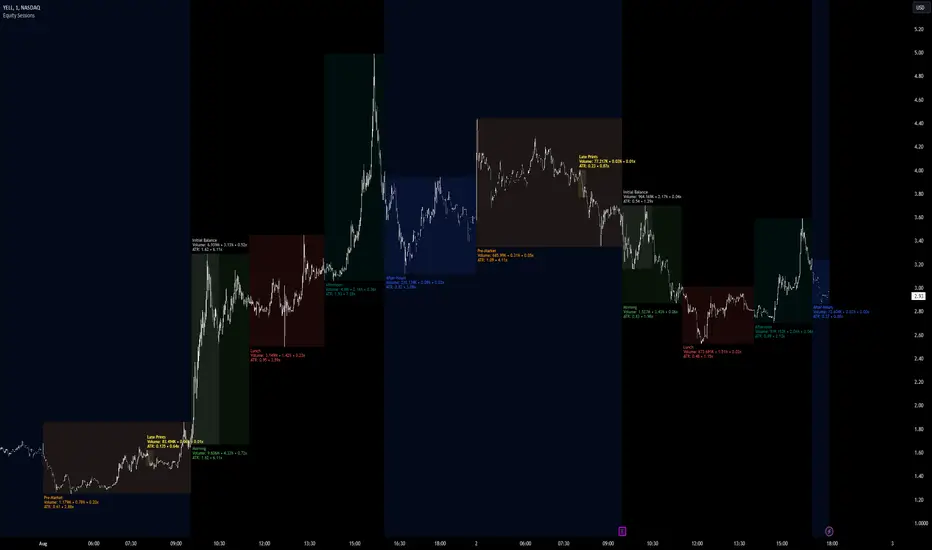
Equity Sessions [vnhilton]Note: Numbers in the chart above, particularly volume, are incorrect as I didn't have extra market data at the time of publication. Default settings are set for US markets.
(OVERVIEW)
This indicator was made specifically for equity markets which have pre-market and after-hours trading, though can be used for any other markets without these sessions, there are many other session indicators better suited for those markets. What makes this indicator different to the hundreds of session indicators out there will be highlighted in bold in the Features section below.
(FEATURES)
- After-Hours session can start earlier if the day ends short and starts after-hours trading earlier due to holidays for example
- Sessions constrained to regular trading hours can also adjust for short days as well
- Show volume for each session and also as a percentage/multiplier of day volume, average day volume with customisable period
- Show range for each session and also as a percentage/multiplier of the daily ATR with customisable period
- Lookback period for the boxes
- Customisable text size, placement, colour, name
- Customisable session lengths and constraints (regular trading hours or all including extending trading hours)
- Customisable border widths, styles and colours, and session background colour
- Toggles to show/hide sessions, volume, day volume, average day volume, session range and day ATR
ATR Extension [QuantVue]The Moving Average ATR Extension Indicator offers a powerful blend of two key market elements: the Average True Range (ATR) and Moving Averages (MA), capturing the dynamics of market momentum and trend direction.
This indicator is used to measure market extension from a user-selected moving average based on multiples of the Average True Range (ATR). By doing this, it becomes remarkably straightforward to spot strength at breakout points or exhaustion near the end of a run.
As a market breaks out the extension indicates a surge in buying pressure, while an extension after a sizeable move can often be an indication of market exhaustion. This extended position essentially reflects over-enthusiastic buying and could be an early warning sign of a potential trend reversal.
Breakout Strength:
Exhaustion:
Give this indicator a BOOST and COMMENT your thoughts!
We hope you enjoy.
Cheers.

ATR Stop Loss v4This indicator plots the current ATR value, and the Long and Short stop losses. Watch the indicator and move your stop loss to the Long or Short as necessary.
Unlike other ATR indicators this one allows the user to customize the table placement of the ATR calculations, and the colors of each row on the table, and the text. The ATR factors can also be edited.

Average True Range Trailing Mean [Alifer]Upgrade of the Average True Range default indicator by TradingView. It adds and plots a trailing mean to show periods of increased volatility more clearly.
ATR TRAILING MEAN
A trailing mean, also known as a moving average, is a statistical calculation used to smooth out data over time and identify trends or patterns in a time series.
In our indicator, it clearly shows when the ATR value spikes outside of it's average range, making it easier to identify periods of increased volatility.
Here's how the ATR Trailing Mean (atr_mean) is calculated:
atr_mean = ta.cum(atr) / (bar_index + 1) * atr_mult
The ta.cum() function calculates the cumulative sum of the ATR over all bars up to the current bar.
(bar_index + 1) represents the number of bars processed up to the current bar, including the current one.
By dividing the cumulative ATR ta.cum(atr) by (bar_index + 1) and then multiplying it by atr_mult (Multiplier), we obtain the ATR Trailing Mean value.
If atr_mult is set to 1.0, the ATR Trailing Mean will be equal to the simple average of the ATR values, and it will follow the ATR's general trend.
However, if atr_mult is increased, the ATR Trailing Mean will react more strongly to the ATR's recent changes, making it more sensitive to short-term fluctuations.
On the other hand, reducing atr_mult will make the ATR Trailing Mean less responsive to recent changes in ATR, making it smoother and less prone to reacting to short-term volatility.
In summary, adjusting the atr_mult input allows traders to fine-tune the ATR Trailing Mean's responsiveness based on their preferred level of sensitivity to recent changes in market volatility.
IMPLEMENTATION IN A STRATEGY
You can easily implement this indicator in an existing strategy, to only enter positions when the ATR is above the ATR Trailing Mean (with Multiplier-adjusted sensitivity). To do so, add the following lines of codes.
Under Inputs:
length = input.int(title="Length", defval=20, minval=1)
atr_mult = input.float(defval=1.0, step = 0.1, title = "Multiplier", tooltip = "Adjust the sensitivity of the ATR Trailing Mean line.")
smoothing = input.string(title="Smoothing", defval="RMA", options= )
ma_function(source, length) =>
switch smoothing
"RMA" => ta.rma(source, length)
"SMA" => ta.sma(source, length)
"EMA" => ta.ema(source, length)
=> ta.wma(source, length)
This will allow you to define the Length of the ATR (lookback length over which the ATR is calculated), the Multiplier to adjust the Trailing Mean's sensitivity and the type of Smoothing to be used for the ATR.
Under Calculations:
atr= ma_function(ta.tr(true), length)
atr_mean = ta.cum(atr) / (bar_index+1) * atr_mult
This will calculate the ATR based on Length and Smoothing, and the resulting ATR Trailing Mean.
Under Entry Conditions, add the following to your existing conditions:
and atr > atr_mean
This will make it so that entries are only triggered when the ATR is above the ATR Trailing Mean (adjusted by the Multiplier value you defined earlier).
ATR - DEFINITION AND HISTORY
The Average True Range (ATR) is a technical indicator used to measure market volatility, regardless of the direction of the price. It was developed by J. Welles Wilder and introduced in his book "New Concepts in Technical Trading Systems" in 1978. ATR provides valuable insights into the degree of price movement or volatility experienced by a financial asset, such as a stock, currency pair, commodity, or cryptocurrency, over a specific period.
ATR - CALCULATION AND USAGE
The ATR calculation involves three components:
1 — True Range (TR): The True Range is a measure of the asset's price movement for a given period. It takes into account the following factors:
The difference between the high and low prices of the current period.
The absolute value of the difference between the high price of the current period and the closing price of the previous period.
The absolute value of the difference between the low price of the current period and the closing price of the previous period.
Mathematically, the True Range (TR) for the current period is calculated as follows:
TR = max(high - low, abs(high - previous_close), abs(low - previous_close))
2 — ATR Calculation: The ATR is calculated as a Moving Average (MA) of the True Range over a specified period.
The ATR is calculated as follows:
ATR = MA(TR, length)
3 — ATR Interpretation: The ATR value represents the average volatility of the asset over the chosen period. Higher ATR values indicate higher volatility, while lower ATR values suggest lower volatility.
Traders and investors can use ATR in various ways:
Setting Stop Loss and Take Profit Levels: ATR can help determine appropriate stop-loss and take-profit levels in trading strategies. A larger ATR value might require wider stop-loss levels to allow for the asset's natural price fluctuations, while a smaller ATR value might allow for tighter stop-loss levels.
Identifying Market Volatility: A sharp increase in ATR might indicate heightened market uncertainty or the potential for significant price movements. Conversely, a decreasing ATR might suggest a period of low volatility and possible consolidation.
Comparing Volatility Between Assets: Since ATR uses absolute values, it shouldn't be used to compare volatility between different assets, as assets with higher prices will consistently have higher ATR values, while assets with lower prices will consistently have lower ATR values. However, the addition of a trailing mean makes such a comparison possible. An asset whose ATR is consistently close to its ATR Trailing Mean will have a lower volatility than an asset whose ATR continuously moves far above and below its ATR Trailing Mean. This can help traders and investors decide which markets to trade based on their risk tolerance and trading strategies.
Determining Position Size: ATR can be used to adjust position sizes, taking into account the asset's volatility. Smaller position sizes might be appropriate for more volatile assets to manage risk effectively.

Adaptive Moving Average with ATR bandsThis is script is essentially "AMA" and was originally developed by Alex Everget , I just added half ATR as a band to AMA to reduce the false breakouts and
use it to confirm hidden divergence with it.
ATR InfoWhat Is the Average True Range (ATR)?
The average true range (ATR) is a technical analysis indicator, introduced by market technician J. Welles Wilder Jr. in his book New Concepts in Technical Trading Systems, that measures market volatility by decomposing the entire range of an asset price for that period.
Each instrument per unit of time passes its average value of the true range, but there are moments when the volatility explodes or abruptly decays, these phenomena introduce large distortions into the average value of the true range.
The ATR_WPB function calculates the average value of the true range for the specified number of bars, while excluding paranormally large and paranormally small bars from the calculation of the average.
For example, if the instrument has passed a small ATR value, then it has many chances to continue moving, but if the instrument has passed its ATR value, then the chances of continuing to move are extremely low.

Stop loss and position size calculator (ATR)Calculates and plots Stop Loss and Position Size, based on desired ATR factor.
Displays Stop Loss Price, SL Distance Percent and Position Size overlayed in the chart and plots a stop loss line.
Additionally Stop Loss, ATR, SL Distance and Position Size are also displayed in the Data Window.
Available settings:
Trade - long / short
ATR timeframe - Allows to use ATR based on different timeframe than the current chart.
ATR factor - Stop Loss will be calculated by multiplying ATR with this factor.
Show last - Amount of previous stop loss lines to plot
Line Offset - Positions previous sl calculation under/above current price.
Calculation Offset - Displays calculation based on price action of previous bar(s).
Label Display Distance - Defines position of label relative to current bar.
Risk - Amount you are going to risk if stop loss is hit.

Price Exhaustion IndicatorThe Price Exhaustion Indicator (PE) is a powerful tool designed to identify trends weakening and strengthening in the financial markets. It combines the concepts of Average True Range (ATR), Moving Average Convergence Divergence (MACD), and Stochastic Oscillator to provide a comprehensive assessment of trend exhaustion levels. By analyzing these multiple indicators together, traders and investors can gain valuable insights into potential price reversals and long-term market highs and lows.
The aim of combining the ATR, MACD, and Stochastic Oscillator, is to provide a comprehensive analysis of trend exhaustion. The ATR component helps assess the volatility and range of price movements, while the MACD offers insights into the convergence and divergence of moving averages. The Stochastic Oscillator measures the current price in relation to its range, providing further confirmation of trend exhaustion. The exhaustion value is derived by combining the MACD, ATR, and Stochastic Oscillator. The MACD value is divided by the ATR value, and then multiplied by the Stochastic Oscillator value. This calculation results in a single exhaustion value that reflects the combined influence of these three indicators.
Application
The Price Exhaustion Indicator utilizes a unique visual representation by incorporating a gradient color scheme. The exhaustion line dynamically changes color, ranging from white when close to the midline (40) to shades of purple as it approaches points of exhaustion (overbought at 100 and oversold at -20). As the exhaustion line approaches the color purple, this represents extreme market conditions and zones of weakened trends where reversals may occur. This color gradient serves as a visual cue, allowing users to quickly gauge the strength or weakness of the prevailing trend.
To further enhance its usability, the Price Exhaustion Indicator also includes circle plots that signify potential points of trend reversion. These plots appear when the exhaustion lines cross or enter the overbought and oversold zones. Red circle plots indicate potential short entry points, suggesting a weakening trend and the possibility of a downward price reversal. Conversely, green circle plots represent potential long entry points, indicating a strengthening trend and the potential for an upward price reversal.
Traders and investors can leverage the Price Exhaustion Indicator in various ways. It can be utilized as a trend-following tool, or a mean reversion tool. When the exhaustion line approaches the overbought or oversold zones, it suggests a weakening trend and the possibility of a price reversal, helping identify potential market tops and bottoms. This can guide traders in timing their entries or exits in anticipation of a trend shift.
Utility
The Price Exhaustion Indicator is particularly useful for long-term market analysis, as it focuses on identifying long-term market highs and lows. By capturing the gradual weakening or strengthening of a trend, it assists investors in making informed decisions about portfolio allocation, trend continuation, or potential reversals.
In summary, the Price Exhaustion Indicator is a comprehensive and visually intuitive tool that combines ATR, MACD, and Stochastic Oscillator to identify trend exhaustion levels. By utilizing a gradient color scheme and circle plots, it offers traders and investors valuable insights into potential trend reversals and long-term market highs and lows. Its unique features make it a valuable addition to any trader's toolkit, providing a deeper understanding of market dynamics and assisting in decision-making processes. Please note that future performance of any trading strategy is fundamentally unknowable, and past results do not guarantee future performance.

ATR VisualizerAdvance Your Market Analysis with the True Range Indicator
The True Range Indicator is a sophisticated screener meticulously developed to bolster your trading execution by presenting an exceptional understanding of the market direction. The centerpiece of this instrument is a distinctive candle configuration depicting the Average True Range (ATR) and the Bear/Bull range. However, it traverses beyond the conventional channels to offer specific market settings to boost your trading decisions.
User-Defined Settings
Broadly, the indicator offers five dynamic settings:
Bear/Bull Range
The Bear/Bull Range outlines the ATR for each candle type - bearish and bullish - and then smartly opts for the pertinent one based on the prevalent market circumstances. This feature aids in comparing the range of bullish and bearish candlesticks, which deepens your understanding of the price action and volatility.
Bearish Range
The Bearish Range isolates and computes the ATR for bearish candles solely. Utilizing this option spots the bear-dominated periods and provides insights about potential market reversals or downward continuations.
Bullish Range
Opposite to the Bearish Range, the Bullish Range setting tabulates the ATR exclusively for bullish candles. It assists in tracking the periods when bulls control, enlightening traders about the possibility of upward continuations or trend reversals.
Average Range
The Average Range provides an unbiased measure of range without prioritizing either bull or bear trends. This model is ideal for traders looking for a holistic interpretation of market behavior, regardless of direction.
Cumulative Average Range
Equally significant is the Cumulative Average Range which calculates the aggregate moving average of the true ranges for an expressed period. This setting is extremely valuable when evaluating the long-term volatility and spotting potential breakouts.
Dual Candle Configuration
Going a step ahead, the True Range Indicator uniquely offers the possibility to incorporate more than one candle estimate on your screen. This ensures simultaneous analysis of multiple market dynamics, thereby enhancing your trading precision multifold.
Concluding Thoughts
In essence, the True Range Indicator is an indispensable companion for traders looking to not only leverage market volatility but also make educated predictions. Equipped with an array of insightful market settings and the ability to display dual candle estimates on-screen, you can customize the functionality to suit your unique trading style and magnify your market performance dramatically.

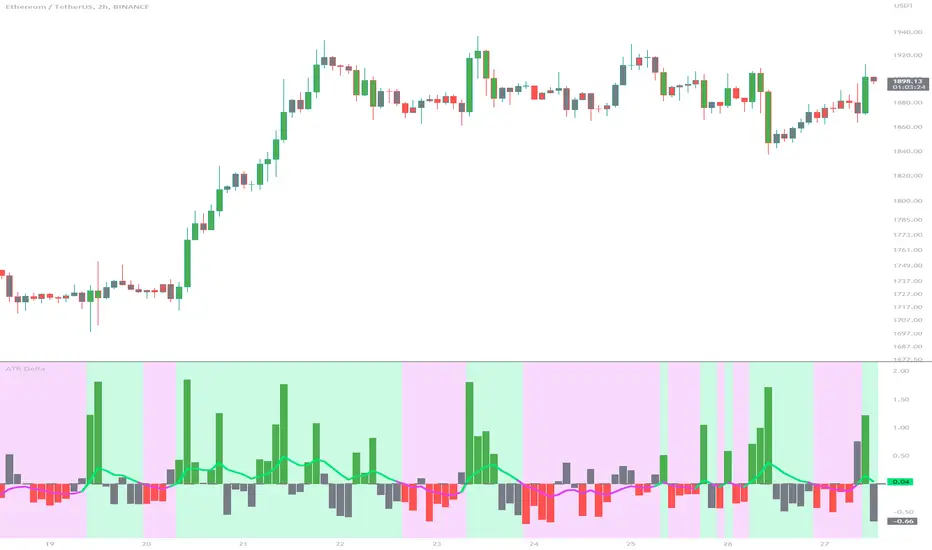
ATR DeltaThe ATR Delta indicator is based on the concept of Average True Range (ATR), which reflects the average price range over a specified period. By calculating the difference between current and previous ATR values, the ATR Delta provides valuable insights into volatility shifts in the market. This information can help traders identify periods of heightened or diminished price movement, enabling them to adjust their strategies accordingly.
The ATR Delta indicator consists of two main calculations:
-- ATR Calculation : The Average True Range (ATR) is calculated using the specified length parameter. It measures the average price range (including gaps) during that period. A larger ATR value indicates higher volatility, while a smaller value indicates lower volatility.
-- ATR Delta Calculation : The ATR Delta is calculated by subtracting the ATR value of the previous bar from the current ATR value. This calculation captures the change in volatility between the two periods, providing a measure of how volatility has evolved.
Positive ATR Delta values indicate an increase in volatility compared to the previous period. It suggests that price movements have expanded, potentially indicating a more active market. On the other hand, negative ATR Delta values indicate a decrease in volatility compared to the previous period. It suggests that price movements have contracted, potentially signaling a calmer or range-bound market.
The ATR Delta indicator uses coloration to visually represent the relationship between the ATR Delta, zero, and a signal line:
-- Green color is assigned when the ATR Delta is positive, above the signal line, and increasing. This coloration suggests a scenario of higher volatility, as the market is experiencing upward momentum in price swings.
-- Red color is assigned when the ATR Delta is negative, below the signal line, and decreasing. This coloration suggests a scenario of lower volatility, as the market is experiencing downward momentum in price swings.
-- Gray color is assigned for other cases when the ATR Delta and signal line relationship does not meet the above conditions.
These colors are reflected in the columns of the ATR Delta as well as the bar coloration.
The ATR Delta indicator includes a signal line, which acts as a reference for interpreting the ATR Delta values. The signal line is calculated as a moving average (EMA) of the ATR Delta over a specified length. It helps smooth out the ATR Delta fluctuations, providing a clearer indication of the underlying trend in volatility changes. When the ATR Delta crosses above the signal line, it may suggest a potential increase in volatility, indicating a market that is becoming more active. Conversely, when the ATR Delta crosses below the signal line, it may suggest a potential decrease in volatility, indicating a market that is becoming less active.
The coloration of the signal line in the ATR Delta indicator helps to differentiate between positive and negative values and provides further insight into market sentiment. When the signal line is positive, indicating increasing volatility, it is colored lime. This color choice reinforces the bullish sentiment and signifies potential opportunities for trend continuation or breakouts. On the other hand, when the signal line is negative, indicating decreasing volatility, it is colored fuchsia. This color choice highlights the bearish sentiment and suggests potential range-bound or consolidation periods. These colors are reflected in the background of the indicator.
The ATR Delta indicator offers several potential applications for traders:
-- Volatility Analysis : The ATR Delta is invaluable for understanding and analyzing volatility dynamics in the market. Traders can observe the changes in ATR Delta values and use them to assess the current level of price movement. This information can help determine the appropriate strategies and risk management approaches.
-- Breakout Strategies : Traders often use the ATR Delta to identify periods of increased volatility, which frequently accompany breakouts. By monitoring the ATR Delta, traders can anticipate potential price breakouts and adjust their entry and exit levels accordingly.
-- Trend Confirmation : Combining the ATR Delta with trend-following indicators allows traders to validate the strength of a trend. Higher ATR Delta values during an uptrend may indicate stronger momentum and a higher likelihood of continuation. Conversely, lower ATR Delta values during a downtrend may suggest a potential consolidation phase or trend reversal.
Limitations :
-- Lagging Indicator : The ATR Delta indicator is based on historical data and calculates the difference between current and previous ATR values. As a result, it may lag behind real-time market conditions. Traders should be aware of this delay and consider it when making trading decisions. It is advisable to combine the ATR Delta with other indicators or price action analysis for a more comprehensive assessment of market conditions.
-- Parameter Sensitivity : The ATR Delta indicator's effectiveness can be influenced by the selection of its parameters, such as the length of the ATR and signal line. Different market conditions may require adjustments to these parameters to better capture volatility changes. Traders should carefully test and optimize the indicator's parameters to align with the characteristics of the specific market or asset they are trading.
-- Market Regime Changes : The ATR Delta indicator assumes that volatility changes occur gradually. However, in rapidly changing market regimes or during news events, volatility can spike or drop abruptly, potentially rendering the indicator less effective. Traders should exercise caution and consider using additional tools or techniques to identify and adapt to such market conditions.
The ATR Delta indicator is a valuable tool for traders seeking to analyze and monitor volatility dynamics in the market. By calculating the difference between current and previous ATR values, it provides insights into changes in price movement and helps identify periods of increased or decreased volatility. Traders can leverage the ATR Delta to fine-tune their strategies, validate trend strength, and identify potential breakout opportunities. However, it is essential to recognize the limitations of the indicator, including its lagging nature and sensitivity to parameter selection. By combining the ATR Delta with other technical analysis tools and applying sound risk management practices, traders can enhance their decision-making process and potentially improve their trading outcomes.
Force Index with ATR channels-----------------------------------------------------------------
General Description:
This indicator multiplies the change of closing price for any bar by volume during that bar and plots an exponential moving average of the result. It is excellent for analyzing volume, deeper than simply looking at volume bars.
The cool thing about this particular version of the Force Index is that Average True Range (ATR) channels have been added to turn it into an excellent tool for identifying intermediate tops and bottoms. Force Index with ATR channels does not catch all turns, but the ones it identifies deserve very serious attention.
The indicator works on any market, any instrument, any timeframe, and any market condition.
-----------------------------------------------------------------
How it works:
Calculation:
Force Index = {Close (current period) - Close (prior period)} x Volume (current period)
If we smooth the indicator with a moving average the indicator gives much better trading signals.
Force Index(smoothed) = X-period EMA of Force Index
Changing the EMA length changes the focus of Force Index. Longer-term 13-bar EMA of Force Index helps identify intermediate trend reversals. Shorter-term 2-bar EMA helps identify market extremes.
The indicator also has the option to plot ATR channels to Force Index. Whenever the Force Index rises above or falls below its 3-ATR channel, it signals that the ticker has reached an area of an unsustainable extreme. That’s where rallies and declines become exhausted and prices tend to reverse. This is one of very few tools that are equally efficient in calling both top and bottom areas. This indicator places a red dot above the plot when the EMA of Force Index rises above the 3-ATR channel. It places a green dot underneath the plot when that EMA declines below the 3-ATR channel.
These signals work especially well on higher timeframes, weekly charts for example. Of course, you are welcome to experiment with them in any timeframe.
-----------------------------------------------------------------
Options/adjustments for this indicator:
* EMA Period of Force Index
* EMA Period for ATR calculations
* Plot ATRs?
* Plot ATR Signals?

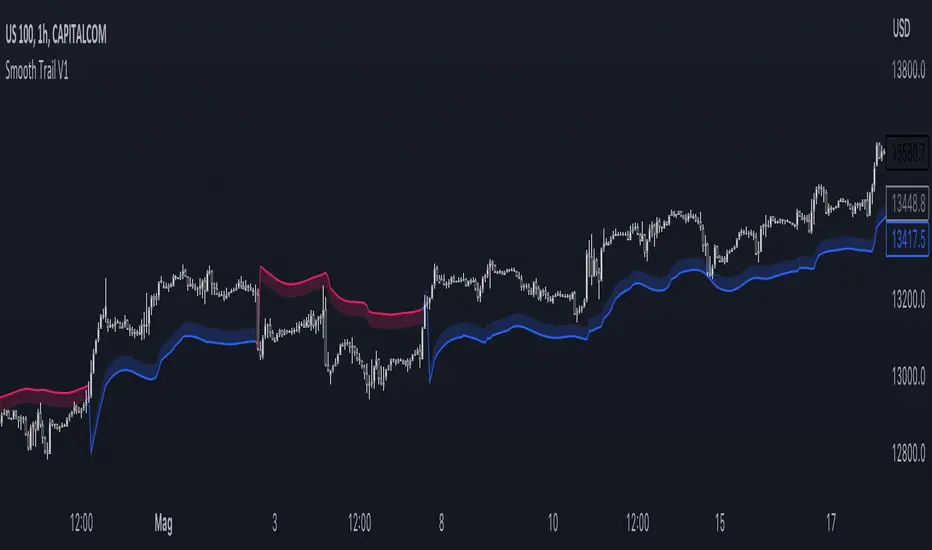
Smooth Trail V1Please, enjoy your new game changing tradingview indicator, may I present you: the Smooth Trail (first version).
The Smooth Trail is an indicator that works just like a super trend, but it has a completely different usage and potential.
The super trend works following the price and displaying a line that uses the ATR to determine how far it has to be from the actual price, and many new trader like to use the indicator thanks to his easy readability and the buy sell signals that it shows, unfortunately this is not the best usage of the indicator and it often leads to lose money on the markets.
The main characteristics that this indicator has is that, not like the normal super trend, it follow the trend the better adapting itself in the retracement phases.
The second feature that dictate the best usage of this indicator, is that it shows a zone in which to buy or sell to have the best risk to reward ratio.
The indicator also works as dynamic level of support and resistance and can be used the best for trend following strategies to maximize the profits.
The first input, the multiplier, is used to determine how many times the ATR has to be added or subtracted in order to plot the indicator.
The second input, the length, is used to determine how many candle the indicator and the ATR have to consider for the calculation.
The third and last input, the zone width, is used to calculate the width of the zone displayed by the indicator, and is the factor that will be multiplied to the ATR, this means that if you leave the settings as default, the zone will be 1 ATR or 34 candle width.
This indicator is great to use in confluence with other indicator or with various candlestick pattern.
VIX, ATR, and Volatility Indicatorhere what the indictor do !
The "VIX, ATR, and Volatility Indicator" combines the Volatility Index (VIX), Average True Range (ATR), and moving averages to provide insights into market volatility.
VIX (Volatility Index):
The VIX measures the expected volatility in the market over the next 30 days. A higher VIX value indicates increased market volatility, while a lower value suggests lower volatility.
ATR (Average True Range):
The ATR is a technical indicator that measures the average range between high and low prices over a specified period. It provides a sense of the market's volatility by considering price movements. Higher ATR values indicate greater volatility, while lower values indicate lower volatility.
Moving Averages:
The indicator calculates both an Exponential Moving Average (EMA) and Simple Moving Average (SMA) with a specific period (e.g., 50).
Moving averages smooth out price data to identify trends and potential areas of support or resistance.
Volatility Detection:
By comparing the current closing price to the EMA and SMA, the indicator determines if there is high volatility.
If the current closing price is higher than either the EMA or SMA, it indicates potential high volatility.
Visualization:
The VIX and ATR are typically plotted on the chart, providing a visual representation of market volatility and price range.
Additionally, markers or labels may be used to highlight periods of high volatility when the current price exceeds the moving averages.
what are the VIX and ATR
Volatility Index (VIX):
Monitor the VIX value from financial platforms or market data providers. A higher VIX value indicates increased market volatility, suggesting potential trading opportunities. Conversely, a lower VIX value indicates lower volatility, which may influence your trading strategy.
Average True Range (ATR):
Calculate the ATR manually or use charting platforms that provide ATR as an indicator.
Plot the ATR on your trading chart to visualize the range of price movements.
Determine suitable entry and exit points based on ATR values. For example, higher ATR values may indicate larger potential price swings, while lower ATR values may suggest a more stable market.
how it work
Fetching VIX Data:
The request.security function is used to fetch the daily VIX data from the "CBOE:VIX" symbol. It retrieves the closing price of the VIX for each day.
Calculating ATR:
The ta.atr function calculates the Average True Range (ATR) with a period of 14. ATR measures the average range between the high and low prices over the specified period, providing an indication of market volatility.
Calculating Moving Averages:
Two types of moving averages are calculated: Exponential Moving Average (EMA) and Simple Moving Average (SMA). Both moving averages are calculated using a period of 50, but you can adjust the period as needed.
The ta.ema function calculates the Exponential Moving Average, which places greater weight on recent prices.
The ta.sma function calculates the Simple Moving Average, which gives equal weight to all prices in the period.
Identifying High Volatility:
The indicator determines if there is high volatility by comparing the current closing price to both the EMA and SMA.
If the current closing price is higher than either the EMA or SMA, the isHighVolatility variable is set to true, indicating potential high volatility.
Plotting the Indicators:
The VIX and ATR are plotted using the plot function, assigning colors and line widths for visual differentiation.
The plotshape function is used to plot markers below the bars to indicate highly volatile periods. The isHighVolatility variable determines when the markers appear.

ATR Momentum [QuantVue]ATR Momentum is a dynamic technical analysis tool designed to assess the momentum of a securities price movement. It utilizes the comparison between a faster short-term Average True Range (ATR) and a slower long-term ATR to determine whether momentum is increasing or decreasing.
This indicator visually represents the momentum relationship by plotting both ATR values as lines on a chart and applying color fill between the lines based on if momentum is increasing or decreasing.
When the short-term ATR is greater than the long-term ATR, representing increasing momentum, the area between them is filled with green.
Conversely, when the short-term ATR is less than the long-term ATR line, the area between them is filled with red. This red fill indicates decreasing momentum.
Don't hesitate to reach out with any questions or concerns.
We hope you enjoy!
Cheers.

[SMT] Buy & Sell Renko Based - AlertsThis is a custom indicator that implements a trading strategy based on Renko charts, but they can be used on regular candlestick charts and on any time frame. Renko charts are known for filtering market noise and displaying price movements in a clearer way. However, it is important to note that this indicator is provided for educational and informational purposes only and is not a guarantee of profitable returns.
Features:
- The indicator uses Renko charts to generate buy and sell signals.
- Renko bricks are built based on a predefined price variation, rather than time.
- The length of the Average True Range (ATR) used to calculate Renko bricks can be customized.
- Buy signals are generated when the price crosses below the current Renko brick.
- Sell signals are generated when the price crosses above the current Renko brick.
- Entry points are marked with "Buy" and "Sell" arrows on the chart.
It is essential to emphasize that no indicator or trading strategy guarantees profitable results. The financial market is complex and subject to unpredictable changes. It is recommended to perform additional tests and analysis before using this indicator on a real trading account.
Always remember to manage your risks properly and consider other factors such as fundamental analysis and market conditions when making trading decisions. The use of this indicator is entirely the user's responsibility.
DISCLAIMER: This indicator is not financial advice and should not be interpreted as such. Always consult with a qualified financial professional before making any investment decisions.
