Quant VWAP System 3.8 This is the lower-indicator companion to the "Quant VWAP System." While the main chart tells you where the price is, this oscillator tells you how statistically significant the move is.
It uses a Z-Score algorithm to normalize price action. This means it ignores dollar amounts and instead measures how many Standard Deviations (SD) the price is away from its mean (VWAP). This allows you to instantly spot "Overbought" or "Oversold" conditions on any asset (Bitcoin, Forex, or Stocks) without needing to guess.
Key Features:
1. Normalized Extremes (The "Kill Zones")
±2.0 SD: These dotted lines represent statistical extremes. When the signal line crosses above +2.0, the asset is mathematically expensive (Overbought). When it crosses below -2.0, it is mathematically cheap (Oversold).
The Logic: Price rarely sustains movement beyond 2 Standard Deviations without a reversion or a pause.
2. The Squeeze Radar (Yellow Dots)
Volatility Detection: A row of Yellow Dots appearing on the center line indicates a "Squeeze."
What it means: The Standard Deviation bands are compressing. Energy is building.
Warning: DO NOT trade Mean Reversion when you see Yellow Dots. A squeeze often leads to a violent breakout. Wait for the dots to disappear to confirm the direction of the explosion.
3. Momentum Coloring
Green Line: Z-Score is rising (Bullish Momentum).
Red Line: Z-Score is falling (Bearish Momentum).
This helps you spot divergences (e.g., Price makes a Higher High, but the Oscillator makes a Lower High = Exhaustion).
How to Trade with It
Strategy A: The "Zero Bounce" (Trend Continuation)
Scenario: You are in a Bull Trend.
Signal: The Oscillator line pulls back to the Zero Line (White), turns Green, and curls upward.
Meaning: Price has tested the average (VWAP) and buyers have stepped in. This is a high-probability entry for trend continuation.
Strategy B: The "Extreme Fade" (Reversion)
Scenario: The Oscillator pushes deep into the Red Zone (+2.0 SD).
Signal: The line turns Red and crosses back down below the +2.0 dotted line. A small Red Triangle will appear.
Meaning: The statistical extension has failed, and price is likely snapping back to the mean.
Strategy C: Squeeze Breakout
Scenario: Yellow Dots appear on the center line.
Action: Stop trading. Wait.
Signal: The dots disappear, and the line shoots aggressively through +1.0 SD (Long) or -1.0 SD (Short). Ride the momentum.
Bands and Channels

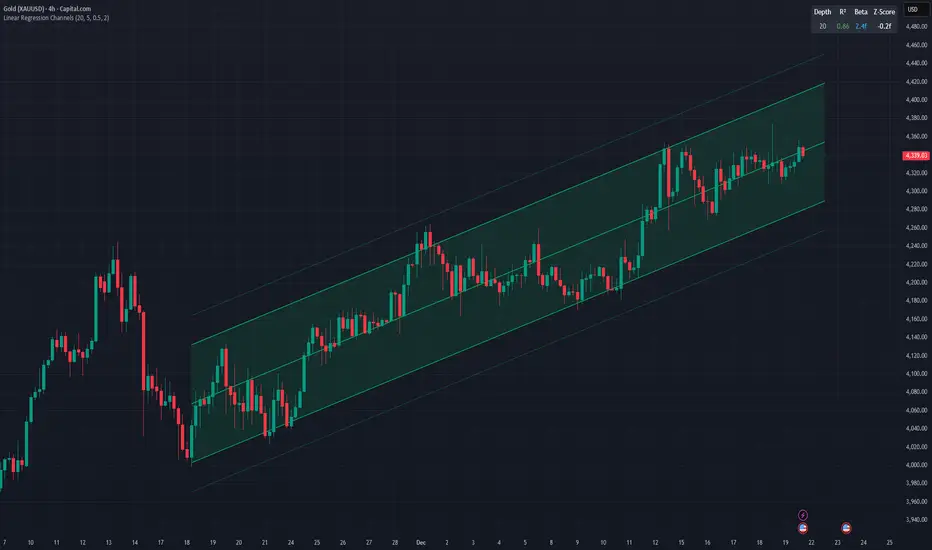
Linear Regression ChannelsThis indicator dynamically identifies and plots the best-fit linear regression channels based on recent pivot points, optimizing for statistical strength across user-defined depths.
How It Works (Technical Methodology)
1. Pivot Point Detection
The indicator uses Pine Script's ta.pivothigh() and ta.pivotlow() functions with a configurable sensitivity length to detect swing highs and lows. All recent pivot indices are stored in an array (limited to avoid performance issues), providing potential starting points for regression calculations.
2. Multi-Depth Evaluation
Users input comma-separated "Pivot History Depths" (e.g., "5,20,50"). For each depth:
- The script evaluates regression fits starting from the most recent pivots, up to the specified depth count.
- It calculates linear regression statistics for each possible channel originating from those pivot bars backward to the current bar.
3. Linear Regression Calculation
For each candidate channel:
- Slope (m) and intercept (b) are computed using least-squares method.
- R-squared (R²) measures goodness of fit (how well price follows the trend line).
- Standard error of the estimate is calculated to quantify volatility around the regression line.
- A composite score = R² × log(length) prioritizes stronger fits on longer periods.
4. Best-Fit Selection and Validation
- Only channels with R² ≥ user-defined minimum (default 0.5) are considered valid.
- The channel with the highest score for each depth is selected and drawn.
- This ensures the most statistically significant and relevant channels are displayed, avoiding weak or short-term noise.
5. Channel Construction
- Mean Line: The regression trend line extended slightly into the future.
- Inner Channels: ± user-configurable standard deviation multiplier (default 2.0σ) around the mean.
- Outer Bands: ±1.5× the inner deviation for additional visual context.
- Filled areas between mean and inner channels for better visibility.
- Color: Green shades for upward slopes (bullish trend), red shades for downward slopes (bearish trend).
6. Dashboard and Statistics
- Optional table in the top-right corner displays for each depth:
- Depth value
- R² (colored green if >0.7, orange otherwise)
- Slope (Beta) – positive blue for uptrend, red for downtrend
- Current Z-Score: How many standard deviations the latest close is from the expected regression value (yellow if |Z| > 2)
How to Use
Regression channels help identify trending markets, potential mean reversion, and overextension.
- Upward Channels (Green): Price above the mean may indicate strength; pullbacks to the mean or lower band offer long opportunities. Overextension above upper band could signal exhaustion.
- Downward Channels (Red): Price below the mean may indicate weakness; rallies to the mean or upper band offer short opportunities. Overextension below lower band could signal capitulation.
- High R² (>0.7): Strong trending channel – trade in direction of slope.
- Low R²: Choppy/range-bound market – avoid trend-following trades.
- Z-Score: |Z| > 2 suggests price is statistically overextended from the trend (potential reversion setup).
- Multi-Depth: Smaller depths catch short-term trends; larger depths capture major trends. Use multiple for confluence across timeframes.
Combine with volume, support/resistance, or other indicators for confirmation.
Disclaimer
This indicator is a technical analysis tool and should be used in conjunction with other forms of analysis. Past performance does not guarantee future results. Always use proper risk management.
cd_VW_Cx IMPROVED - Quant VWAP System: Regime, Magnets & Z-ScoQuant VWAP System: Regime, Magnets & Z-Score Matrix
This indicator is a comprehensive Quantitative Trading System designed to move beyond simple support and resistance. Instead of static lines, it uses Statistical Probability (Z-Score) and Standard Deviation to define the current market regime, identify institutional value zones, and project high-probability liquidity targets.
It is engineered for Day Traders and Scalpers (Crypto & Futures) who need to know if the market is Trending, Ranging, or preparing for a Breakout.
1. The "Regime" System (Standard Deviation Bands)
The core engine anchors a VWAP (Volume Weighted Average Price) to your chosen timeframe (Daily, Weekly, or Monthly) and projects volatility bands based on market variance.
The Trend Zone (Inner Band / 1.0 SD): This is the "Fair Value" zone. In a healthy trend, price will pull back into this zone and hold. A hold here signals a high-probability continuation (Trend Following).
The Reversion Zone (Outer Band / 2.0 SD): This represents a statistical extreme. Price rarely sustains movement beyond 2 Standard Deviations without a reversion. A touch of this band signals "Overbought" or "Oversold" conditions.
2. Liquidity Magnets (Virgin VWAPs)
The script automatically tracks "Unvisited VWAPs" from previous sessions. These are price levels where significant volume occurred but have not yet been re-tested.
The Logic: Algorithms often target these "open loops." The script visualizes them as Blue Dashed Lines with price tags.
Smart Scaling (Anti-Scrunch): Includes a custom "Ghost Engine" that automatically hides or "ghosts" magnets that are too far away. This prevents your chart from being squashed (scrunched) on lower timeframes, keeping your candles perfectly readable while still tracking targets in the background.
3. The Quant Matrix (Dashboard)
A real-time Heads-Up Display (HUD) that interprets the data for you:
Regime: Detects Volatility Squeezes. If the bands compress, it signals "⚠ SQUEEZE", warning you to stop mean-reversion trading and prepare for an explosive breakout.
Bias: Color-coded Trend Direction (Bullish/Bearish) based on VWAP slope.
Signal: actionable text prompts such as "BUY DIP" (Trend Following), "FADE EXT" (Mean Reversion), or "PREP BREAK" (Squeeze).
4. Visual Intelligence
Bold Day Separators: Clear, vertical dotted dividers with Date Stamps to instantly separate trading sessions.
Dynamic Labels: Floating labels on the right axis identify exactly which deviation level is which, preventing chart confusion.
How to Use
Strategy A: The Trend Pullback (continuation)
Check Matrix: Ensure Bias is BULLISH (Green).
Wait: Allow price to pull back into the Inner Band (Dark Green Zone).
Trigger: If price holds the Center VWAP or the -1.0 SD line, enter Long.
Target: The next Liquidity Magnet above or the +2.0 SD band.
Strategy B: The Reversion Fade (Counter-Trend)
Check Matrix: Ensure price is labeled "EXTREME" or Signal says "FADE EXT".
Trigger: Price touches or pierces the Outer Band (2.0 SD).
Action: Enter counter-trend (Short) with a target back to the Center VWAP (Mean Reversion).
Strategy C: The Magnet Target
Identify a "MAGNET" line (Blue Dashed) near current price.
These act as high-probability Take Profit levels. Price will often rush to these levels to "close the loop" before reversing.
Settings
Anchor: Daily (default), Weekly, or Monthly.
Magnet Focus Range: Adjusts how aggressively the script hides distant magnets to fix chart scaling (Default: 2%).
Visuals: Fully customizable colors, label sizes, and dashboard position.

EMA & Stochastic SignalsEma 200 and ema 500 + stochastic crossover. Buys when price is above emas and sells when price is below emas.

NeuralFlow Forecast Levels - User InputsThis is a companion indicator that plots AI-adaptive market equilibrium and expansion mapping levels directly on the SPY chart.
NeuralFlow Forecast Levels are generated through a Artificial Intelligence framework trained to identify:
Where price is statistically inclined to re-balance
Where expansion zones historically exhaust rather than extend
This is structure mapping, not prediction.
......................................................................................
What the Bands Represent?
AI Equilibrium (white core)
Primary weekly balance zone where price is most likely to mean-revert.
Predictive Rails (aqua / purple)
High-confidence corridor of institutional flow containment.
Outer Zones (green / red)
Expansion limits where continuation historically begins to decay.
Extreme Zones (top / bottom)
Rare deviation envelope where auction completion is statistically favored.
.The engine updates only when underlying structure changes —
not when candles fluctuate intraday.
.................................................................................................................
Usage Context
These levels are contextual reference zones, not entry signals. They are designed to answer:
Where does price matter?
Where does continuation weaken?
Where does balance statistically reassert itself?
Risk Disclaimer
Educational and analytical use only. Not financial advice.

Performance with Okuninushi Line Area Determinations**Performance Indicator with Market Structure Analysis**
Building upon TradingView's official Performance indicator, I've added a custom column to assess current market structure using my Okuninushi Line methodology, which visualizes the AB structure concept.
**What is the AB Structure?**
The AB structure identifies equilibrium levels based on recent price action. The Okuninushi Line calculates the 50% midpoint between the highest high and lowest low over a specified lookback period. In this implementation, I use a 65-day period on the daily timeframe (representing one quarter: 13 weeks × 5 trading days), though this is fully customizable.
**Market Structure Classification:**
- **Above Okuninushi Line** → "upper to okuni" → Price is in the **Premium Area** (bullish structure)
- **Below Okuninushi Line** → "down to okuni" → Price is in the **Discount Area** (bearish structure)
This additional column provides an instant visual reference for whether each asset is currently trading above or below its equilibrium level, complementing the traditional performance metrics with structural context.
---


Maestro 4hThis indicator is designed to help traders analyze market trends and identify potential trading opportunities.
It provides clear visual signals based on price behavior and technical calculations, allowing traders to better understand market structure, momentum, and direction.
The indicator can be used on any market and timeframe, making it suitable for both intraday and swing trading.
It is intended as a decision-support tool and should be used in combination with proper risk management and other forms of analysis.

Muros Multi-TF Pro Dashboard v2fwrvw w fw wf fs rf wf wf jni hb hu huhb yhi ib i ibb uoobu ic biicb ibc bic k

SFI Follow Trend Level 1 ( SFI Academy )“SFI Trading Level 1 Indicator is a proprietary indicator used by SFI Academy for its students, in combination with SFI Academy’s exclusive capital management toolset.”

HMA Direction Scalping + Liquidity Zones + Metricsuses hma to determine buy and sell using 9hma for direction.

Offset Bollinger Bandsbollinger band offset by 10 period. Appied on daily time frame for entry and exit

spy scalp cheat codecombines hma directional scalping strategy plus the option to use optional stochastic quad band to confrim entry

RSI Divergences KittenRSI Divergences + Adjustable RSI σ-Bands + Band Pierce Signals (with optional US weekend filter)
Description:
This indicator combines three RSI tools into one clean workflow:
1. RSI σ-Bands (mean ± k·σ)
It builds dynamic upper/lower bands around RSI using a moving mean and standard deviation. These bands adapt to regime changes (expanding in volatile periods, contracting in quiet periods). Bands can be clipped to RSI’s natural 0–100 range and optionally filled for readability.
2. Band “Pierce” Signals
It prints a marker when RSI crosses outside the upper band (overextension) or outside the lower band (underextension). These pierces are useful as timing signals for mean-reversion setups, especially when you expect price to revert back toward a reference mean (e.g., VWAP). Optional “re-entry” markers show when RSI crosses back inside the bands.
3. Proper RSI Divergences (Regular + Hidden)
Divergences are detected using RSI pivots (not price pivots). At each RSI pivot, the script samples the corresponding price high/low on that pivot bar and compares it to the previous pivot within a configurable bar-distance window.
• Bullish divergence: price lower low + RSI higher low
• Hidden bullish: price higher low + RSI lower low
• Bearish divergence: price higher high + RSI lower high
• Hidden bearish: price lower high + RSI higher high
Line width is configurable for visibility.
Manual Band Adjustment (Near-Miss Control):
If your best reversals “nearly” tag the band, you can manually tune sensitivity without rewriting the math:
• Band offset (RSI points): nudges trigger levels
• Band width scale: tightens/widens the σ-band envelope
US Weekend Filter (Optional):
You can optionally suppress pierce/divergence signals during US weekend hours (Fri 17:00 ET → Sun 17:00 ET) and optionally shade those periods to help isolate low-liquidity behavior.
Notes / Intended Use:
This is designed as a mean-reversion timing tool, not a standalone trading system. For best results, combine signals with a market “mean” (e.g., rolling VWAP) and basic risk controls.

PDH PDL PWH PWL + IMB 15m / 1H / 4H + Weekly LogicPDH PDL PWH PWL indycators
weekly indycators automaticly generated.
for a every week

NeuralFlow Forecast Levels | SPY WeeklyThis is a companion script that plots AI-adaptive market equilibrium & expansion mapping levels for SPY on chart.
NeuralFlow Forecast levels are generated though a Artificial Intelligence framework trained to identify where price is statistically inclined to re-balance and where expansion zones historically exhaust rather than extend.
What the Bands Represent
Band Layer Meaning
AI Equilibrium (white core) Primary weekly balance zone where price is most likely to mean-revert
Predictive Rails (aqua / purple) High-confidence corridor of institutional flow containment
Outer Zones (green / red) Expansion limits where continuation historically decays
Extreme Zones (top/bottom) Rare deviation envelope where auction completion is statistically favored
NeuralFlow operates Artificial Intelligence models trained specifically to map statistical re-balancing behavior, not trader predictions or sentiment. No discretionary drawing. No correlations. No lagging overlays.
This engine updates only when underlying structure changes — not when candles fluctuate intraday.
Risk:
Educational & analytical use only. Not financial advice

NeuralFlow Forecast Levels| NIFTY WeeklyThis is a companion script that plots AI-adaptive market equilibrium & expansion mapping levels on chart.
NeuralFlow Forecast levels are generated though a Artificial Intelligence framework trained to identify where price is statistically inclined to re-balance and where expansion zones historically exhaust rather than extend.
What the Bands Represent
Band Layer Meaning
AI Equilibrium (white core) Primary weekly balance zone where price is most likely to mean-revert
Predictive Rails (aqua / purple) High-confidence corridor of institutional flow containment
Outer Zones (green / red) Expansion limits where continuation historically decays
Extreme Zones (top/bottom) Rare deviation envelope where auction completion is statistically favored
NeuralFlow operates Artificial Intelligence models trained specifically to map statistical re-balancing behavior, not trader predictions or sentiment. No discretionary drawing. No correlations. No lagging overlays.
This engine updates only when underlying structure changes — not when candles fluctuate intraday.
Risk:
Educational & analytical use only. Not financial advice

NeuroPolynomial ChannelNeuroPolynomial Channel is a structure-oriented price channel designed to model price curvature, balance, and realized deviation using recursive non-linear smoothing.
Rather than relying on standard moving averages or statistical volatility assumptions, the indicator separates structure estimation from deviation measurement, allowing each to adapt independently.
Structural Core (Recursive Curvature Line)
The centerline is generated using a recursive smoothing process with controlled curvature.
By blending current price with historical estimates and introducing a curvature term, the line forms a non-linear structural path that adapts gradually to changing market conditions.
This approach emphasizes:
Structural continuity over short-term noise
Gradual regime transitions instead of abrupt shifts
User-controlled responsiveness via curvature and blending parameters
The result is a centerline that reflects price structure, not just short-term averages.
Deviation Field (Adaptive Bands)
Channel width is derived from the observed absolute deviation between price and the structural core.
Instead of assuming a normal distribution, deviation is measured directly from realized price behavior and expressed through multiple band layers:
Inner structure boundary
Intermediate deviation zone (optional)
Outer deviation boundary (optional)
As price behavior changes, the deviation field expands or contracts organically, providing a contextual view of compression, balance, and expansion.
Interpretation Framework
Balance & Control
Persistent acceptance on one side of the structural core reflects directional control.
Compression
Narrow deviation bands signal reduced realized movement and potential energy buildup.
Expansion
Widening bands indicate increasing deviation and active range development.
..................................................................................................................
The indicator is intended for contextual interpretation, not mechanical signal generation.
Configuration
Length – Structural memory depth
Morph Factor – Degree of historical blending
Flatten Factor – Curvature sensitivity control
Deviation Multipliers – Band spacing
Visual Controls – Theme and candle tinting
Notes:
Deviation is derived from realized price movement and adapts gradually.
Recursive calculations initialize from available chart history.
This tool does not forecast future prices.
Disclaimer:
This indicator is provided for analytical and educational purposes only.
It does not constitute financial advice or a trading recommendation.

Liquidity Sweep Sniper AP StyleAP Capital – Liquidity Sweep Sniper (Fab-Style)
📌 Overview
This indicator is a precision scalping tool inspired by professional liquidity-based trading concepts often demonstrated by elite intraday scalpers.
The script focuses on liquidity sweeps followed by strong displacement, aiming to capture short, high-probability momentum moves — particularly effective on lower timeframes (1–5 min) during active market sessions.
It is not a signal spam tool. Signals appear only when multiple objective conditions align.
🧠 Core Concept
Markets do not move randomly — they seek liquidity before expanding.
This indicator identifies:
Buy-side / Sell-side liquidity
Liquidity sweeps (stop-hunts)
Strong displacement candles reclaiming price
Optional higher-timeframe trend alignment
Only when all conditions are met does a signal print.
🔍 What the Indicator Detects
1️⃣ Liquidity Pools
Equal highs or equal lows detected within a configurable lookback
Minimum number of touches required
ATR-based tolerance to adapt to volatility
These levels represent areas where stop orders are likely resting.
2️⃣ Liquidity Sweep
A valid sweep requires:
Price to wick beyond the liquidity level
Candle to close back inside the range
This indicates failed breakout / stop-hunt behaviour.
3️⃣ Displacement Confirmation
After the sweep, the candle must show:
Strong body (default >60% of candle range)
Candle range large relative to ATR
Clear directional intent (momentum)
This filters out weak reactions and chop.
4️⃣ Optional Trend Filter
EMA-based higher-timeframe bias
Helps align scalps with dominant direction
Can be enabled or disabled
📈 Signals
BUY: Sell-side liquidity sweep → bullish displacement
SELL: Buy-side liquidity sweep → bearish displacement
Signals are plotted directly on the chart and can be used with alerts.
⚙️ Recommended Usage
Markets: XAUUSD, indices, liquid FX pairs
Timeframes: 1m–5m
Sessions: London & New York (best performance)
Risk Management: Always required — this tool does not place trades
Best used as a confirmation tool, not standalone.
⚠️ Important Notes
This indicator is inspired by liquidity-based scalping concepts, not an exact replication of any individual trader’s private strategy.
No indicator predicts the future — this tool highlights high-probability scenarios, not guarantees.
Past performance is not indicative of future results.

RSI by ErdincALGoTradeBased on the RSI logic, it only gives strong buy/sell signals when buy/sell orders occur simultaneously in 3-5-15 intervals. I'm sharing my own software to achieve 99% success for 25-30 USD movements in gold charts.

Solid Dynamic Corridors[AkmanBey]
Solid Dynamic Corridors: Technical Overview
The Solid Dynamic Corridors indicator is a sophisticated, multi-layered trend-following and volatility-channel system. Unlike standard indicators, it combines RSI-derived price projections, ATR-based volatility expansion, and a 20-level support/resistance matrix to identify high-probability trend zones.
1. RSI-Based Price Projection
The foundation of the indicator starts with an inverse calculation of RSI levels. By setting specific overbought (51) and oversold (49) thresholds, the script projects these momentum levels directly onto the price chart as dynamic bands. This allows the trader to see where the price would be if it reached those specific RSI exhaustion points.
2. The Multi-Layered Support & Resistance Matrix
The core strength of the script lies in its 20-level calculation engine. It computes 10 distinct resistance levels (H1-H10) and 10 distinct support levels (L1-L10) using a hybrid blend of:
* Exponential Moving Averages (EMA)
* Average True Range (ATR)
* Historical Extremes (High/Low Lookbacks)
* Price Action Ratios
These levels are then averaged to create the Final Resistance and Support Averages, providing a "solid" boundary that filters out market noise more effectively than a single moving average.
3. Volatility-Adjusted Dynamic Expansion
To adapt to changing market conditions, the indicator employs an ATR-based expansion mechanism. By applying a user-defined multiplier to the current ATR, the bands expand during high-volatility periods and contract during consolidation, ensuring the "Corridors" remain relevant regardless of market speed.
4. Trend Tracking & Persistence Logic
The system features a unique Signal Persistence logic. When a trend shift is detected (via an ATR-based trailing stop mechanism):
* Buy/Sell Signals: Triggered when the price breaks through the calculated trailing limits.
* Persistence Lines: Once a signal is generated, the indicator "locks" the support or resistance level at that moment and tracks it for an extended period (up to 19,999 bars). This helps traders identify long-term historical anchor points even after the immediate trend has passed.
5. Extreme Range Analysis (HH-LL)
Finally, the script calculates Extreme Upper and Lower Bounds based on the highest and lowest points of the signal tracking lines. This creates a "Master Range" that colors the chart dynamically, signaling whether the market is in a Red (Overextended High), Green (Overextended Low), or Blue (Neutral) state.
Summary of Key Features
* Hybrid Momentum/Volatility Engine: Combines RSI and ATR logic.
* Noise Reduction: Averages 20 different data points to find "True" support and resistance.
* Long-Term Reference: Unique tracking system that remembers signal levels for thousands of bars.
* Visual Clarity: Intuitive color coding for trend direction and extreme price zones.

Liquidity Void and Repair EngineLiquidity Void & Repair Engine
OVERVIEW
The Liquidity Void & Repair Engine is a high-fidelity institutional order flow tool designed to identify and track "Market Imbalances" or "Fair Value Gaps" (FVG). Unlike standard gap indicators that clutter the chart with every minor price jump, this engine uses Volatility-Adjusted Range Mapping to isolate high-conviction voids where price moved so rapidly that liquidity was left "unfilled."
The standout feature of this tool is its Active Repair Logic. The engine doesn't just draw static boxes; it monitors price action in real-time to determine when an imbalance has been "healed" by subsequent trading volume, providing a dynamic look at where the market has "unfinished business."
TECHNICAL LOGIC & ORIGINALITY
This script is published Open Source to contribute to the Pine Script community’s understanding of dynamic object management and order flow visualization.
ATR-Relative Filtering: To ensure only significant voids are plotted, the script uses a user-defined ATR (Average True Range) multiplier. This filters out market noise and focuses on institutional "impulse" moves.
Dynamic Box Management: Utilizing the Pine Script box array system, the script manages memory efficiently by updating existing objects rather than creating redundant ones.
The "Repair" Algorithm: The script tracks the high and low of every active void. When price action fully traverses the coordinates of a void, the script "seals" the box, visually marking the moment of liquidity equilibrium.
HOW TO USE
1. Identifying the "Magnet" (The Void)
When price moves aggressively, it leaves a "hole" in the auction.
Bullish Voids (Green): These represent areas where price surged so fast that buyers may still have unfilled orders sitting below. These act as Magnets for pullbacks.
Bearish Voids (Red): These represent areas where price plummeted, leaving a vacuum of selling pressure. These act as Magnets for relief rallies.
2. Trading the "Repair" Process
The Engine tracks how the market "repairs" these holes:
Partial Fill: If price enters a box but doesn't cross it, the "Magnet" is still active.
Full Repair: When a box is "sealed" (stops extending right), it indicates the imbalance is gone. If price "Seals" a green box and then bounces, it confirms the zone as Valid Institutional Support.
3. Confluence with the Trend
Continuation: In a strong uptrend, look for price to drop into a Green Bullish Void and find support. This is often the "Golden Entry" for trend followers.
Reversal Confirmation: If price ignores a Red Bearish Void and blasts right through it (sealing it instantly), it signals a massive shift in market regime and extreme bullish conviction.
USER SETTINGS
Lookback Period: How far back the engine searches for un-repaired gaps.
Min Gap Size (ATR %): Increase this to see only the "Major" institutional gaps; decrease it for a more granular intraday look.
Visual Styles: Fully customizable colors and transparency to match any chart theme (Dark/Light).
NOTES & DISCLAIMER
This script is a visualization of historical price imbalances and is intended for educational purposes only. It does not provide trade signals, entry/exit points, or financial advice. All trading involves risk.

EMAs ChimuTraderPublicoscrip de emas 200 y 50 periodos para anlizar todo BINANCE:SOLUSDT y muchas monedas mas
