ZY Target TerminatorThe indicator follows trends and generates short and long signals. Furthermore, when it generates a signal, it displays the maximum profit margins for the last three signals it generated in the same direction. It also clearly indicates the number of candles for which no signal has been generated for the pair. Avoid trading pairs whose profit margins do not align with your trading strategy.
Bands and Channels

Trend Step Channel [BigBeluga]🔵 OVERVIEW
Trend Step Channel identifies directional bias by forming a dynamic volatility-based step channel. It detects trend shifts when candle lows close above the upper band (bullish) or when candle highs drop below the lower band (bearish). A step-style midline tracks the trend evolution, while an integrated dashboard shows price positioning percentages across multiple timeframes.
🔵 CONCEPTS
ATR-Based Channel — The indicator constructs upper and lower channel boundaries using ATR distance around a single adaptive trend line, providing automatic scaling with volatility.
Trend Direction Logic —
• Low above upper band → uptrend confirmation.
• High below lower band → downtrend confirmation.
Step Trend Line — A reactive midline that locks onto price swings, stepping upward or downward as new trend confirmations occur.
Channel Width — Defines the total volatility range around the midline; a wider channel smooths market noise, while a narrower one reacts faster.
Price Position Ratio — Calculates the relative position of the close within the channel, from 0% (bottom) to 100% (top).
🔵 FEATURES
Volatility-Adaptive Channel — Expands and contracts dynamically to match market volatility, maintaining consistent distance scaling.
Configurable MA Source — Choose from SMA, EMA, SMMA, WMA, or VWMA as the base smoothing method.
Color-Coded Step Line —
• Green indicates an uptrend.
• Orange indicates a downtrend.
Channel Fill Visualization — Semi-transparent fills highlight active volatility zones for clear trend identification.
Price Position Label — Displays a “<” marker and percentage at the channel edge showing how far the current close is from the lower or upper band.
Multi-Timeframe Dashboard —
• Displays alignment across 1H–5H charts.
• Each cell shows an arrow (↑ / ↓) with price % positioning.
• Cell background color reflects bullish or bearish bias.
Real-Time Updating — The channel, midline, and dashboard refresh dynamically every bar for continuous feedback.
🔵 HOW TO USE
Trend Confirmation —
• Bullish trend forms when candle low closes above the upper band.
• Bearish trend forms when candle high closes below the lower band.
Trend Continuation — Maintain bias while the step line color remains consistent.
Volatility Breakouts — Sudden candle breaks outside the band suggest new directional strength.
Dashboard Alignment — Confirm trend consistency across multiple timeframes before entering trades.
Entry Planning — In uptrends, consider entries near the lower band; in downtrends, focus on upper-band rejections.
Price Position Insight — Use the % label to judge whether price is extended (near 100%) or compressed (near 0%) within the channel.
🔵 CONCLUSION
Trend Step Channel delivers a precise, volatility-driven view of trend structure using ATR-based boundaries and a step-line framework. The integrated dashboard, color-coded channel, and live positioning metrics give traders a complete picture of market direction, trend strength, and price location within evolving conditions.

Buy & Sell Arrows - MACD + Best_Solve WPRMACD + Best_Solve Williams %R – Aggressive Trend-Reversal Catcher
(Allow Signals Even in Overbought/Oversold Zones)
This indicator combines the classic MACD histogram with Best_Solve’s popular custom Williams %R (a 0–100 momentum oscillator that behaves more like a fast Stochastic) to deliver clean, high-conviction entry signals on daily (and higher) timeframes.
Core Logic – Only TWO conditions are required
BUY (large green arrow below bar)
MACD histogram is green (bullish momentum)
Williams %R fast line is crossing above OR already above its EMA
SELL (large red arrow above bar)
MACD histogram is red (bearish momentum)
Williams %R fast line is crossing below OR already below its EMA
Unlike most oscillators, this version deliberately removes the traditional “do not buy when overbought / do not sell when oversold” filters. This allows the script to catch powerful trend reversals and explosive moves immediately — even on violent earnings gaps or panic sell-offs (example: META’s -11 % drop on Oct 30 2025 triggered an instant sell even though %R was deeply oversold).
Built-in Clean-Signal Logic
No consecutive buys or sells — each new signal must be preceded by the opposite direction.
This keeps the chart extremely clean and prevents whipsaw clusters during strong trends.
Best Use Cases
Daily and 4H swing trading on stocks, indices, crypto, forex
Excellent for catching sharp reversals after earnings, news events, or overextended moves
Works especially well on high-beta names and growth stocks
Visuals
Large green/red arrows with “BUY” / “SELL” text (your favorite style)
Subtle transparent MACD histogram overlaid on price for instant momentum context
Ready-to-use alerts (“Buy Alert” / “Sell Alert”)
Set it, alert it, trade it — one of the cleanest and most responsive daily reversal systems you’ll find.
Enjoy the edge!


Minho Index | SETUP+@TraderMinho//@version=5
// By: Trader Minho — Analista Gráfico desde 2022
indicator("Minho Index | SETUP+@TraderMinho", shorttitle="Minho Index (Classic)", overlay=false)
//--------------------------------------------------------
// PARAMETERS
//--------------------------------------------------------
shortPeriod = input.int(3, "Short Period")
mediumPeriod = input.int(8, "Medium Period")
longPeriod = input.int(20, "Long Period")
intensityFactor = input.float(3.0, "Intensity Factor", step = 0.1)
shortSmoothing = input.int(2, "Short Smoothing (EMA)")
mediumSmoothing = input.int(5, "Medium Smoothing (EMA)")
shortColor = input.color(color.new(#00CED1, 0), "Short Line Color (Aqua Blue)")
mediumColor = input.color(color.new(#FFD700, 0), "Medium Line Color (Yellow)")
zeroColor = input.color(color.new(color.white, 0), "Zero Line Color")
lineWidth = input.int(1, "Line Thickness")
//--------------------------------------------------------
// MOVING AVERAGE CALCULATIONS
//--------------------------------------------------------
smaShort = ta.sma(close, shortPeriod)
smaMedium = ta.sma(close, mediumPeriod)
smaLong = ta.sma(close, longPeriod)
//--------------------------------------------------------
// CLASSIC DIDI NORMALIZATION
//--------------------------------------------------------
priceBase = ta.sma(close, longPeriod)
didiShort = ((smaShort - smaLong) / priceBase) * intensityFactor
didiMedium = ((smaMedium - smaLong) / priceBase) * intensityFactor
//--------------------------------------------------------
// FINAL SMOOTHING (CLASSIC NEEDLE EFFECT)
//--------------------------------------------------------
aquaSmooth = ta.ema(didiShort, shortSmoothing)
yellowSmooth = ta.ema(didiMedium, mediumSmoothing)
//--------------------------------------------------------
// PLOTS
//--------------------------------------------------------
hline(0, "Zero Line", color = zeroColor, linewidth = 1)
plot(aquaSmooth, "Short (Aqua)", color = shortColor, linewidth = lineWidth)
plot(yellowSmooth, "Medium (Yellow)", color = mediumColor, linewidth = lineWidth)

Opening Range with Breakouts & Targets w/ Alerts [LuxAlgo]This is the exact Lux Algo opening range with Breakouts and Targets, but added the ability to fire alerts on buy and sell signals


Мой скриптinputs:
window(1),
type(0), // 0: close, 1: high low, 2: fractals up down, 3: new fractals
persistent(False),
exittype(1),
nbars(160),
adxthres(40),
nstop(3000);
vars:
currentSwingLow(0),
currentSwingHigh(0),
trailStructureValid(false),
downFractal(0),
upFractal(0),
breakStructureHigh(0),
breakStructureLow(0),
BoS_H(0),
BoS_L(0),
Regime(0),
Last_BoS_L(0),
Last_BoS_H(0),
PeakfilterX(false);
BoS(window,persistent,type,Bos_H,BoS_L,upFractal,downFractal,breakStructureHigh,breakStructureLow);
//BOS Regime
If BoS_H <> 0 then begin
Regime = 1; // Bullish
Last_BoS_H = BoS_H ;
end;
If BoS_L <> 0 Then begin
Regime = -1; // Bearish
Last_BoS_L = BoS_L ;
end;
//Entry Logic: if we are in BoS regime then wait for break swing to entry
if ADX(5) of data2 < adxthres then begin
if time>900 and Regime = 1 and EntriesToday(date)= 0 and Last_BoS_H upFractal then buy next bar at market;
end;
if time>900 and EntriesToday(date)= 0 and Regime = -1 and Last_BoS_L>downFractal then
begin
if close < downFractal then sellshort next bar at market;
end;
end;
// Exits: nbars or stoploss or at the end of the day
if marketposition <> 0 and barssinceentry >nbars then begin
sell next bar at market;
buytocover next bar at market;
end;
setstoploss(nstop);
setexitonclose;

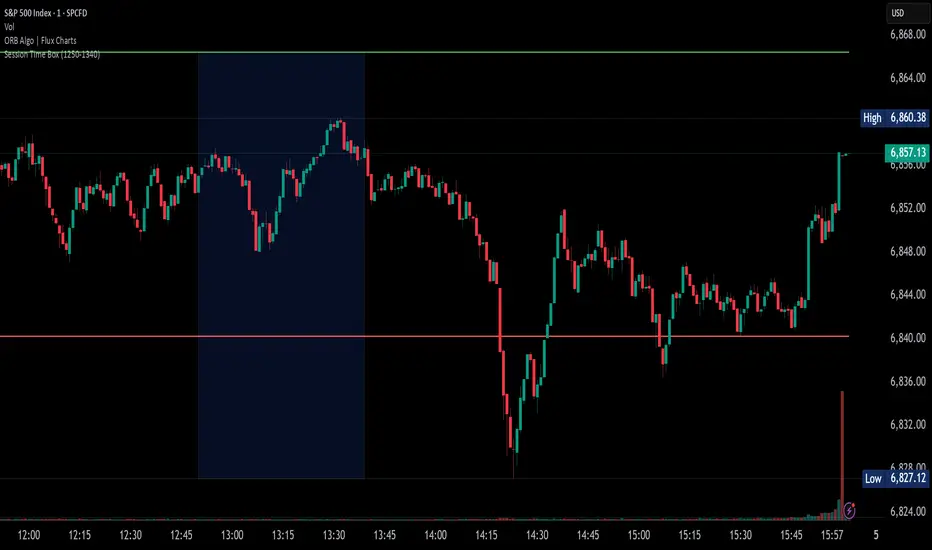
Custom ORB (Adjust Time, Color, + Alerts)Set Opening Range Break Out for whatever time range you choose for current day only. 15 min, 30 min etc. You can add alerts on ORB High Low and change color of Lines.


SPX EMAs - Bala//@version=5
indicator("SPX EMAs", overlay = true)
// Inputs
ema8 = ta.ema(close, 8)
ema21 = ta.ema(close, 21)
ema50 = ta.ema(close, 50)
ema200 = ta.ema(close, 200)
// Plot EMAs
plot(ema8, "EMA 8", color=color.new(color.green, 0), linewidth=2)
plot(ema21, "EMA 21", color=color.new(color.orange, 0), linewidth=2)
plot(ema50, "EMA 50", color=color.new(color.blue, 0), linewidth=2)
plot(ema200,"EMA 200",color=color.new(color.red, 0), linewidth=2)

Interactive Compound Interest ProjectorThis indicator is an interactive tool designed for long-term investors and analysts who want to compare an asset's performance against a theoretical compound interest growth curve.
Unlike static tools, this script utilizes the Interactive Anchor feature. This allows you to click on any specific point on the chart (e.g., a market bottom, a specific entry date, or a previous all-time high) to serve as the starting point ("Principal") for the projection.
How to use
Add the indicator to your chart.
Important: Because confirm=true is enabled, the script will wait for you to click on the chart. Click on the specific candle you want to use as the "Start Date".
The Yellow Line will appear starting from that candle.
Open the indicator settings to adjust:
Annual Interest Rate: (Default 6.0%).
Project until Year: (Default 2050).
Use this to visualize if an asset is "beating" a standard benchmark (like a 10% S&P500 average or a 4% risk-free rate) from a specific moment in time.
Disclaimer: This tool is for educational and comparative analysis purposes only and does not guarantee future results.

SMC Fib Range Signals [@gyanapravah]SMC Fib Range Signals
This indicator blends Smart Money Concepts (SMC) with a Range Filter Trend System and Fibonacci Retracement & Extensions to generate high-probability automated Buy/Sell signals.
Designed to avoid noise and focus on market structure + trend + price confluence, this tool is ideal for:
1. Intraday traders
2. Swing traders
3. Index & stock traders
4. Crypto & Forex traders
CORE FEATURES
Range Filter Trend Detection
Smooth adaptive filter identifies true trend direction
Visual confirmation:
🟢 Green filter = bullish pressure
🔴 Red filter = bearish pressure
🟡 Yellow filter = neutral
Upper & Lower Bands act as dynamic support/resistance zones
Smart Money Order Blocks (SMC)
Automatically detects important pivot highs & lows
Marks:
OB High → supply / resistance zone
OB Low → demand / support zone
Continuously tracks latest OB levels for live price interaction
Fibonacci Engine
Detects the current swing zone and plots:
Retracement levels
0.236 – 0.382 – 0.500 – 0.618 – 0.786 (editable)
Extension targets
1.272 – 1.618
All levels update dynamically on new market structure and pivots.
SIGNAL ENGINE
This indicator generates signals from three independent confirmation systems:
BUY SIGNALS trigger when:
1. Trend flips bullish (price crosses above the Filter)
2.Bullish trend + price reacts near:
Order Block support
Fibonacci 0.382 / 0.618 levels
Bounce from the Lower Band with trend support
All setups require volume confirmation to filter fake breakouts.
SELL SIGNALS trigger when:
1. Trend flips bearish (price crosses below the Filter)
2. Bearish trend + price reacts near:
Order Block resistance
Fibonacci 0.382 / 0.618 levels
Rejection from the Upper Band with trend support
ALERTS READY
Two built-in alerts:
BUY Alert — fires on bullish signal
SELL Alert — fires on bearish signal
INPUT SETTINGS
Trend Engine
1.Source
2.Sampling Period
3.Range Multiplier
Smart Money
Pivot detection sensitivity (Left / Right bars)
Fibonacci
1.Swing lookback length
2.Editable Fib retracement and extension values
3.Toggle show/hide Fib levels
BEST USE CASE
Works extremely well on:
⏱️ 3M – 15M Intraday scalping
⏱️ 30M – 1H positional entries
⏱️ 4H – D1 swing trading
Tested on:
NIFTY / BANKNIFTY / FINNIFTY
Stocks
Crypto
Forex
DISCLAIMER
This indicator is for educational purposes only.
It does NOT guarantee profits.
Always use:
Proper risk management
Stop-loss rules
Your own confirmation before entering trades.
AUTHOR
Built & shared by @gyanapravah (Odisha, India)
Open-source for learning and community improvement.

Auto Trend Channels OXEThis indicator automatically detects and draws trend channels based on swing highs and lows.
How it works:
It identifies pivot points (swing highs/lows) using your chosen lookback period, then connects consecutive pivots to form channels:
Descending channels connect lower highs (resistance line), with a parallel support line projected from the lowest low between those highs
Ascending channels connect higher lows (support line), with a parallel resistance line projected from the highest high between those lows
Key features:
Channels extend forward so you can see where price might interact with them
Broken channels automatically switch to dashed lines and show "✗" labels
Fill shading helps visualize the channel zone
Info table shows current pivot counts
Trading application:
You'd use this for identifying trend direction and potential reversal zones. Price bouncing off channel boundaries = continuation. Price breaking through = potential trend change or acceleration. The "break detection" highlighting makes it easy to spot when a channel has been invalidated.
The pivot length setting is your main control - higher values find longer-term, more significant channels; lower values catch shorter-term moves.

10% and 23.6% support bandsWhen a share is in momentum and showing lot of strength that relative strength it takes breather at 10% band from new 52 week high and and tends to consolidate at 23.6% from new 52 week high. This forms a higher low and gives opportunity to get in the rally. The volume bars should be taken into consideration as low volume and dry up at the bottom indicate reversal is coming. The stoploss for all entry is 1% below recent base low and entry pont is crossing of weekly high with greater than 20 days volume average.


⚔️ The Scalpel⚔️ THE SCALPEL v2.0
━━━━━━━━━━━━━━━━━━━━━━━━━━━━━━━━━━━━━━━━━━━━━━━━━━━━━━━━
Surgical-Grade Market Structure Detection System
🔬 WHAT IS THE SCALPEL?
The Scalpel is a precision-engineered market structure analyzer that identifies and tracks critical support and resistance zones with surgical accuracy. Unlike conventional S&R tools that flood your chart with noise, The Scalpel cuts through the clutter to reveal only the most significant price structures.
━━━━━━━━━━━━━━━━━━━━━━━━━━━━━━━━━━━━━━━━━━━━━━━━━━━━━━━━
⚙️ CORE TECHNOLOGY
▸ Pivot-Based Detection Engine
Advanced pivot analysis calibrated by user-defined precision settings
▸ Tissue Integrity Validation
Filters structures based on candle body-to-range ratios
▸ Dynamic Stress Analysis
Tracks zone interactions and removes exhausted levels automatically
▸ Volatility-Adaptive Zones
Zone width scales with ATR for consistent performance across all markets
━━━━━━━━━━━━━━━━━━━━━━━━━━━━━━━━━━━━━━━━━━━━━━━━━━━━━━━━
🎨 VISUAL SPECTRUM
💜 STERILE ZONES (Electric Violet)
Fresh, untested structures with maximum potential
🔴 COMPRESSION ZONES (Magenta Fire)
Tested resistance ceilings under selling pressure
🩵 FOUNDATION ZONES (Neon Teal)
Tested support floors with proven buyer interest
✨ PLASMA AURA EFFECT
Multi-layered glow effect for enhanced visibility
━━━━━━━━━━━━━━━━━━━━━━━━━━━━━━━━━━━━━━━━━━━━━━━━━━━━━━━━
📐 PARAMETERS
🔪 Blade Precision (1-10)
Higher = fewer but sharper pivots detected
🩺 Tissue Integrity % (30-90)
Minimum candle body percentage required
📏 Incision Depth (0.1-2.0 ATR)
Controls zone thickness based on volatility
💉 Stress Threshold (1-10)
Maximum touches before zone invalidation
📐 Projection Range (10-200)
How far zones extend into the future
━━━━━━━━━━━━━━━━━━━━━━━━━━━━━━━━━━━━━━━━━━━━━━━━━━━━━━━━
💡 HOW TO USE
1. Fresh sterile zones (violet) are your highest-probability setups
2. Watch for price reaction at zone boundaries
3. Tested zones confirm structure but may have diminished strength
4. Zones auto-remove after stress threshold is reached
5. Use projection range to anticipate future tests
━━━━━━━━━━━━━━━━━━━━━━━━━━━━━━━━━━━━━━━━━━━━━━━━━━━━━━━━
🎯 BEST FOR
✓ Scalping & Day Trading
✓ Swing Trade Entries
✓ Stop Loss Placement
✓ Take Profit Targeting
✓ Multi-Timeframe Analysis
━━━━━━━━━━━━━━━━━━━━━━━━━━━━━━━━━━━━━━━━━━━━━━━━━━━━━━━━
⚠️ DISCLAIMER
This indicator is for educational purposes only. Always conduct your own analysis and use proper risk management. Past performance does not guarantee future results.
━━━━━━━━━━━━━━━━━━━━━━━━━━━━━━━━━━━━━━━━━━━━━━━━━━━━━━━━
🏷️ TAGS
support resistance zones SNR pivot points market structure scalping day trading swing trading price action order blocks smart money supply demand technical analysis

Simulated Liquidation Heatmap [QuantAlgo]🟢 Overview
This indicator visualizes where clusters of stop-loss orders and liquidation levels are likely located, displayed as a 'heatmap'. It's based on the concept of market structure liquidity: large groups of stop orders tend to gather around obvious technical levels (like swing highs and lows), and these pools of orders often attract price movement from institutional traders. The indicator uses a fractal-based algorithm to identify these high-probability liquidation zones and displays them as dynamic, color-coded boxes.
The key feature is the thermal color gradient, which indicates the freshness (age) and therefore the relative relevance of the liquidity zone. Hot colors (e.g., Red/Yellow) represent fresh clusters that have just formed, suggesting strong and immediate liquidity interest. Cold colors (e.g., Blue/Purple) represent aged or decaying clusters that are becoming less relevant over time. This visualization allows traders to anticipate potential liquidity sweeps (stop hunts) and understand areas of significant retail and institutional positioning.
🟢 Key Features
1. Liquidity Zone Heatmap
The core function is the identification of swing high and swing low price points using a user-defined Lookback period. These points are where retail traders are statistically most likely to place their stop-loss orders. The indicator simulates the clustering of these orders by drawing a zone (box) around the detected swing point, with the vertical size controlled by the Stop/Liquidation Zone Width (%) setting.
▶ Cluster Lookback: Defines the sensitivity of swing point detection. Lower values detect frequent, minor zones (scalping/intraday); higher values detect major, stronger swing points (swing trading).
▶ Zone Width (%): Sets the percentage range above and below the swing point where stops are simulated to cluster, accounting for slippage and typical stop placement spread.
▶ Liquidity Decay: Zones gradually fade in color intensity and are eventually removed after the user-defined Liquidity Decay Period (Bars), ensuring the heatmap only displays relevant, current liquidity areas.
▶ Round Number Filter: An optional filter that limits the display to liquidity zones occurring only at psychologically significant round numbers (e.g., $100, $1,500.00), which typically attract higher concentrations of orders.
2. Thermal Color Gradient
The heatmap's color is a direct function of the zone's age, providing a visual proxy for immediate relevance.
▶ Freshness: Newly created zones are displayed in the Hot Color (high relevance).
▶ Decay: As bars pass, the zone color transitions along the gradient toward the Cold Color and increased transparency (lower relevance), until it is removed entirely.
▶ Color Schemes: Multiple pre-configured and custom color schemes are available to optimize the visualization for different chart themes and color preferences.
3. Liquidity Heat Thermometer
An optional visual thermometer is displayed on the chart to provide an instant, overall assessment of the current liquidation heat level in the immediate vicinity of the price.
▶ Calculation: The thermometer calculates an aggregate heat score based on the age and proximity of all liquidity zones within a user-defined Zone Detection Range (%) of the current price.
▶ Visual Feedback: A marker (triangle) points to the corresponding level on the thermometer's color gradient (Hot to Cold). A high reading indicates price is close to fresh, dense stop clusters, suggesting high volatility or an imminent liquidity sweep is probable. A low reading indicates price is in a low-density or aged liquidity area.
▶ Customization: The thermometer's resolution, position, and text size are fully customizable for optimal chart placement and readability.
🟢 Practical Applications
▶ Anticipate Sweeps: Prioritize trading in the direction of Hot (fresh) liquidity zones. For example, a hot low-side zone suggests strong sell-side liquidity (stop-losses) is available for large buyers to sweep.
▶ Filter Noise: Use the Round Number Filter to focus only on the highest probability liquidation zones, which are often at clean, psychological price levels.
▶ Validate Entries: Combine the Heat Thermometer with price action analysis. A rising heat level indicates increasing proximity to a major stop cluster, signaling a potential turn or an aggressive market move to sweep those stops.
▶ Risk Management: Understand that price often acts dynamically around these zones. High heat levels imply high risk/reward setups; stops should be placed strategically beyond the defined Liquidation Zone Width.
▶ Multi-Timeframe Context: Higher timeframes (e.g., Daily, 4-Hour) often reveal more significant, major liquidity zones. Use this indicator on lower timeframes (e.g., 5-min, 15-min) for execution, but prioritize zones that align with higher-timeframe structures.

SDFADE nuvolébasic script to signal mean reversions and alert fades when stretched to +/-2.5VWAP Standard Deviation

QUANTLABS Fisher Stream: 5-TF Consensus RibbonMarkets are noisy. A single timeframe often lies. The Fisher Stream cuts through the noise by inspecting 5 sequential timeframes (Default: 5m, 6m, 7m, 8m, 9m) simultaneously to find the "Perfect Flow."
Unlike standard indicators that repaint or lag, this tool looks for Consensus. When the fast, medium, and slow timeframes within the stream all agree, the ribbon glows, and the background flashes, indicating a high-probability "Full Flow" state.
The Ribbon: Plots 5 distinct Fisher Transforms.
Blue Lines: Faster timeframes (leading indicators).
Orange Lines: Slower timeframes (trend confirmation).
Consensus Check:
FULL FLOW (Bull): When all 5 lines are > 0. The background flashes Green.
FULL FLOW (Bear): When all 5 lines are < 0. The background flashes Red.
MIXED (Chop): When the lines disagree. The background remains dark, warning you to stay out.
Dashboard: A heads-up display showing the exact Fisher value for every timeframe in the cluster.
Scalpers: Use the default settings (5m-9m). Enter only when the dashboard says "FULL FLOW" and the candles turn solid Green/Red.
Trend Traders: Change the inputs to higher timeframes (e.g., 15m, 30m, 45m, 1H, 4H) to catch major swing moves.

USD Liquidity / FX Swap + Money Market StressThis indicator shows, in a simple way, how tight or loose USD liquidity is. It combines two things: signs of stress in the FX market (Fed swap lines + dollar strength) and signs from the money market (the difference between repo rates like SOFR/TGCR and the Fed’s IORB rate). All of this is merged into a single blue line: when it rises, liquidity tends to be more abundant; when it falls, there is more stress and the dollar becomes “expensive” to obtain.
You read it like a traffic light:
If the background is red, the indicator is below the lower threshold → liquidity stress, an environment that is more prone to sell-offs and violent moves in risk assets (including crypto).
If the background is green, the indicator is above the upper threshold → more relaxed liquidity, a backdrop that is more favorable for risk rallies to be sustained.
No background color → neutral zone, neither very good nor very bad: you trade according to your usual system.
It is designed as a macro context filter, not as a buy/sell signal. In red, it makes sense to be more defensive with risk and leverage; in green, if your technical system gives a long signal, you have a somewhat more favorable tailwind. It should always be used together with other tools and strict risk management.

Lines Blue OrangeTry this without candles. Can be used with other indicators to help determine the direction.
