Algonize Pivot Strategy (APS)This study is based on several Price Action parameters of :-
• Pivot Points,
• Higher High and Lower Lows,
• High Low Index ,
• Support and Resistance.
► How To Use This Strategy?
This is a pure scalping strategy and it is advised to use this only with algo trading systems. Due to high trade frequency.
► This Strategy has inbuilt custom time frame backtester, which enables you to test for performance between any date or check for a single day.
► To Create Alerts for algo trading in this strategy simply Check "Activate Algo" from Settings then Create new alert , select your strategy in condition box, and now scroll down to message box and write
{{strategy.order.comment}}
That's it , Just Click on Create Alert Button
Backtest Values Used:-
Initial Capital : 1000000
Order Size (Lots) : 1 (Contract) Lots
Pyramiding : 0 orders
Commission : 0.003%
Sharpe Ratio : 1.741
Profit Factor : 1.174
Test Yourself and give feedback.
PM us to obtain access.
BANKNIFTY

Aditya Banknifty-2 IndicatorThis indicator is designed for Banknifty which is traded on NSE(India). It works best in 1-M and 5-M time-frame. You can always experiment with any other time-frame with various combinations of settings.
Green Line- Buy Trigger Line
Red Line- Sell Trigger Line
Period: No. bars for look-back period.
Trade Trigger Type:
1. ATR Based – Trade will be initiated based on ATR values.
For 1M time-frame: Trigger ATR Bars=7
ATR Multiplier = 3.1
For 5M time-frame: Trigger ATR Bars=7
ATR Multiplier = 0.5
2. Fixed - – Trade will be initiated based on particular fixed value.
3. % of Close - Trade will be initiated based on % of Close of script.
Take Partial Profit: Whether to book partial or not.
Partial Profit Points: It always better to book partial profit after getting into the trade. We can book 1 quantity after our partial profit target is hit by making Order Size=2 and let the remaining quantity in the trade until the reversal of trend.
Disclaimer: This script/strategy is for educational purpose and individual use only. The author of this script/strategy will not accept any liability for loss or damage as a result of reliance on the information contained in the charts. Please be fully informed regarding the risks and costs associated with trading the financial markets.
This is a premium indicator so send me a private message for access.
Use the link below to obtain access to this indicator.

Channel Cross StrategyTrend Following using Channel based Script. Long and Short Entry based on Custom filter to avoid False Signal.
Works best for BankNifty and Nifty and few Indian Stocks.
Untick Exponential gives better Result.

Crazy Signals - Early Detection of a Short Term TrendThis is a simple yet powerful tool that helps you detect Trends for the short term.
Time Frames:
- Avoid using very small time frames as there will be too many signals in a short period
- Intraday: 15 mins, 30 mins, 60 mins seem to detect trends well
- Overnight Trades: 60 mins
- Positional: 1D is recommended
- For Investment, one can week a weekly timeframe
Rules of Engagement:
1. The Upward Arrow (Green) indicates possible upside. While the Downward Arrow (Orange) indicates a possible downside
2. Not every Signal has to be traded. Rules to check before taking a trade:
a. The candle on which the Signal is generated, should be either small or medium size compared to other candles on the chart. If the candle is large, ignore it
b. In case of a Buy Signal, entry should be made once the Price crosses above the High made on the Signal Candle
c. In case of a Sell Signal, entry should be made once the Price crosses below the Low made on the Signal Candle
d. For extra caution, in steps b & c, one can wait for the current candle to close higher than the High of Signal Candle for Buy Signal and close lower than the Low of Signal Candle (this is for extra safe traders)
This tool is to be used for trades that usually last for a few candles.
Please do your own research before trading.

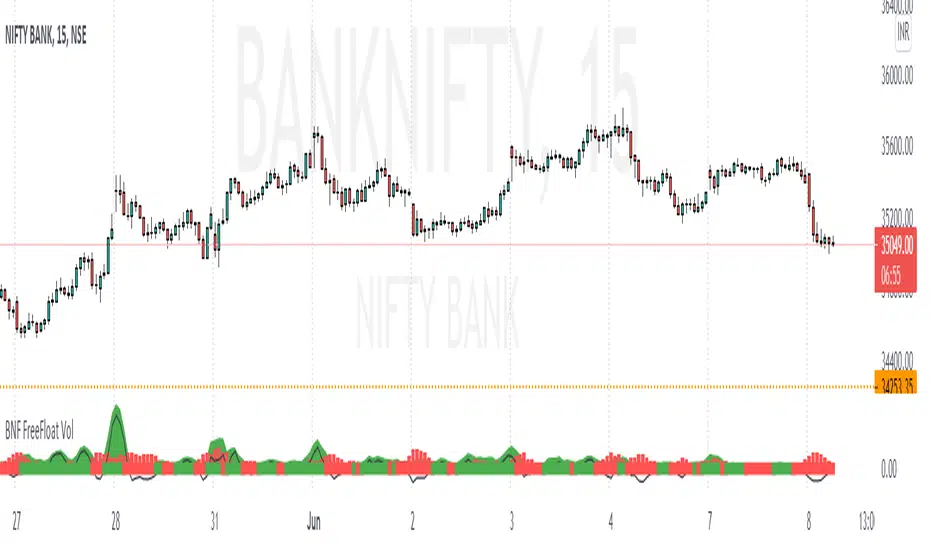
BANKNIFTY Free Float VolumeThis indicator is build keeping in mind how the Indian Market is formed - free-float market capitalization concept
1) Considered all banknifty index stocks according to NSE
2) Multiplied each stock Volume by its Weightage given in NSE Site every month End - means giving importance to volume by its weightage
3) Green Candle - Considered as +Ve Volume , Red Candle - Considered as -Ve Volume
4) Diff of +Ve Volume & -Ve Volume give clear picture market will go up or down
Note:- This Indicator work only for 15 Min time frame
Gives better results good Risk Reward used near Supp/Resistance
Combine with BANKNIFTY / NIFTY Advance-Decline Ratio give confidence on the move
Eg:-
Bullish Scenario
Near Support, Volume Turned -Ve to +Ve, Adv /Dec of Nifty >30/35 or BNF Adv /Dec > 7
or combine any candle patterns( Pin Bar ) at Sup/Res or combine with Chart Pattern(Triangle/ Rectangle )
Can take 75 Pts as SL and target 150-200 Pts
Bearish Scenario - Vice Versa to above
backtested results showed high Accuracy when used in combination of Sup/Res
Trade in Real Life - Scalper StudyTrend Following using Channel based Script. Long and Short Entry based on Custom filter to avoid False Signal.
Works best for BankNifty and Nifty and few Indian Stocks.

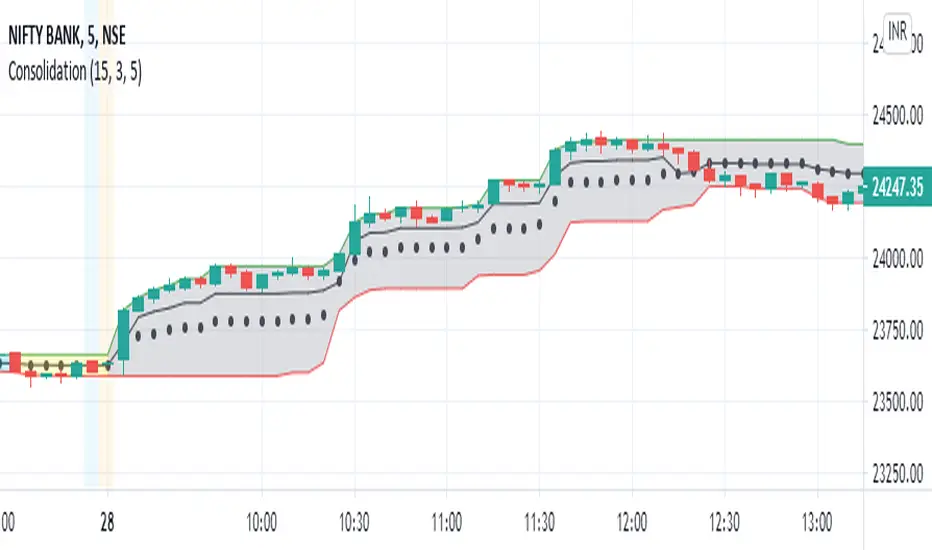
Consolidation and Breakout detectorExperimental : This script identifies the consolidation of a stock for selected time period. The consolidation period and range can be configured. 2 levels of consolidation levels can be selected. i.e Strong and medium. The range for strong and medium level of consolidation can also be configured by the user.
A movement in the direction of breakout of the consolidation level is observed most of the times. I have also added reversal line/stoploss line, so that the breakout movement is cancelled once that line is crossed by the candle close.
Currently consolidation levels are configured for 5 minute chart NSE:BANKNIFTY OANDA:NAS100USD . Can be reconfigured easily for any timeframe.
Zeta ForceBank Nifty is an Index which comprises of 12 Banking Stocks.
Zeta Force indicator tracks underlying stocks’ Price & Volume simultaneously to detect sudden momentum in this index.
Based upon its calculations, Zeta Force indicator calculates V+, V-, Zeta Force & Zeta TP variables and generates Buy/Sell signals when major changes are detected in these variables.
Since price is a major factor in Zeta Force calculations and price keeps fluctuating during candle formation, traders need to wait a little to see if the Buy/Sell signal sustains or not.
Once the candle gets closed, the Signal will not repaint itself.
The best time frame to use with this indicator is 15 minute and 10 minute.
Do not use with lower time-frames as settings have been coded for 10 or 15 minute time frame only.
This is only Bank Nifty specific indicator and can not be used for Nifty or other stocks.
Trend Following Algo by Technicaltrader615 for BankniftyThis is an Intraday Trend Following System developed for Trading the Bank nifty Index. It couples traditional trend following with Momentum and Price action. The trades are Entered and Exited the Same day. If Old buy signal is continuing, system wont take trade, System will wait for new signals. For continuation or re entry there is a separate program which is under development.
This can be applied to Futures segment and Options Also. Options you have to understand parameters like Expiry, Strike Price, IV etc; Future trading is recommended compared to option as the system is tested with futures.
For more Details you can contact thru trading view chat window. You can also scroll down for my signature. There will not be any trail period.

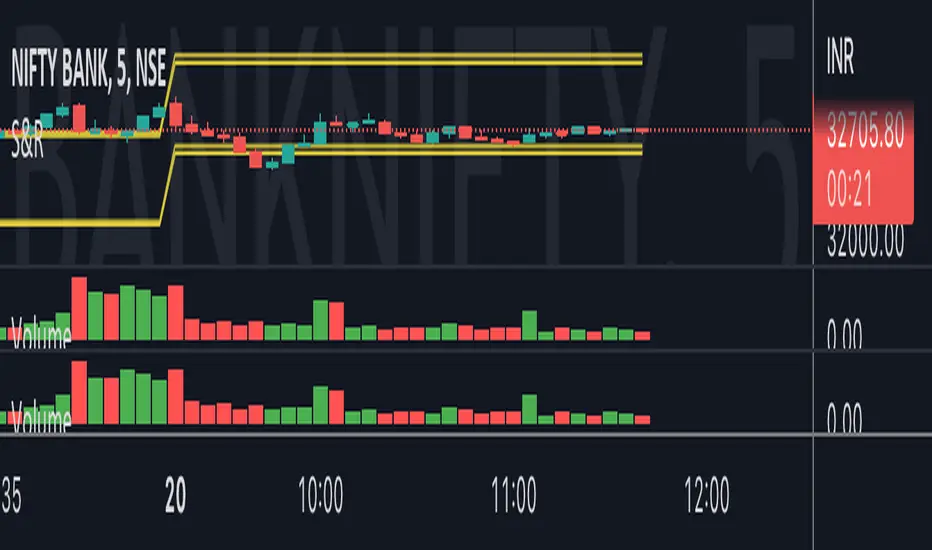
BankNifty ticksThis is an attempt to create a leading indicator for BankNifty movement.
Here I combine Banknifty stocks and indices to create a Tick chart.
A Tick Chart - By definition, a Tick Chart tracks movement of the underlying stocks. A positive move is counted as +1 and negative move is counted as -1. Total for the underlying stocks is shown as tick chart.
BUT - Some stocks like HDFC Bank have much larger influence on the BankNifty index. So I have give weights to the stocks to calculate the index. Movement in other indices like Nifty also has influence of Banknifty next move. Hence I have combined a few indices in the calculation.
How to use this chart:
Reversals: One can look for strong tick movement in reverse direction of current trend - preceded by weak ticks.
Continuation Confirmation: Average tick movement in the positive or negative territory can confirm the positive or negative momentum respectively.
Further Notes:
I have also observed that before some reversals, tick value jumps to extreme. e.g. chart is showing minor uptrend. So we are getting Ticks in positive territory .. and there is a sudden extreme uptick..and then Banknifty turns down.
Nothing is perfect. So, even this indicator doesn't give you exact signals. Please take every indication / signal to strengthen your price action analysis.

Bank Nifty VolumeWhy this Script : Nifty 50 does not provide volume and some time it is really useful to understand the volume .
This is the pine script which calculate the nifty 50 volume .
Logic :
Take each stock contribute to nifty 50 and find it's volume .
Multiply the same with contribution percentage of the same on Nifty 50
Add up all of them and find the total volume .
I took the open source code from @daytraderph script called, Custom Volume
I will make sure I will update the contribution percentage of all stocks my self instead o you update using input methods. This is the difference. Some people don't know where to look at this to update the value, so for them this script might be useful. And this is the only difference comparing to Custom Volume script.
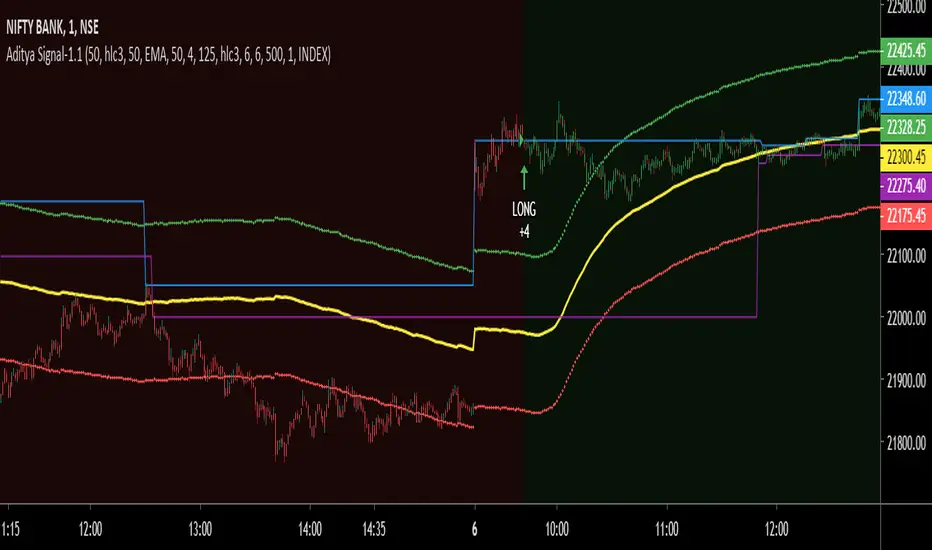
Aditya Signal 1.1 BankNifty Intra-Day Trading IndicatorThis is non-repainting indicator which can be used for Index, Stocks, Commodities and Bitcoin or any other securities depending upon the various parameter setting of the indicator. This particular strategy is for intra-day Bank Nifty Index which is traded on NSE(India). The same strategy can used for Nifty, Stocks and other indices also by adjusting the inputs.
The detailed description about the indicator is as follows:
Long Period: Period for calculating Primary Signal Line (Yellow).
Long Period Input Source: Input for calculating Primary Signal Line.
Short Period: Period for smoothing the Primary Signal Line.
Short Period MA: Method for smoothing the Primary Signal Line.
No. of ATR Bars: No. of ATR bars for calculating Primary Signal Line.
ATR Multiplier: ATR multiplier for ATR calculation.
Trade Trigger: Value above or below of Primary Signal Line for Long or Short signal. The dotted lines in Green and Red color represents the same.
Bar Crossover Input Source: Current bar input for additional signal confirmation above or below Primary Signal Line.
Bars Above Signal High: No. of bars closing above Secondary Signal Line (Blue)
Bars Below Signal Low: No. of bars closing above Secondary Signal Line (Purple)
No. of bars crossover method uses certain no. of bars for closing above High or Low of the crossover of closing price and the Primary Signal Line in combination with Trade Trigger. The idea behind this design is to avoid fake signal due sudden spike in price. Also, this ensures that price consolidates above High in case of Long signal confirmation and vice-versa. By increasing no. of such bars, we can anticipate, how much time it takes for short-term and long-term trend reversal.
Depending upon the time-frame, just by observing the High and Low of previous crossover of closing price and Primary Signal Line, we will have better understanding of undercurrent of market.
By using different combination of Trade Tigger value and no. of bars above and below, we can anticipate better trend confirmation.
The various combinations of price source of Long Period Input Source and Bar Crossover Input Source, the Short Period MA method shows promising results. Kindly PM me for these optimum settings for other financial instruments.
It always better to book partial profit after getting into the trade which increases the odds. The default trade quantity is 2. We book 1 quantity after our partial profit target is reached and let the remaining quantity be in the trade until the reversal of trend. By enabling or disabling the same we can determine the profit or loss from historical trade from when the trade quantity is 1. Just remember to change the default quantity to 1 in Order Size from properties when you disable the Take Partial Profit option.
Take Partial Profit: Whether to book partial or not as explained above.
Partial Profit Points: It always better to book partial profit after trend getting into the trade. The default trade quantity is 2. We book 1 quantity after our partial profit target is hit and let the remaining quantity in the trade until the reversal of trend.
Instrument Type: We can select the which instrument for analysis. By adjusting the Take Partial Profit value by selecting Other Option, you can analyze instrument of your choice other than mentioned in the list for Partial Profit depending upon stock tick value and lot quantity or you can PM me. I have adjusted value for Crude Oil and Silver for MCX(India) future contract values.
This is a premium indicator so send me a private message for 15 days free trial.
"Use the link below to obtain access to this indicator."
Disclaimer: This script/strategy is for educational purpose and individual use only. The author of this script/strategy will not accept any liability for loss or damage as a result of reliance on the information contained in the charts. Please be fully informed regarding the risks and costs associated with trading the financial markets.
BankNifty Modified McClellan OscillatorThe McClellan Oscillator developed by Marian McClellan is a useful breadth indicator because it describes the acceleration that takes place in the breadth numbers.
How to read McClellan Oscillator
A positive or negative value gives a simplistic bullish or bearish statement about the short-term trend of the market
Very low readings show oversold conditions
Very high readings show overbought conditions
Divergences are also important to look for as a sign that the strength of a trend is waning
Here same oscillator is rebuilded for BANKNIFTY using the difference between Capital weighted Up Volume and Down Volume instead of Advance - Decline.

Aditya Signal-1.1 for Nifty and Bank NiftyThis is non-repainting indicator which can be used for Index, Stocks, Commodities and Bitcoin or any other securities depending upon the various parameter setting of the indicator. This particular strategy is for Nifty-50 Index which is traded on NSE(India).
The detailed description about the indicator is as follows:
Long Period: Period for calculating Primary Signal Line (Yellow).
Long Period Input Source: Input for calculating Primary Signal Line.
Short Period: Period for smoothing the Primary Signal Line.
Short Period MA: Method for smoothing the Primary Signal Line.
No. of ATR Bars: No. of ATR bars for calculating Primary Signal Line.
ATR Multiplier: ATR multiplier for ATR calculation.
Trade Trigger: Value above or below of Primary Signal Line for Long or Short signal. The dotted lines in Green and Red color represents the same.
Bar Crossover Input Source: Current bar input for additional signal confirmation above Primary Signal Line.
Bars Above Signal High: No. of bars closing above Secondary Signal Line (Blue)
Bars Below Signal Low: No. of bars closing above Secondary Signal Line (Purple)
No. of bars crossover method uses certain no. of bars for closing above High or Low of the crossover of closing price and the Primary Signal Line in combination with Trade Trigger. The idea behind this design is to avoid fake signal due sudden spike in price. Also, this ensures that price consolidates above High in case of Long signal confirmation and vice-versa. By increasing no. of such bars, we can anticipate, how much time it takes for short-term and long-term trend reversal.
Depending upon the time-frame, just by observing the High and Low of previous crossover of closing price and Primary Signal Line, we will have better understanding of undercurrent of market.
By using different combination of Trade Tigger value and no. of bars above and below, we can anticipate better trend confirmation.
The various combinations of price source of Long Period Input Source and Bar Crossover Input Source, the Short Period MA method shows promising results. Kindly PM me for these optimum settings for other financial instruments.
It always better to book partial profit after getting into the trade which increases the odds. The default trade quantity is 2. We book 1 quantity after our partial profit target is reached and let the remaining quantity be in the trade until the reversal of trend. By enabling or disabling the same we can determine the profit or loss from historical trade from when the trade quantity is 1. Just remember to change the default quantity to 1 in Order Size from properties when you disable the Take Partial Profit option.
Take Partial Profit: Whether to book partial or not as explained above.
Partial Profit Points: It always better to book partial profit after trend getting into the trade. The default trade quantity is 2. We book 1 quantity after our partial profit target is hit and let the remaining quantity in the trade until the reversal of trend.
Instrument Type: We can select the which instrument for analysis. By adjusting the Take Partial Profit value by selecting Other Option, you can analyze instrument of your choice other than mentioned in the list for Partial Profit depending upon stock tick value and lot quantity or you can PM me. I have adjusted value for Crude Oil and Silver for MCX(India) future contract values.
This is a premium indicator so send me a private message for 15 days free trial.
"Use the link below to obtain access to this indicator."
Disclaimer: This script/strategy is for educational purpose and individual use only. The author of this script/strategy will not accept any liability for loss or damage as a result of reliance on the information contained in the charts. Please be fully informed regarding the risks and costs associated with trading the financial markets.

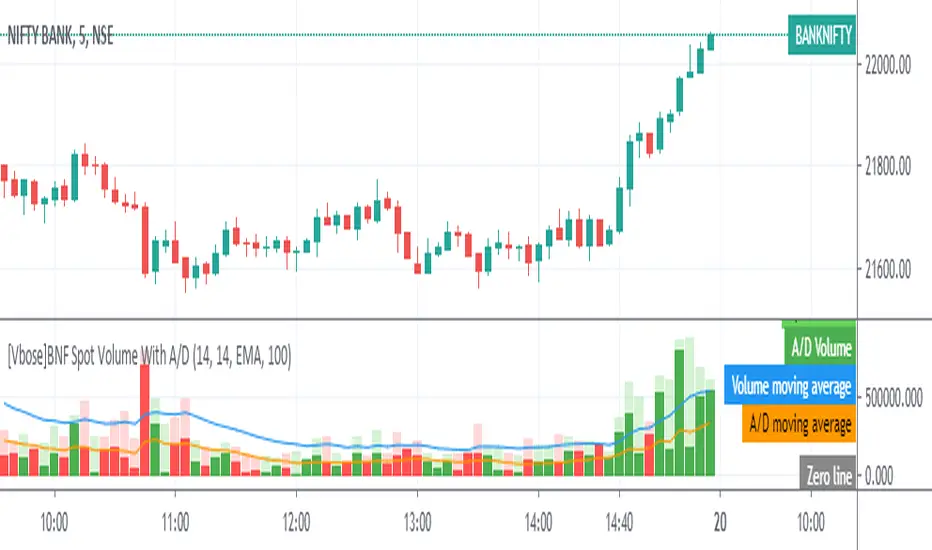
[VBose] Bank Nifty Volume With Accumulation/Distribution Bank Nifty Volume With Accumulation/Distribution Indicator shows Weighted Spot volume bars and the accumulated/distributed (A/D) portion of them. It calculates candle body to candle height ratio and multiplies it by Spot volume: Spot volume*(close-open)/(high-low)
The Spot Volume is calculated by the weighted sum (Composite method) of deriving stock volume from underlying 12 stocks in the Bank Nifty Index.
This Indicator has ability to multiply The Volume With Price and Take the Output of Volume or A/D to be fed as source in other indicators.
Light Green Color Shows Total Bull Volume > With Dark Green Color as Accumulation
Light Red Color Shows Total Bear Volume < With Dark Red Color as Distribution
Moving Average for Volume and A/D Line can be added with custom Moving Average Settings
Note:Trading view still does not provide Volume in Bank Nifty Index and this indicator calculates Spot Volume which is different than Futures Volume of Bank Nifty.
IndianPivotBoss_ADRAverage Daily Range indicator
This indicator shows the average daily range. By default shows one day Daily Range. It can be customised upto 100 days. Strongly suggested to use 1-5 days only.
It also plots 4 lines which are by default 10 day average Daily Range (ADR) with 50% of ADR, 75% of ADR, 100% of ADR and 125% of ADR.
These are used to calculate potential daily targets.
However, the most important usage is on daily chart for the next day analysis for trading intraday. If DR is less than 50% of the ADR (BOTTOM MOST LINE), the color of the bar will be in red which indicates that there is heavy contraction which could possibly followed by expansion. This could possibly lead to a trending day and hence traders can prepare well in advance.

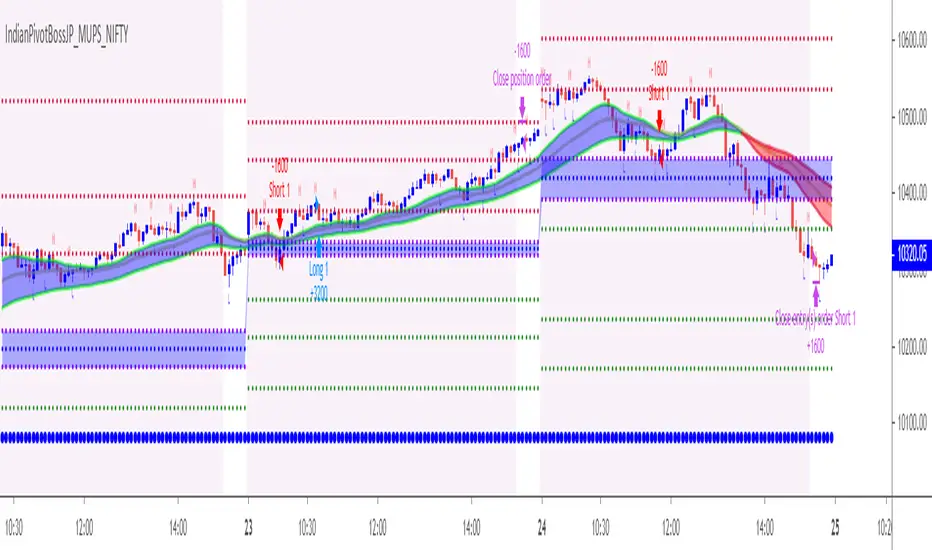
IndianPivotBossJP_MUPS_NIFTYThis is the JP_MUPS Strategy for NIFTY similar to BankNifty which is already there in JP_MUPS.
The best way to enter this strategy is as follows:
Option A :
Direct entry after signal with a stop .
Option B :
Have a Stochastic 14 / 5 / 5.
Once a short signal comes, wait for the Stochastic 14/5/5 to go to the OverBot zone above 70 and enter short after a crossunder, provided that during this period the long signal do not come.
Once a long signal comes, wait for the Stochastic 14/5/5 to go to the Oversold zone below 30 and enter long after a crossover, provided that during this period the short signal do not come.
This method will ensure that your entry is fine tuned.
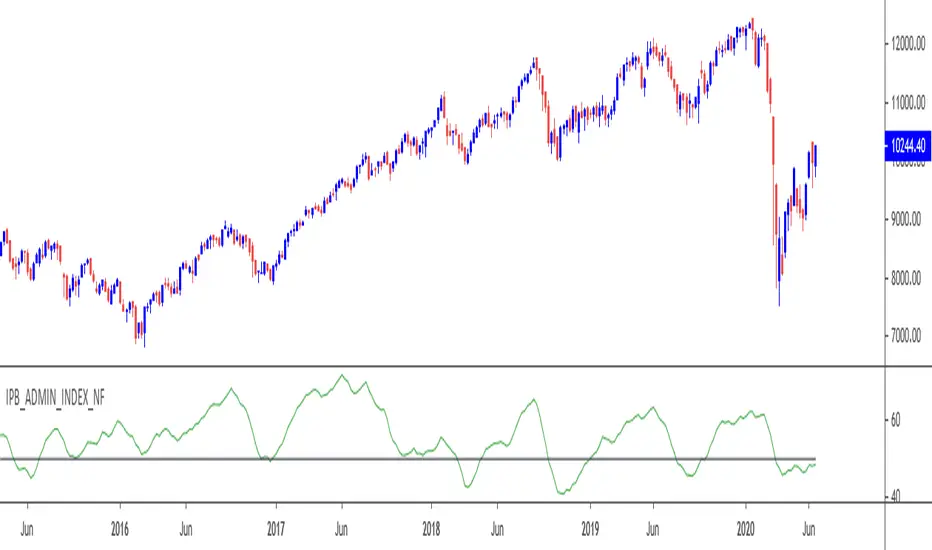
IndianPivotBoss_ADMIN_NIFTYThis is the Advance Decline Momentum Index for Top 18 stocks of Nifty 50 index.
This is similar to the ADMIN index for Bank Nifty Stocks that is already available for public use.
Top 18 stocks of Nifty contributes more than 70% of Nifty's movement.
The index has the following options :
1) Admin line (shorter momentum ) : By default this is enabled. If it crosses above 50, it indicates upward momentum with stock participation. If it crosses below 50 it indicates downward momentum. Divergence of this indicator Vs price is an excellent advance clue for a possible reversal.
2) Admin line (longer momentum) : This is to be used with respect to S.No. 1. If shorter momentum crosses longer momentum upside, it is an indication of stronger momentum and vice versa.
3) Admin MACD : Upward sloping indicates stronger momentum and downward sloping of histogram lines indicate weaker momentum. Divergence Vs price is an excellent advance clue for a possible reversal.
4) Advance decline line : This is the actual cumulative advance decline line.
5) Advance decline line 200 ema : This is the 200 ema of the advance decline line.
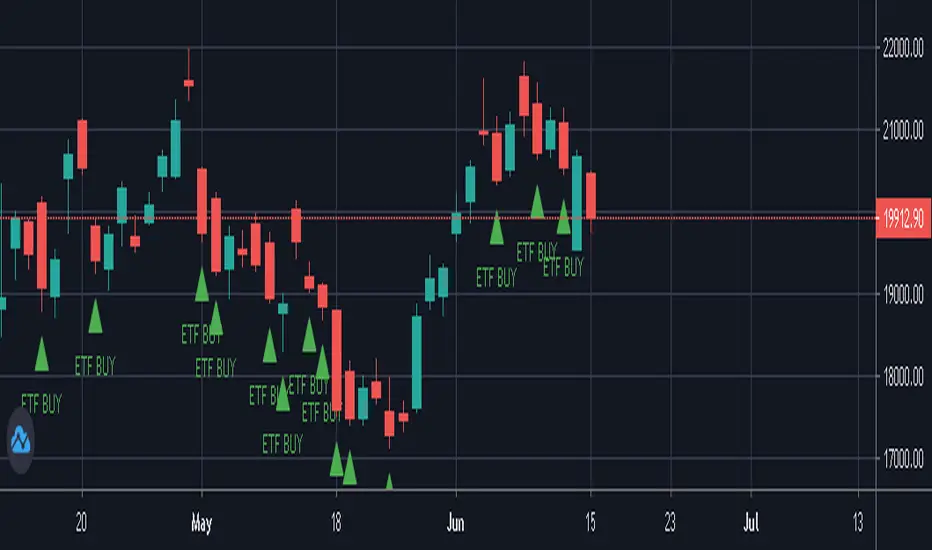
NIFTY / BANKNIFTY ETF SIP NOTIFIERNIFTY / BANKNIFTY - ETF SIP NOTIFIER
STUDY concept -
- As a market investor, one cannot time the market.
- Specailly, working professionals and job holders don't have time for market tracking.
- The idea of the script is - When Nifty closes below 2% previous day high, market has corrected and it's available at a discount w.r.t. previous day
- One can then invest in NIFTY / BANKNIFTY via ETF option on same or next day.
- If you like this idea, Save this script and add alert condition of this script in NIFTY / BANKNIFTY chart.
- One can get notification on TradingView mobile app or via email when the criteria is met.
- Logic can be applied to investing in INDEXES , NIFTY, BANKNIFTY.
Logic may be improved later.
NOTE - Investing is a serious and risky business. Profit / Loss from this investing idea is sole responsibility of the investor. This script is for education and learning purpose.
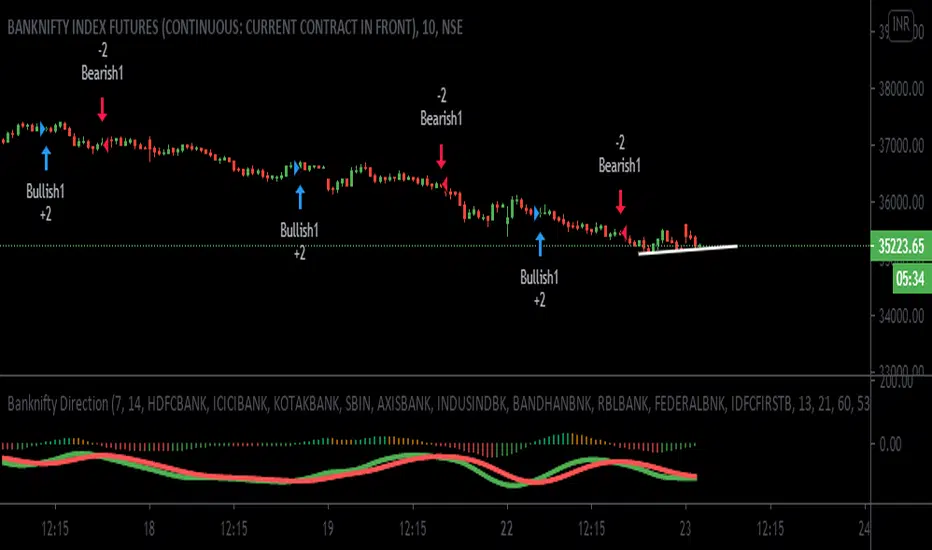
Banknifty-Direction-Bank-StocksBanknifty Direction Bank Stocks is indicator to give Banknifty future direction.
This Indicator is giving signal by taking 11 Major Indian Bank trend into consideration.
This indicator is giving two signal Bullish and Bearish .
Bullish signal can be used for long Banknifty and Bearish signal can be used to close existing Banknifty position and make new short side position and again when Bullish signal come then close existing short position and take new long position and so on.
There is zone area green zone and red zone and central line. Green zone is Bullish area and Red zone is Bearish area.
When ever green line cross over red line then Bullish signal generated and when ever green line cross under red line Bearish Signal generated.
Strong Bullish when Crossover is happening above central line and Strong Bearish when Cross under is happening below central line.
Many Thanks to LazyBear main author, I have used his wave trend function and modified that as per Banknifty index so that we can get better result.
User must keep the default setting for getting better results as results are back tested. If setting changed then result may vary.
I have added here back tested performance user can see those results. I have added commission and slippage as well.
This indicator is available on Subscription.
PM/DM for more information about the script access.
Use the link below to obtain access to this indicator
BNF VWAP & MAThe script picks up Bank nifty stocks with their current respective weights and plots a Volume Weighted Average Price ( VWAP ) line along with 2 EMAs of your choice and an alert when the EMAs cross over and also when price crosses VWAP .
You can customize the script for MA type and lengths and to remove alert. Basic utility of the script is to analyse volumes driving the Bank Nifty index.
Credits to @daytraderph and his script (Custom Volume ) who's code I used to build this script. Also thanks to my friend @Varun who helped me code it.

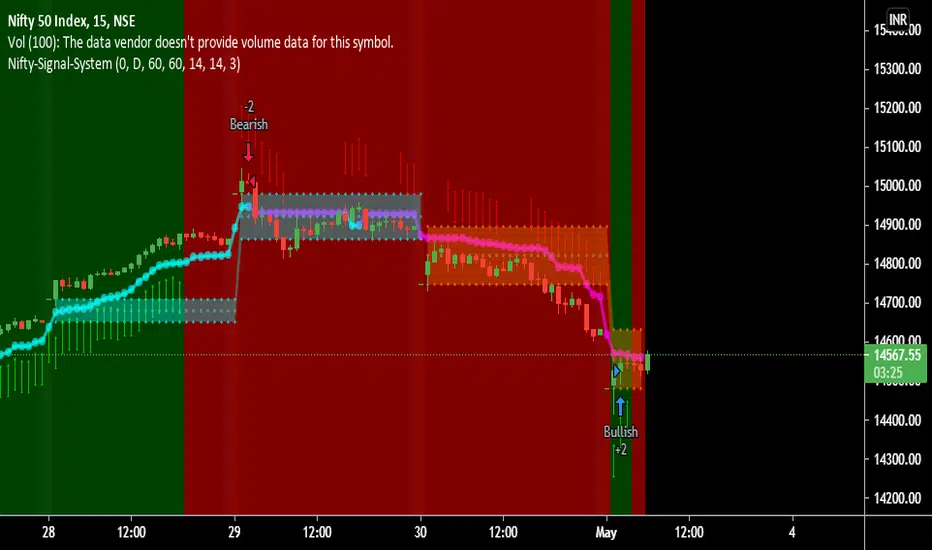
Nifty-Signal-SystemNifty-Signal-System is giving Bullish and Bearish signal for trade to buy and sell.
This signal system is mainly finding trend change and momentum change in the scripts.
There is two signal one Big triangle for Bullish and Bearish signal and another is arrow signal.
Arrow signals are generating for finding the continuation of trend.
Each arrow trader can do pyramiding with trend and close the trade whenever small red arrow come or bearish signal start and can take opposite side of the trade.
I have designed this signal system for NSE:NIFTY Index only.
Default Parameter are : Time Frame, ATR Period, ATR Multiplier, Look Back Period
Default parameter given on Input is giving optimum results if user want to change the setting results can vary.
With Strategy Tester i am able to give performance report. User can check the report .
I have mentioned order details with commission and slippages on each trades.
This signal is available on subscription. contact me or ping me for more details.
{INDYAN} Dual Supertrend#Always follow MAJOR trend, find MINOR trend as per Major trend and choose entry/exit accordingly .
Suppose major trend is blue so only go long while inside minor trend is green, when it turns RED exit from long but dont short in BLUE i.e. major uptrend and vice versa for downtrend i.e. major should be pink and minor should be red for short and when it turn green under pink just exit the sort.
By default major trend is set to 15 Minutes which is generally good for index, and 1 hour should be for stocks. You can change it through settings.
My recommendation for index is major should be 15 minutes and minor 5 and for stocks major should be 1 hour and minor 15 minutes.
It can be used with index,stocks and commodties.
Hope it will help my trader friends.
Happy Trading...
Love INDYAN
