FOR CRT SMT – 4 CANDLEFOR CRT SMT – 4 CANDLE Indicator
This indicator detects SMT (Smart Money Technique) divergence by comparing the last 4 candle highs and lows of two different assets.
Originally designed for BTC–ETH comparison, but it works on any market, including Forex pairs.
You can open EURUSD on the chart and select GBPUSD from the settings, and the indicator will detect SMT divergence between EUR and GBP the same way it does between BTC and ETH. This makes it useful for analyzing correlated markets across crypto, forex, and more.
🔴 Upper SMT (Bearish Divergence – Red)
Occurs when:
The main chart asset makes a higher high,
The comparison asset makes a lower high.
This may signal a liquidity grab and potential reversal.
🟢 Lower SMT (Bullish Divergence – Green)
Occurs when:
The main chart asset makes a lower low,
The comparison asset makes a higher low.
This may indicate the market is sweeping liquidity before reversing upward.
📌 Features
Uses the last 4 candles of both assets.
Automatically draws divergence lines.
Shows clear “SMT ↑” or “SMT ↓” labels.
Works on Crypto, Forex, and all correlated assets.
Bill Williams Indicators

Trend Finder - Buy/Sell (Anuj Edition)Renko Trend Finder – Anuj Edition is a powerful trend-following tool designed to detect market direction using Renko logic instead of traditional candlesticks.
Renko filtering removes market noise, making trends clearer and reversals easier to identify.
This indicator internally builds Renko-style price movement and generates clean, high-quality Buy and Sell signals without repainting.

3 EMA TRONG 1-NTT CAPITALThe 3 EMA in 1 NTT CAPITAL indicator provides an overview of the market trend with three EMAs of different periods, helping to identify entry and exit points more accurately, thus supporting traders in making quick and effective decisions.

Master Indicator (Sessões + DWM + Lookback)Developed to track sessions in Asia, London, and New York.
With it, you can track the highs and lows of the sessions, as well as their captures.
You will also be able to view the highs and lows of days, weeks, and months in as many periods as you want.
All functions can be viewed in specific timeframes; adjust as needed for your trading strategy.
Finally, you will also have the option to configure midnight open and true day open.

LeO Nam - Thỏ TraderHello everyone, this indicator is designed to help you fight across all battlefields with a minimum win rate of 70% or higher. It can be used on multiple timeframes and delivers the highest efficiency on the M5 and M15 timeframes, which currently offer the best win-rate performance.
The indicator already includes full TP/SL levels — you simply need to follow the signals.
Note: When using the AE indicator, you must strictly follow the trading rules, enter only at valid breakout signals, set proper TP/SL, and apply proper risk management. Absolutely do NOT go all-in.

Options Scalper v2 - SPY/QQQHere's a comprehensive description of the Options Scalper v2 strategy:
---
## Options Scalper v2 - SPY/QQQ
### Overview
A multi-indicator confluence-based scalping strategy designed for trading SPY and QQQ options on short timeframes (1-5 minute charts). The strategy uses a scoring system to generate high-probability CALL and PUT signals by requiring alignment across multiple technical indicators before triggering entries.
---
### Core Logic
The strategy operates on a **scoring system (0-9 points)** where both bullish (CALL) and bearish (PUT) conditions are evaluated independently. A signal only fires when:
1. A recent EMA crossover occurred (within the last 3 bars)
2. The direction's score meets the minimum threshold (default: 4 points)
3. The signal's score is higher than the opposite direction
4. Enough bars have passed since the last signal (cooldown period)
5. Price action occurs during valid trading sessions
---
### Indicators Used
| Indicator | Purpose | CALL Condition | PUT Condition |
|-----------|---------|----------------|---------------|
| **9/21 EMA Cross** | Primary trigger | Fast EMA crosses above slow | Fast EMA crosses below slow |
| **200 EMA** | Trend filter | Price above 200 EMA | Price below 200 EMA |
| **RSI (14)** | Momentum filter | RSI between 45-65 | RSI between 35-55 |
| **VWAP** | Institutional level | Price above VWAP | Price below VWAP |
| **MACD (12,26,9)** | Momentum confirmation | MACD line > Signal line | MACD line < Signal line |
| **Stochastic (14,3)** | Overbought/Oversold | Oversold or K > D | Overbought or K < D |
| **Volume** | Participation confirmation | Spike on green candle | Spike on red candle |
| **Price Structure** | Breakout detection | Higher high formed | Lower low formed |
---
### Scoring Breakdown
**CALL Score (Max 9 points):**
- Recent EMA cross up: +2 pts
- EMA alignment (fast > slow): +1 pt
- RSI in bullish range: +1 pt
- Above VWAP: +1 pt
- MACD bullish: +1 pt
- Volume spike on green candle: +1 pt
- Stochastic setup: +1 pt
- Above 200 EMA: +1 pt
- Breaking higher high: +1 pt
**PUT Score (Max 9 points):**
- Recent EMA cross down: +2 pts
- EMA alignment (fast < slow): +1 pt
- RSI in bearish range: +1 pt
- Below VWAP: +1 pt
- MACD bearish: +1 pt
- Volume spike on red candle: +1 pt
- Stochastic setup: +1 pt
- Below 200 EMA: +1 pt
- Breaking lower low: +1 pt
---
### Risk Management
The strategy uses **ATR-based dynamic stops and targets**:
| Parameter | Default | Description |
|-----------|---------|-------------|
| Stop Loss | 1.5x ATR | Distance below entry for longs, above for shorts |
| Take Profit | 2.0x ATR | Creates a 1:1.33 risk-reward ratio |
Positions are also closed on:
- Opposite direction signal (flip trade)
- Take profit or stop loss hit
---
### Session Filtering
Trades are restricted to high-liquidity periods by default:
- **Morning Session:** 9:30 AM - 11:00 AM EST
- **Afternoon Session:** 2:30 PM - 3:55 PM EST
This avoids choppy midday price action and captures the highest volume periods.
---
### Input Parameters
| Parameter | Default | Description |
|-----------|---------|-------------|
| Fast EMA | 9 | Fast moving average period |
| Slow EMA | 21 | Slow moving average period |
| Trend EMA | 200 | Long-term trend filter |
| RSI Length | 14 | RSI calculation period |
| RSI Overbought | 65 | Upper RSI threshold |
| RSI Oversold | 35 | Lower RSI threshold |
| Volume Multiplier | 1.2x | Volume spike detection threshold |
| Min Signal Strength | 4 | Minimum score required to trigger |
| Crossover Lookback | 3 | Bars to consider crossover "recent" |
| Min Bars Between Signals | 5 | Cooldown period between signals |
---
### Visual Elements
**Chart Plots:**
- Green line: 9 EMA (fast)
- Red line: 21 EMA (slow)
- Gray line: 200 EMA (trend)
- Purple dots: VWAP
**Signal Markers:**
- Green triangle up + "CALL" label: Buy call signal
- Red triangle down + "PUT" label: Buy put signal
- Small circles: EMA crossover reference points
**Info Table (Top Right):**
- Real-time CALL and PUT scores
- RSI, MACD, Stochastic values
- VWAP and 200 EMA position
- Recent crossover status
- Current signal state
---
### Alerts
| Alert Name | Trigger |
|------------|---------|
| CALL Entry | Standard call signal fires |
| PUT Entry | Standard put signal fires |
| Strong CALL | Call signal with score ≥ 6 |
| Strong PUT | Put signal with score ≥ 6 |
---
### Recommended Usage
| Setting | 0DTE Scalping | Intraday Swings |
|---------|---------------|-----------------|
| Timeframe | 1-2 min | 5 min |
| Min Signal Strength | 5-6 | 4 |
| ATR Stop Mult | 1.0 | 1.5 |
| ATR TP Mult | 1.5 | 2.0 |
| Option Delta | 0.40-0.50 | 0.30-0.40 |
---
### Key Improvements Over v1
1. **Requires actual crossover** - Eliminates false signals from simple trend continuation
2. **Balanced scoring** - Both directions evaluated equally, highest score wins
3. **Signal cooldown** - Prevents overtrading with minimum bar spacing
4. **Multi-indicator confluence** - 8 factors must align for signal generation
5. **Volume-candle alignment** - Volume spikes only count when matching candle direction
---
### Disclaimer
This strategy is for educational purposes. Backtest thoroughly before live trading. Options trading involves significant risk of loss. Past performance does not guarantee future results.

Evergito HH/LL 3 Señales + ATR SLHow to trade with the Evergito HH/LL 3 Signals + ATR SL indicator? Brief and direct explanation: General system logic: The indicator looks for actual breakouts of the high/low of the last 20 bars (HH/LL) and combines them with the position relative to the 200 SMA to filter the underlying trend. You have 3 types of signals that you can activate/deactivate separately: Signal
When it appears
What it means in practice
Entry type
V1
HH breakout + the close crosses above the 200 SMA (or the opposite in a short position)
Very safe entry confirmed. The price has just validated the long/flat trend → safer and with a better ratio
The most reliable (the original)
V2
HH breakout but the price was already above the 200 SMA (or already below in a short position)
Entry in an already established trend. Fewer “surprises”, more continuity
Ideal for strong trends
V3
Only the breakout of the HH or LL, without looking at the 200 SMA
Aggressive entry/scalping on explosive breakouts. More signals, more noise.
For times of high volatility.
How to enter the market (simple rule): Wait for any of the 3 labels (V1, V2, or V3) to appear, depending on which ones you have activated.
Enter at the close of that candle (or at the open of the next one if you are conservative).
Automatic Stop Loss → the blue (long) or yellow (short) line that represents the ATR x2.
Take Profit → you decide, but the indicator already gives you the visual reference for the risk (ATR x2), so 1:2 or 1:3 is usually very convenient.
Practical example: You see a large green label “HH LONG V1” → you go long at the close of that candle. Stop right at the blue line (ATR x2 below the price).
Typical target: 2x or 3x the risk (very common to reach it in a trend).
Recommended use: Most traders leave only V1 activated → fewer signals but very high quality.
Those who trade intraday or crypto usually combine V1 + V2.
V3 only for news events or very volatile openings.
In summary:
Label = immediate entry
Blue/yellow line = automatic stop
And enjoy the move.

VietNguyen Buy_Sell VIPThis is indicator of Vietnammes, it is very good for trade Gold and Crypto.
Cre by: VietNguyenDN

Мой скриптinputs:
window(1),
type(0), // 0: close, 1: high low, 2: fractals up down, 3: new fractals
persistent(False),
exittype(1),
nbars(160),
adxthres(40),
nstop(3000);
vars:
currentSwingLow(0),
currentSwingHigh(0),
trailStructureValid(false),
downFractal(0),
upFractal(0),
breakStructureHigh(0),
breakStructureLow(0),
BoS_H(0),
BoS_L(0),
Regime(0),
Last_BoS_L(0),
Last_BoS_H(0),
PeakfilterX(false);
BoS(window,persistent,type,Bos_H,BoS_L,upFractal,downFractal,breakStructureHigh,breakStructureLow);
//BOS Regime
If BoS_H <> 0 then begin
Regime = 1; // Bullish
Last_BoS_H = BoS_H ;
end;
If BoS_L <> 0 Then begin
Regime = -1; // Bearish
Last_BoS_L = BoS_L ;
end;
//Entry Logic: if we are in BoS regime then wait for break swing to entry
if ADX(5) of data2 < adxthres then begin
if time>900 and Regime = 1 and EntriesToday(date)= 0 and Last_BoS_H upFractal then buy next bar at market;
end;
if time>900 and EntriesToday(date)= 0 and Regime = -1 and Last_BoS_L>downFractal then
begin
if close < downFractal then sellshort next bar at market;
end;
end;
// Exits: nbars or stoploss or at the end of the day
if marketposition <> 0 and barssinceentry >nbars then begin
sell next bar at market;
buytocover next bar at market;
end;
setstoploss(nstop);
setexitonclose;

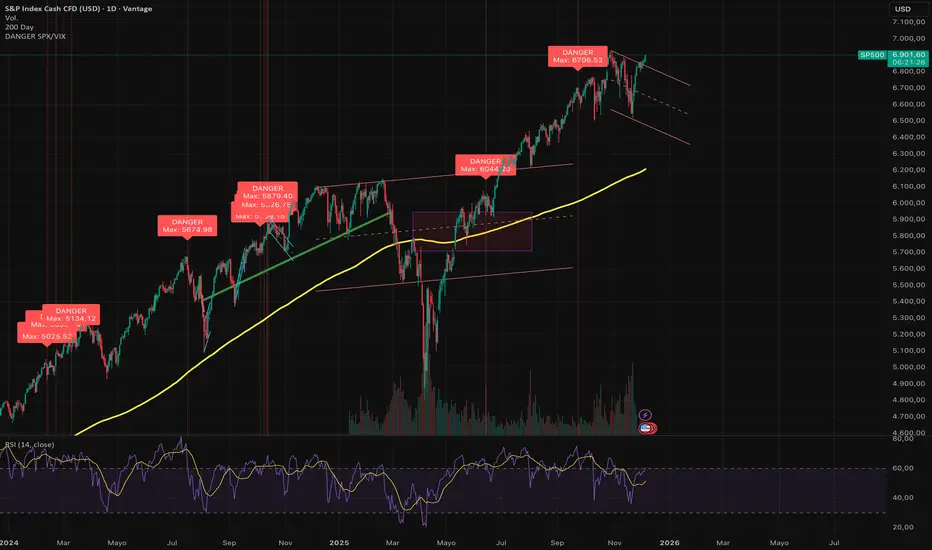
DANGER SP500This indicator is designed to identify severe correlation anomalies between the Volatility Index (VIX) and the S&P 500 (SPX). It operates on the premise that a simultaneous rise in both assets often precedes market corrections or significant local tops.
The underlying concept is "fear in the rally": investors are buying equities (driving price up), but at the same time, they are aggressively buying protection (Puts), causing the VIX to spike.
⚠️ Strict Usage Rules
To guarantee the mathematical reliability of the VIX data, this indicator includes strict security restrictions:
EXCLUSIVE ASSET: Designed solely for the S&P 500 (SPX, SPY, US500, ES1!). It should not be used on Crypto or Forex, as the VIX correlation does not apply in the same way.
LOCKED TIMEFRAME: It only functions on the Daily Chart (1D).
Note: The script includes a runtime.error block that will prevent execution if you attempt to load it on intraday charts (H1, H4, etc.) to avoid false signals caused by market noise.
Visualization
Red Background: Visually highlights the exact moment the alert is triggered.
"DANGER" Label: Prints clearly above the signaled bar.
Max Price Display: Unlike other indicators that mark the close, this tool specifically labels the HIGH of the candle, allowing you to identify the exact point of price extension.
🔔 Alerts
The script is ready for TradingView Alerts. The alert message is dynamic and will include the exact High price reached during the signal candle.
Disclaimer: This script is for technical analysis purposes only and does not constitute financial advice. Trading involves risk.
teril Harami Reversal Alerts BB Touch (Wick Filter Added) teril Harami Reversal Alerts BB Touch (Wick Filter Added)
teril Harami Reversal Alerts BB Touch (Wick Filter Added) teril Harami Reversal Alerts BB Touch (Wick Filter Added) teril Harami Reversal Alerts BB Touch (Wick Filter Added)
teril Harami Reversal Alerts BB Touch (Wick Filter Added)

MAX TRADEMAX TRADE is a smart trend-following indicator designed for Forex and XAUUSD. It uses a dynamic channel with Fibonacci levels to generate clear LONG and SHORT signals on any timeframe. The script supports fixed pip SL/TP, partial take profits, break-even logic and optional EMA/RSI/ATR filters to avoid bad entries. It also tracks win rate and total percent profit in real time so you can quickly see how the strategy is performing on your backtests.

MAX TRADE ZONA simple session level indicator for XAUUSD on the M5 timeframe. It takes the high and low of the 00:45 candle (Asia/Tashkent time), draws infinite horizontal lines from that candle, and keeps only the most recent 7 days. Useful for intraday support and resistance levels.

67 2.0Major Market Trading Hours
New York Stock Exchange (NYSE)
Open: 9:30 AM (ET)
Close: 4:00 PM (ET)
Pre-Market: 4:00 AM – 9:30 AM (ET)
After Hours: 4:00 PM – 8:00 PM (ET)
Nasdaq
Open: 9:30 AM (ET)
Close: 4:00 PM (ET)
Pre-Market: 4:00 AM – 9:30 AM (ET)
After Hours: 4:00 PM – 8:00 PM (ET)
London Stock Exchange (LSE)
Open: 8:00 AM (GMT)
Close: 4:30 PM (GMT)
Tokyo Stock Exchange (TSE)
Open: 9:00 AM (JST)
Lunch Break: 11:30 AM – 12:30 PM (JST)
Close: 3:00 PM (JST)
Hong Kong Stock Exchange (HKEX)
Open: 9:30 AM (HKT)
Lunch Break: 12:00 PM – 1:00 PM (HKT)
Close: 4:00 PM (HKT)

Crypto Intraday Scalper [Patterns + RSI + Volume + MTF + ADX]# Guide to Reading the Indicator (CIS Pro v2)
## 1. Operational Signals (The Labels)
- **GREEN Label "BUY"**:
**Meaning**: Entry for a Long position.
**Conditions**: Bullish candle pattern + Oversold RSI + High Volume + Bullish 1-hour trend + Sufficient Volatility.
- **RED Label "SELL"**:
**Meaning**: Entry for a Short position.
**Conditions**: Bearish candle pattern + Overbought RSI + High Volume + Bearish 1-hour trend + Sufficient Volatility.
- **No Label**: The market is in an uncertain phase, sideways movement, or filters (ADX/MTF) are blocking signals for protection.
## 2. Trend Lines (The Context)
- **Gray Line (EMA 200)**: This serves as the dividing line between bullish and bearish trends.
**Rule**: Seek Long positions only above the gray line; Short positions only below it.
- **Red/Green Step Line (Supertrend / Trailing Stop)**:
**Green (below the price)**: Strong bullish trend. Acts as dynamic support.
**Red (above the price)**: Strong bearish trend. Acts as dynamic resistance.
**Usage**: Use it for trade exits. If in a Long position and the line turns red, close the entire trade.
## 3. Price Levels (Targets and Supports)
- **Blue/Red/Green Dots (Pivot Points)**:
These are levels calculated from the previous day. The price tends to bounce at these points. Use them as final targets for taking profit.
- **Orange Line (VWAP)**:
This represents the "average price" for the day. If the price deviates too far, it often returns (elastic effect).
- **Dashed Lines (Appear after a signal)**:
**Red Dashed**: Suggested Stop Loss (based on ATR volatility).
**Green Dashed**: Suggested Take Profit (quick target).
## 4. The Table (Dashboard in the Top Right)
This provides reasons why you may not be receiving signals:
- **Trend (Current)**: The trend on your current chart.
- **Trend (MTF 60)**: The trend on the 1-hour chart. If these two conflict (e.g., Bullish vs. Bearish), no signals will appear.
- **ADX Volatility**: If RED (below 20), the market is flat—no trades. If GREEN, there is sufficient movement.
- **Volume Status**: Alerts if anomalous high volume is entering (High) or if conditions are calm.
## 🚀 Operational Summary
- Wait for the label.
- Quick Check: Is the price on the correct side of the gray line? Is the step line the right color?
- Enter the trade.
- Exit when the price hits the green dashed line (Quick Take Profit) **OR** when the price breaks the step line (Trailing Stop for longer trends).
What aspect of this indicator should we analyze next—perhaps integrating it with real-time ETH data or testing it via code execution for backtesting?

dual moving average crossover Erdal//@version=5
indicator("MA Cross Simple", overlay=true)
// Inputs
fastLen = input.int(10)
slowLen = input.int(100)
// Moving averages
fastMA = ta.sma(close, fastLen)
slowMA = ta.sma(close, slowLen)
// Plot
plot(fastMA, color=color.green)
plot(slowMA, color=color.red)
// Cross signals
bull = ta.crossover(fastMA, slowMA)
bear = ta.crossunder(fastMA, slowMA)
// Labels
if bull
label.new(bar_index, low, "BUY", style=label.style_label_up, color=color.green)
if bear
label.new(bar_index, high, "SELL", style=label.style_label_down, color=color.red)

MAX TRADEMAX TRADE is an advanced intraday trading indicator designed for gold and forex pairs. It uses a dynamic Fibonacci-based trend line, multi-timeframe EMA, RSI and ATR filters to avoid bad entries. Every signal comes with automatic TP/SL levels, break-even logic and a live stats panel showing win rate, profit, number of trades and streaks.


Goldsky - Gold Market SpecialistGoldsky is a sophisticated TradingView Pine Script indicator designed exclusively for XAUUSD (Gold) trading. It features adaptive parameter adjustment, session-based optimization, market regime detection, news event filtering, multi-timeframe analysis, and intelligent risk management specifically calibrated for gold's unique market characteristics.
Features
Adaptive System: Parameters adjust automatically based on market conditions
Session-Based Optimization: Different strategies for Asian/European/American/Overlap sessions
Market Regime Detection: TRENDING/RANGING/BREAKOUT/NEUTRAL market analysis
News Event Filter: Automatic detection and protection during high volatility
Multi-Timeframe Analysis: H1 trend + M15 structure + M5 execution confluence
RSI Integration: Advanced RSI filtering for entries and exits
Bollinger Bands Integration: Volatility analysis and extreme value detection
Risk Management: Gold-specific risk parameters and position sizing

Elliott Wave Multi-Level (Micro/Main)**Title Suggestion:**
Elliott Wave Multi-Level Strategy (Micro/Main)
**Short Description (for TradingView):**
This strategy detects Elliott Waves on two levels — **Micro** (short-term swings) and **Main** (higher-level structures) — and uses them for fully automated long and short trading.
Main Impulse waves (1–5) and ABC corrections are identified using pivot logic, ATR-based movement filters, volume confirmation, and an optional EMA trend filter. Micro Impulse waves serve as confirmation for Main structures, creating a multi-level validation system that significantly reduces false signals.
Entries are taken either:
* **with the trend**, after confirmed Main Impulse waves, or
* optionally as **reversal trades** at the completion of ABC corrections.
Stop-loss and take-profit levels are dynamically calculated using ATR multipliers, allowing the strategy to adapt to different volatility environments. All parameters (pivots, filters, confirmations, risk settings) are fully customizable to fit various markets and timeframes (e.g., 1m–15m).

Harami Reversal Alerts BB Touch (Strict First Candle)Harami Reversal Alerts BB Touch (Strict First Candle)
Harami Reversal Alerts BB Touch (Strict First Candle)Harami Reversal Alerts BB Touch (Strict First Candle)Harami Reversal Alerts BB Touch (Strict First Candle)Harami Reversal Alerts BB Touch (Strict First Candle)Harami Reversal Alerts BB Touch (Strict First Candle)

MarketCap & Sector MarketCap & Sector Dashboard is a lightweight info panel that shows three key fundamentals for any NSE/BSE stock directly on your chart: current market capitalization (in crores), sector, and industry. It keeps this basic context always visible so you can quickly see how big the company is and where it sits in the market without leaving the price chart.
