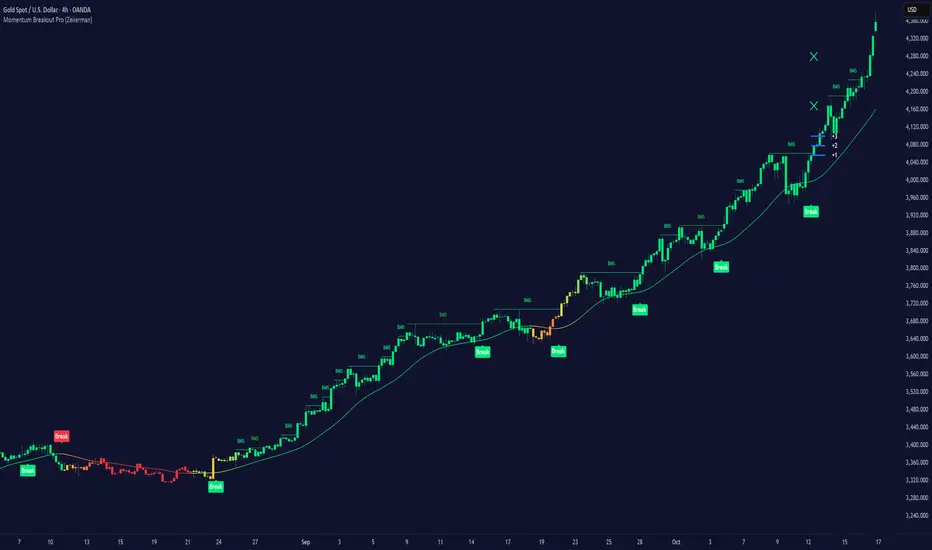
Momentum Breakout Pro (Zeiierman)█ Overview
Momentum Breakout Pro (Zeiierman) is a breakout-focused quantitative system engineered to identify only the strongest momentum expansions in the market. Instead of reacting to price movement, it reconstructs a refined momentum signal, evaluates its strength and persistence, and validates each breakout against the broader market context. Only when momentum pressure aligns with structural direction, trend state, candle behavior, and spacing requirements will a breakout be considered qualified.
The result is a clean and context-aware signal flow that removes noise and highlights only the breakouts with the highest probability of continuation. Traders receive precise Break signals at qualified points, adaptive trend lines, candle-based trend visualization, structure levels, and volatility-driven confirmation markers. Internally, the system operates as a layered confirmation model designed to enforce directional consensus and filter out the shallow or unreliable moves that typically weaken breakout strategies.
In short, Momentum Breakout Pro offers a refined breakout selection system that focuses on quality over quantity, designed for traders who want clean and well-supported breakout signals backed by structured technical logic.
⚪ Why This One Is Unique
Momentum Breakout Pro’s uniqueness comes from its multi-layered confirmation process. The internal momentum reconstruction ensures that only sustained directional pressure is considered meaningful. Optional filters such as Dynamic Trend, SuperTrend, Average Trend, VWAP, and Market Structure provide an adjustable decision stack, allowing traders to decide how strict or flexible the validation should be. Breakouts are released only when the enabled components agree.
█ Main Features
⚪ Breakout Signals
The Breakout Signals are the core feature of the indicator. They help traders identify high probability breakouts that are more likely to follow through. With built-in confirmation levels, it becomes much easier to judge whether a breakout is strong or likely to fail. Combined with the suggested take profit points, traders can quickly find confirmed breakout opportunities with realistic first profit targets.
⚪ Breakout Filters
The indicator includes multiple filters that align each breakout with the current trend, structure, and momentum. This is essential for identifying only the strongest and most reliable breakout setups.
⚪ Dynamic Trend
The Dynamic Trend is a volatility-aware long-term trend filter. It removes noise and adapts to sharp volatility swings, staying focused on the true underlying trend direction. This helps traders avoid false signals and remain aligned with the broader market drift.
⚪ Moving Average
A standard moving average with a user-defined length. Simple, effective, and easy to understand. It acts as a clean trend filter for both beginners and advanced traders.
⚪ Super Trend
A Super Trend filter that restricts breakout signals to appear only in the direction of the active SuperTrend. This adds an additional layer of directional confirmation.
⚪ VWAP
VWAP (Volume Weighted Average Price) is a powerful anchor, especially on lower timeframes. It serves as a dynamic support or resistance level and a highly reliable trend filter.
⚪ Candle Coloring
The candle coloring engine tracks how long the price has moved in one direction and translates that persistence into a graded bull, mid, or bear color spectrum. This helps traders quickly understand trend strength, confirm momentum, and allow the market enough space to move before a larger breakout occurs.
⚪ Momentum
The momentum filter identifies bursts of momentum and highlights the strongest correlations between price and movement strength. It filters out weak breakouts that are not backed by real momentum, improving accuracy significantly.
⚪ Market Structure
Trading with the current market structure is crucial. This filter ensures that breakout signals appear only when they align with the existing structure, helping traders stay on the right side of the market.
█ How to Use
⚪ Breakouts
Use this tool to identify high-quality breakouts. To increase accuracy, combine the breakout signals with the trend, structure, and momentum filters. When these elements align, the probability of a successful breakout increases significantly.
⚪ Confirmation Levels
The indicator includes three confirmation levels that adapt based on current market volatility.
These levels help you judge the strength of the breakout:
When the three levels are tight and close to the price, it indicates strong conditions. Price is more likely to break through all levels quickly and confirm the breakout.
When the levels are spread out and far from the price, the breakout becomes weaker. Price must travel too far to confirm the move, which lowers the probability of a clean follow-through.
What you want to see is a breakout where all three confirmation levels are penetrated within the next few candles. That is the ideal scenario, indicating a confirmed breakout with a higher chance of continuation in that direction.
⚪ Take Profit Strategy
The indicator includes built-in take profit levels, which act as your first two targets after a confirmed breakout:
Once Take Profit 1 is hit, move your stop loss to break even.
When Take Profit 2 is hit, move your stop loss to the first take profit level.
From there, allow the position to run until the candle coloring shifts, signaling that momentum may be slowing or reversing.
This approach helps you secure profits early, reduce risk, and stay in the trade for larger moves when the trend is strong.
█ Setting Realistic Expectations: Win-Rate and Risk–Reward
Research on breakout systems, trend-following strategies, and directional volatility all show the same behavioral pattern. Win rates tend to be moderate, while risk and reward are positively skewed. Most breakout attempts are tested quickly by the market and may result in small losses or breakeven trades. The real edge comes from the smaller group of breakouts that expand into multi-stage moves and generate significantly larger gains. This is a well-established characteristic of momentum-driven price dynamics.
Momentum Breakout Pro is designed to work within this framework. It is not built to win on every signal, but to highlight conditions that historically align with stronger follow-through. The tool provides structure levels, confirmation lines, and initial target markers to help traders measure extension and manage risk objectively. Actual results will vary depending on the filters enabled, the markets traded, and how stops and exits are managed. However, the overall expectation remains consistent with established breakout research: frequent smaller outcomes combined with fewer but more impactful winners.
█ How It Works
⚪ Breakout System
The breakout system detects emerging directional expansions by transforming price movement into a stabilized signal curve. It evaluates localized impulse strength, directional bias, and short-term acceleration to determine when the price is exerting statistically meaningful pressure in one direction. When this pressure breaches the system’s internal thresholds, a breakout candidate is registered.
Calculation: Price is processed through a multi-stage smoothing pipeline to construct a normalized signal curve. The script analyzes the curve’s gradient and micro-momentum characteristics within a compact evaluation window. A breakout event is triggered when these combined directional metrics exceed the system’s momentum-pressure threshold.
⚪ Momentum Confirmation
To prevent weak or premature breakouts, the system verifies that momentum behavior aligns with the directional expansion. This ensures that only breakouts supported by sustained impulse strength are considered.
Calculation: The script evaluates the strength, stability, and directional consistency of momentum over the developing move. Instead of reacting to isolated shifts, it assesses whether momentum maintains a coherent and persistent trajectory that reinforces the breakout direction. A breakout is confirmed only when momentum structure and directional pressure are synchronized.
⚪ Confirmation Levels
Once a breakout is detected, three confirmation levels indicate how far the price must travel to confirm the breakout's strength.
Calculation: The levels are spaced using a volatility-adjusted distance formula. A breakout is considered strong when the price clears all three levels within a short time window.
⚪ Targets
Targets provide simple reference points for early take profits and risk management.
Calculation: The distance to a nearby structural or volatility-based reference is measured, then projected outward as proportional 1R / 2R style levels.
-----------------
Disclaimer
The content provided in my scripts, indicators, ideas, algorithms, and systems is for educational and informational purposes only. It does not constitute financial advice, investment recommendations, or a solicitation to buy or sell any financial instruments. I will not accept liability for any loss or damage, including without limitation any loss of profit, which may arise directly or indirectly from the use of or reliance on such information.
All investments involve risk, and the past performance of a security, industry, sector, market, financial product, trading strategy, backtest, or individual's trading does not guarantee future results or returns. Investors are fully responsible for any investment decisions they make. Such decisions should be based solely on an evaluation of their financial circumstances, investment objectives, risk tolerance, and liquidity needs.
Pine Script® indicator