SBS AlgoHello traders, I am here again with a new and improved indicator.
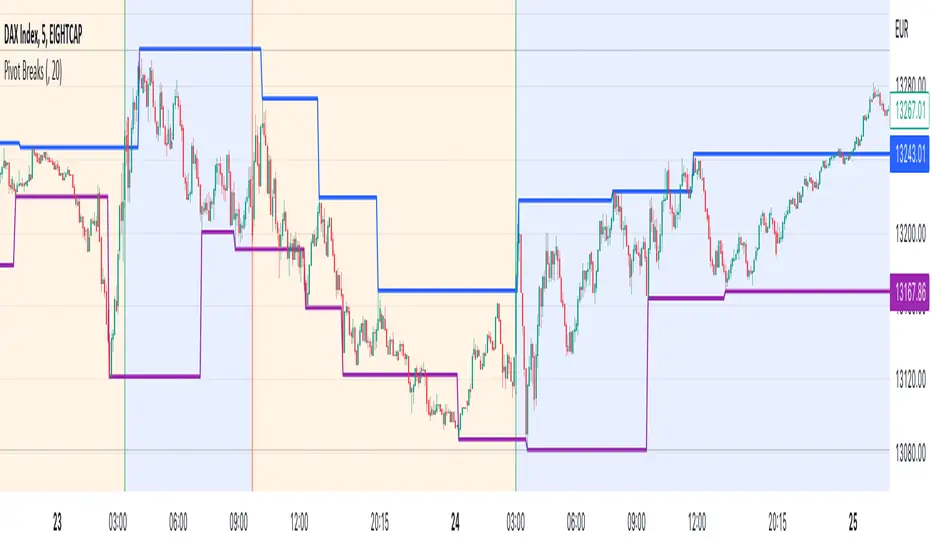
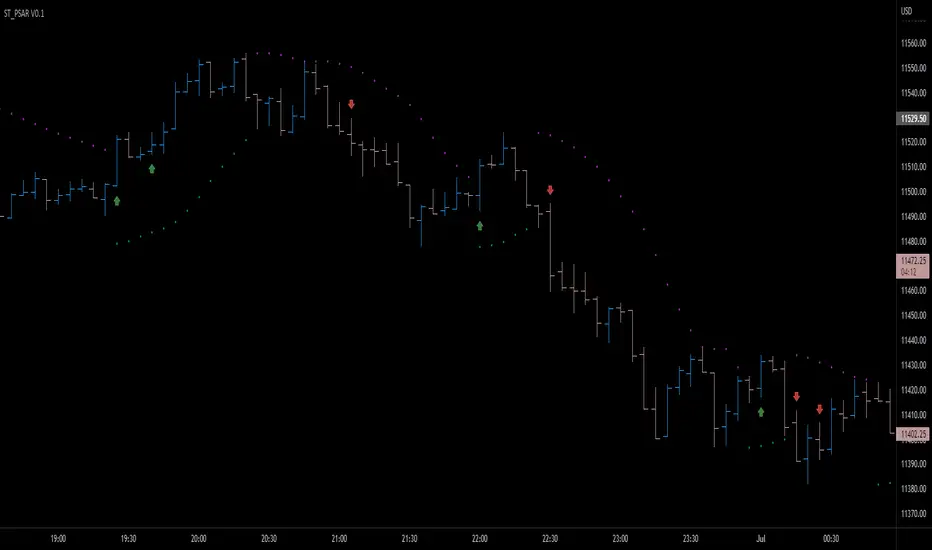
This indicator is based on a pivot breakout algorithm which gives buy and sell signals according to the breakout of trendline. This is an advanced version of another script. It also takes price action into consideration along with some basic indicators like MACD and ADX to give good entry signals.
NOTE: This indicator is not designed to take entries completely based on signals it gives. Please use it along with your trading strategy to add more confluence to your trading system and maximize your profits.
I hope you guys will like this one too .Enjoy 👍
In case you find any bug, please do report in comment section .Thank you.
Pine Script® indicator