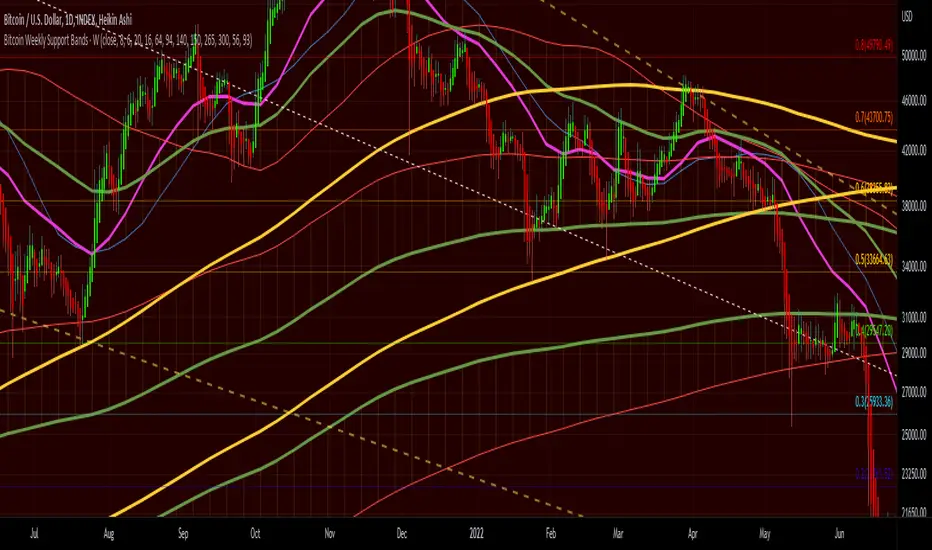
Bitcoin Support BandsSMA and EMA support/resistance bands for Bitcoin. Based on 4 week multiples; 1 month, 3 month, 6 month, 1 year, 2 year, 4 year. Pine Script® indicatorby Ryukobushi44
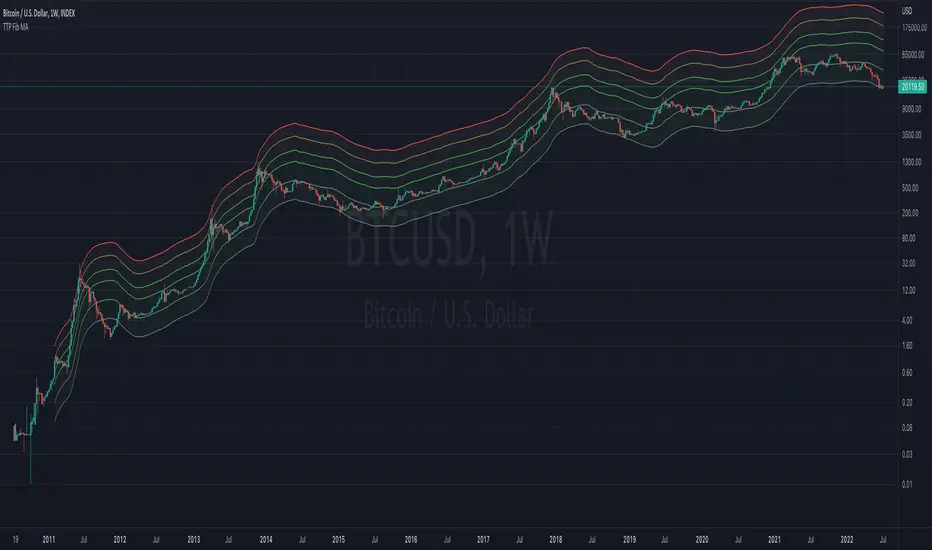
TTP Fibonacci MAThis indicator offers a fibonacci rainbow of moving averages. Recommended instructions: - timeframe: daily or weekly - logarithmic scale - default MA length for smoother curve - fib levels used are 0.5,1,2,3,5 and 8, but you can also try with 1,2,3,5,8,13 or 0.33,05,1,2,3 depending on which range you want to cover - you can render in weekly timeframe and still set the indicator settings timeframe to daily to get more reactive levels Pine Script® indicatorby TheTradingParrotUpdated 112
Wave Strength Oscillator By CryptoScriptsThe Wave Strength Oscillator uses a combination of wave strength and momentum to help catch the best entries for reversals and does so using a few methods. I'm currently using the 1h timeframe for BTC but feel free to experiment on different timeframes to see what works best for you. In the description below, I'll go over each signal, how it's derived, and how to use them! Oversold (Green shaded area) - The oversold indication appears whenever both oscillators are oversold and is usually a good indicator that a reversal to the upside is around the corner (at least for a short period). Be advised these are the weakest of the three signals so I recommend using this signal with other indicators. Overbought (Red shaded area) - The overbought indication appears whenever both oscillators are overbought and is usually a good indicator that a reversal to the downside is around the corner (at least for a short period). Be advised these are the weakest of the three signals so I recommend using this signal with other indicators. Green Diamond - The green diamonds indicate whenever one or both of the oscillators are oversold AND they are both outside of the bollinger bands which is great for catching reversals to the upside (as seen in the chart). These may come two or three at a time so it may be best to wait until they have all printed before entering. Red Diamond - The red diamonds indicate whenever one or both of the oscillators are overbought AND they are both outside of the bollinger bands which is great for catching reversals to the downside (as seen in the chart). These may come two or three at a time so it may be best to wait until they have all printed before entering. Rocket - The rocket symbol occurs whenever BOTH oscillators are oversold and BOTH oscillators are outside of the bollinger bands. This is great for catching reversals to the upside but may come two or three at a time so it may be best to wait until they have all printed before entering. Red Alarm - The red alarm symbol occurs whenever BOTH oscillators are oversold and BOTH oscillators are outside of the bollinger bands. This is great for catching reversals to the downside but may come two or three at a time so it may be best to wait until they have all printed before entering. Input Options Show Histogram - I also included a Histogram in the indicator to help gauge the level of buys/sell strength but kept it hidden for the default levels (i.e a green diamond with a red histogram bar is usually a good sign a reversal is about to happen to the upside whereas a green diamond with a green histogram bar may indicate a false reversal and there's still more room to the downside until a red bar appears. Always backtest this!) Show Overbought/Oversold Levels - This is if you want to ignore all of the green/red shaded areas and only focus on the diamonds and rocket/alarm signals Wave Overbought/Oversold Levels - Free free to change to value of the overbought/oversold levels to change where the green/red shades areas print Momentum Overbought/Oversold Levels - Free free to change to value of the overbought/oversold levels to change where the green/red shades areas print Histogram Length - This will not change anything with the signals but I included it so you can change the visuals if it helps you Momentum Length - This will change where the signals plot Momentum Signal - This only changes the yellow signal line and nothing else. It's not incorporated into any equation Average Length - This will change where the signals plot Alerts I've set alerts on this indicator for each icon (Oversold, Overbought, Green Diamond, Red Diamond, Rocket, Red Alarm). I HIGHLY recommend setting the alerts for Candle Close so that you can be sure the signal is confirmed. You may notice that the indicator can give multiple signals back-to-back or be overbought/oversold for multiple candles. When this happens, it's best to look at other indicators such as the RSI , MFI Pro, etc to nail the best entry and have confluence with your decision. With that said, having multiple signals back-to-back can also be an indication that the move is close to happening. This indicator works with crypto and stocks as well. If you have any questions or would like to purchase this indicator, please comment below or PM me. I also made a video tutorial for the indicator on my Youtube channel (link is next to my profile pic) Be advised past performance is not indicative of future returns. Backtest EVERY timeframe and NEVER blindly take signals! Also, never invest more than you can afford to lose. Enjoy :) Pine Script® indicatorby CryptoScripts1142
[BUBBLENUKE] BOB The Reversal Trader Indicator=============================================================: BOB The Reversal Trader :============================================================= COMPONENTS: - VWAP Anchored at Friday CME close - Bitcoin CME close - Volume bars DESCRIPTION: BOB is a mean-reversion trading system focused in BTCUSDT asset in the 30M time frame. The system is divided into 2 types of entries: WEEKENDS: BOB will trigger his entry when the price of Bitcoin is at one of the two deviations from the VWAP anchored at Friday CME close INTRA-WEEK: BOB will trigger its entry when the price of Bitcoin is at one of the two deviations from the VWAP anchored at the Friday CME close or when a volume candle indicates a reversalPine Script® indicatorby UnknownUnicorn208413416
TTP 3-checkmarks CCU market bottomThis indicator is an implementation of the method published by Steve from Crypto Crew University . I didn't design this strategy, I'm only implementing it to allow people to be able to backtest it or set trading view alerts based on the original criteria. This indicator can be backtested with Gavin's backtester, TTPTSL and any other indicator that can take a 1 as an external signal to buy. How to use: - add to INDEX:BTCUSD - set the timeframe to 2D Indicator parameters - RSI 14 - stochastic RSI 3 3 14 14 - MA 200 - all in 2 day timeframe and using the close as source Strategy: - price needs to be below 200 MA - RSI < 26 - stochastic rsi both lines below 20 - price should not be crossing the MA ( I added this to remove one signal that Steve also manually removed in the video) I recommend watching his video to understand how it's supposed to work in more detail. youtu.be It's interesting to see that there are a few more signals that are fairly good but are being marked as invalid in the video even though they seem to fulfil the 3 checkmarks too. I left a question in the video to learn why and if it's intended. I'll keep you posted. Pine Script® indicatorby TheTradingParrotUpdated 22194
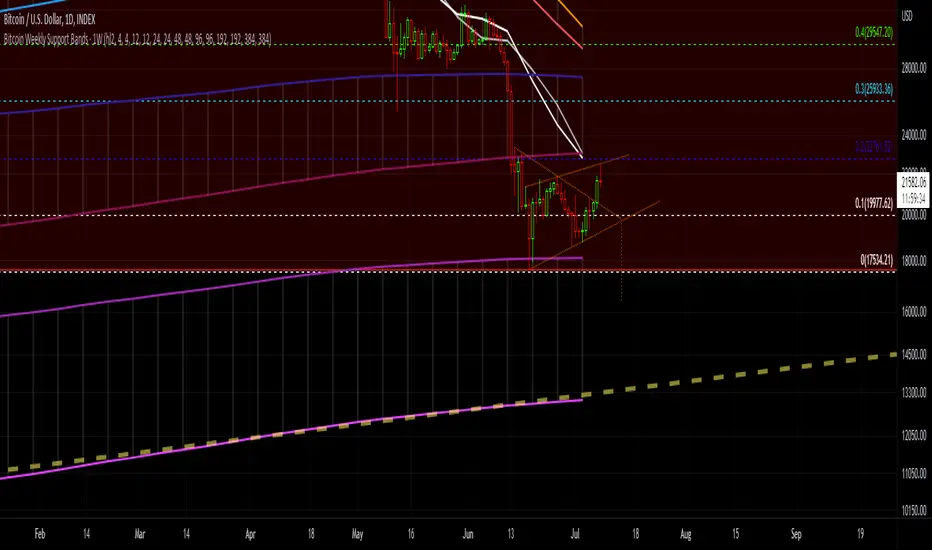
Bitcoin Weekly Support BandsMy first ever attempt at a custom script. I took Benjamin Cowen's concept of the Bitcoin Bull Market Support Band and applied it to the 100 week and 200 week moving averages. I also added in the 300 week sma. I mainly wanted to have all these in one indicator.Pine Script® indicatorby RyukobushiUpdated 1126
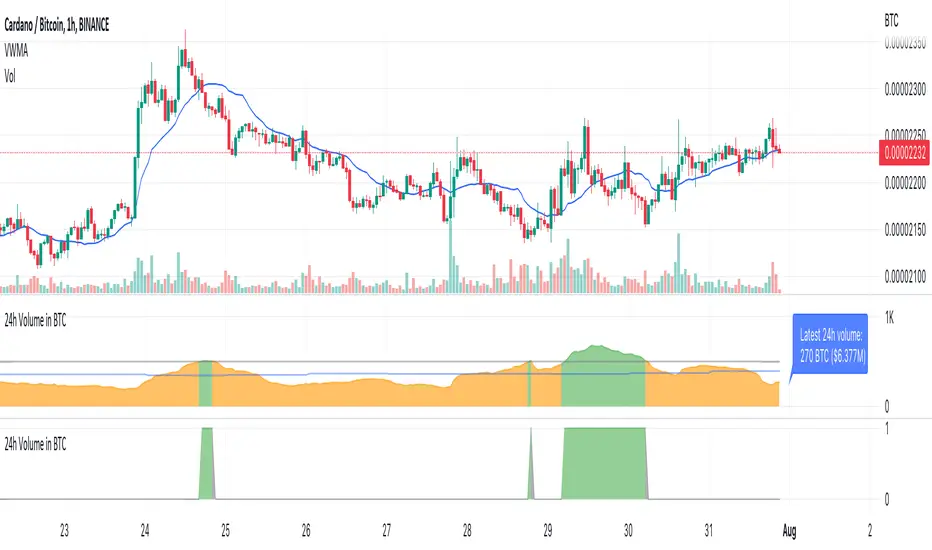
TTP Volume in BTCThis indicator shows you the volume of the last 24 hours of the current asset converted into BTC The classic way to measure volume is by the base units of the asset itself being bought and sold in the selected timeframe. When trading crypto with bots it can be useful to filter out which assets/altcoins to trade by analysing the 24 hours-volume of the asset converted into Bitcoin instead of in the asset itself. By using Volume in BTC as a reference between assets you can rate and identify key levels of volume using the same reference and identify if an assets has enough liquidity for your personal requirements. You can also ensure assets are only traded when the volume is above your set threshold if you set this in your bots. The volume is measured from the sum of the last 24 hourly closed candles multiplied with the average price during this period → 24h Vol * VWMA (Volume Weighted Moving Average). What it does? Measures the asset volume for the last 24 hrs converted to BTC Regardless of chart timeframe it always shows you the last 24 hrs volume Does not repaint, it uses only confirmed data by candle close Shows the latest 24 hours of volume in BTC counted from the bar Shows the latest 24 hours volume in BTC and USD as a label on the latest bar It is color coded to show when it’s above or below your threshold visually How to use it? Use the Volume Threshold to identify periods when the volume is above or below your threshold Set alerts to get alerted when the volume crosses your threshold in either direction Pine Script® indicatorby asterbotsUpdated 2229
BTC Weighted Agg. Basis [Osc] [Moto]Hello traders, This script shows the exchange volume-weighted aggregate basis for Bitcoin. Exchanges have differing significance to the traded price of BTC and so this script calculates the respective volume and price of the major exchanges to more accurately represent the difference between the markets spot price and the markets perpetual future/swap price. Spot references: Coinbase Bitfinex Binance Bitstamp FTX OKex Huobi Bybit Perp references: Bitfinex Binance FTX OKex Huobi Bybit Deribit There are options in the settings to use either basis point scaling or %, though the color bracketing is set to basis points by default. Users can change the candle close resolution to see a larger/smaller time frame data set. An important feature is the ability to filter the barcolor on the chart to filter only for basis increase or decrease depending on the influence of spot buying or selling. As of publishing, the barcoloring is set to only display when you're on a common BTC spot or BTC perp chart. This is to avoid confusion. ThanksPine Script® indicatorby IntromotoUpdated 6
VMC Oracle This is Oracle. It is a momentum driven indicator with behind-the-scenes filters designed to best indicate the oversold and overbought points on most assets. Oracle partially uses a regression equation displayed in line format with a predetermined spacing to indicate different support and resistance points within the last 100 bars. When used in combination with the smoothed oscillator and moving averages it becomes a powerful tool in your box. It is important to keep in mind that because this indicator is always looking at the last 100 bars the user will need to use the “replay” function on Tradingview for the best manual back-testing to the triggers as possible. It should become clear that when its in the red zone above the ‘zero’ line that the potential for downward movement is greater. The bottom or below ‘zero’ green zone indicates a potential time to buy. In addition to the regression lines, the indicator is supplied with a basic moving average application involving cross analysis. The two lines in cooperation help the user determine when the overall trend is shifting. As an example, when the overall trend may be indicating a bearish market or downtrend it may be beneficial to consider any of Oracle’s triggers that may be opposite more closely. Some of the alerts will trigger in what appears to be opposite trending areas such as a buy trigger when the averages indicate a bearish period. When this happens, it is up to the user utilize other confirmation type tools to assist in the decision of the oracle triggers. The reason for this is that Oracle is designed to predict the change in the market before or during a peak or through area on the graph. The success can be large but this can reduce the automatic trigger’s success in which loss management must be executed. The custom alert function built in is designed to automate the visual comparisons of the two items above. By considering trend, immediate resistance and support lines, and momentum we can help visually indicate the points of possible exhaustion in either direction. When setting up the alert it's as simple as a new alert creation and selecting the VMC Oracle Indicator in the top drop down. After that its as simple as selecting Long Alert or Short alert. As with any tool it is recommended to understand the asset being traded and providing yourself with the best risk management rules to minimize unfavorable movements. Pine Script® indicatorby vumanchu1414686
.b pin-up symbolWhen trading cryptocoins, it is necessary to check the price trend of NASDAQ, BTC.D, BTC.OI, BTC spot or other coins of similar groups. However it is very cumbersome to put a comparison symbol in the Tradingview chart and combine individual indicators one by one. Moreover even with such a combination, the chart is messy and visibility is not good. This script was developed as a composite-solution to that situation, and will make you happy. - NQ1!, USTECH100CFD | symbol fixed - BTC.Dominance, BTC.OpenInterest, BTC symbol, others pin-up-symbol | selectable - Pin-up-symbol | selectable - Pin-up-symbol's candle chart - Trending * EMA 9,21,50,200 ribbon classic EMA * .b price line ; .b price = unique trending price with price-action + relative-volume-action + ATR * Dynamic S/R Cloud ; BB + donchian band + high/low + atr mixed custom-logic * VWWMA + .b price Shadow ; Volume-weighted WMA on .b price = unique MA faster than classic VWMA Trending shadow direction is not bad even on low-timeframe (1, 2, 3, 5m, 15m...) - Pattern * Harmonic Pattern ; A simplified version of the harmonic pattern indicator, simply show-up pattern complete position for reference only - adopted from HeWhoMustNotBeNamed's script. - Information Panel * BTC Dominance, BTC Open Interest, Pin-Up-Symbol price * Trend meter ; 5,15,30,1h,2h,4h Meter Calc with 1 minute-timeframe candles 5 = Green if the current price is higher than the price 5 minutes ago. 1h = Green if the current price is higher than the price 2 hours ago. 4h = Red if the current price is lower than the price 4 hours ago. * caution ; To use real-time chart of "CME_MINI:NQ1!" you have to additional subscribe CME data, default setting is 'NQ1!' , you can change to 'USTECH100CFD' * When you choose symbol which is closed trading hours, the script's update stopped. Even if the selected pin-up-symbol is on trading hours, the currently selected symbol's chart doesn't update. * recommended | chart setting > Appearance : Top margin 0%, Bottom margin 0% for optimized screen usage :) if you have any questions freely contact to me by message on tradingview, or telegram @sr_bt but please understand that responses may be quite late. ------------------------------------------------------------------------------------------------------------------------------------------------------------ copyright 2022 (sr_b) Special thanks to all of contributors of community. The script (originaly .b) may be freely distributed under the MIT license. The other classic script code also may be freely distributed under the MIT license. Simplified Harmonic script part | core adopted from 'Multi ZigZag Harmonic Patterns (HeWhoMustNotBeNamed)' MPL2.0 licensePine Script® indicatorby sr_bUpdated 77161
.b BTC-Exchange volumeBINANCE:BTCUSDT It's tool to check exchange trading status. You can see "BTC-exchange's realtime trading volume, previous closed volume" at once. You can switch to see 'Previous close volume' on script's panel. Timeframe recommended ; 15m, 1H, 4H, D, W, whatever. Each exchange may have a different volume display unit, so I converted it into roughly BTC units. (using hl2 price) This indicator aims to recognize the difference in the trading volume of the exchange at once. It's not for the purpose of check the exact trading volume. All data come from tradingview. The comparison target exchanges refer to the ranking of CoinMarketCap. if you have any questions freely contact to me by message on tradingview, or telegram @sr_bt but please understand that responses may be quite late.Pine Script® indicatorby sr_bUpdated 2258
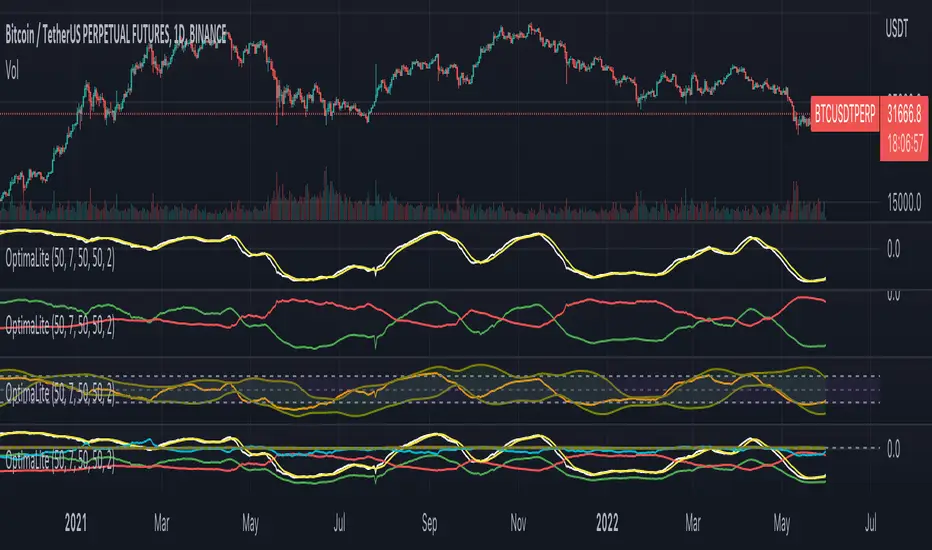
OptimaLiteThe OptimaLite algorithm performs the calculation of the integrated profits and losses for all the buyers and sellers that they have for the given “Calculation period” back in history for every time point. The idea is based on the principle of the accumulation and distribution of the capital among the market participants leading to the price trend change. The indicator consists of the several components (signal lines): 1) “Return” – the main signal that reflects the integrated profits and losses delta (the “Return” moving average is added) 2) “Profit” and “Loss” – integrated profits and losses correspondingly 3) “Return Normalized” – the normalized “Return” for a given period of time 4) “Return High Frequency” – the “Return” signal compensated with the short-term fluctuations by RSI How to use the indicator: – Highs and lows of the indicator are associated with the overbought and oversold conditions points correspondingly. – Crosses of the moving average with the main indicator line are associated with the trend change – Divergencies between the indicator and price highs or lows can be used as signals for the trend reversal – “Profit” and “Loss” signal lines intersections indicate the bulls/bears take over the market Adjustments: The periods of the calculation, averaging and normalization are the main parameters that could be tuned in order to optimize the indicator performance. Generally, the default values are sufficient for the nominal performance thought. But the best combination of those parameters is specific for each asset and timeframe, so it recommended to optimize them.Pine Script® indicatorby Crypto-HamsterUpdated 90
Volatility Calculator for Daily Top and Bottom RangeWith the usage of ATR, applied on the close of the daily candle, I am calculated the volatility channels for the TOP and BOTTOM Based on this logic, we can estimate, with a huge confidence factor, where the prices are going to be compressed for the trading day. Having said that, lets take a look at the data gathered among the most important financial markets: SPX TOP CROSSES : 2116 BOT CROSSES : 1954 Total Daily Candles : 18908 Occurance ratio = 0.215 NDX TOP CROSSES : 1212 BOT CROSSES : 1183 Total Daily Candles : 9386 Occurance ratio = 0.255 DIA TOP CROSSES : 759 BOT CROSSES : 769 Total Daily Candles : 6109 Occurance ratio = 0.25 DXY TOP CROSSES : 1597 BOT CROSSES : 1598 Total Daily Candles : 13156 Occurance ratio = 0.243 DAX TOP CROSSES : 1878 BOT CROSSES : 1848 Total Daily Candles : 13155 Occurance ratio = 0.283 BTC USD TOP CROSSES : 416 BOT CROSSES : 417 Total Daily Candles : 4290 Occurance ratio = 0.194 ETH USD TOP CROSSES : 247 BOT CROSSES : 268 Total Daily Candles : 2452 Occurance ratio = 0.21 EUR USD TOP CROSSES : 820 BOT CROSSES : 805 Total Daily Candles : 7489 Occurance ratio = 0.217 GOLD TOP CROSSES : 1722 BOT CROSSES : 1569 Total Daily Candles : 13747 Occurance ratio = 0.239 USOIL TOP CROSSES : 1077 BOT CROSSES : 1089 Total Daily Candles : 10231 Occurance ratio = 0.212 US 10Y TOP CROSSES : 1302 BOT CROSSES : 1365 Total Daily Candles : 9075 Occurance ratio = 0.294 Based on this, we can assume with a very high confidence ( 70-80%) that the market is going to stay, within the range created from the BOT and TOP ATR points. Pine Script® indicatorby exlux4476
Candle Colored by Volume Z-score [Morty]This indicator colors the candles according to the z-score of the trading volume. You can easily see the imbalance on the chart. You can use it at any timeframe. In statistics, the standard score (Z-score) is the number of standard deviations by which the value of a raw score (i.e., an observed value or data point) is above or below the mean value of what is being observed or measured. Raw scores above the mean have positive standard scores, while those below the mean have negative standard scores. This script uses trading volume as source of z-score by default. Due to the lack of volume data for some index tickers, you can also choose candle body size as source of z-score. features: - custom source of z-score - volume - candle body size - any of above two - all of above two - custom threshold of z-score - custom color chemes - custom chart type - alerts default color schemes: - green -> excheme bullish imbalance - blue -> large bullish imbalance - red -> excheme bearish imbalance - purple -> large bearish imbalance - yellow -> low volume bars, indicates "balance", after which volatility usually increases and tends to continue the previous trend Examples: * Personally, I use dark theme and changed the candle colors to black/white for down/up. Volume as Z-score source Any as Z-score source, more imbalances are showed Pine Script® indicatorby M0rtyUpdated 1212 2.3 K
COT Report Crypto█ OVERVIEW Showing the Commitments of Traders (COT) report(*) for Crypto contract Open Interest and Traders - CHICAGO MERCANTILE EXCHANGE (futures only) with COT charts on TradingView data. * COT reports are released each Friday (except for U.S. holidays) by the CFTC. * Each COT report release includes data from the previous Tuesday. * Original data is www.cftc.gov Data currently displayed are through April 12, 2022 █ FEATURES You can switch the display for each of the following CFTC Ticker : BITCOIN www.cmegroup.com MICRO BITCOIN www.cmegroup.com ETHER CASH SETTLED www.cmegroup.com *MICRO ETHER www.cmegroup.com is currently not supported by TradingView at April 2022 You can switch the display for each of the following Positions : Long Short Net *Net Position limits the Chart Format that can be displayed You can switch the display for each of the following Target : Open Interest Traders You can switch the display for each of the following Categories : Dealer Asset manager Leverage funds Other reportable Non reportable *Non reportable has no Traders data You can switch the display for each of the following Chart Format : Normal Line Stacked Column Indexed Column Difference StepLine *Net Position can be displayed only for Normal Line And, convert contract unit to coin unit is available. BITCOIN/MICRO BITCOIN is converted to BTC and ETHER CASH SETTLED/MICRO ETHER is converted to ETH. Then, percent by ALL data is available. This Option use Open Interest(ALL) or Traders Total(ALL) by Target. Info Display shows coin unit converts info and reason that cannot display a chart. Of course, this display position and size are changeable. █ HOW TO USE IT This indicator allows you to see changes in each category within TradingView without having to refer directly to each report. In addition, it provides a detailed means of analysis by offering Traders as well as Open Interest and a variety of visualization methods.Pine Script® indicatorby nino_tradeUpdated 1118
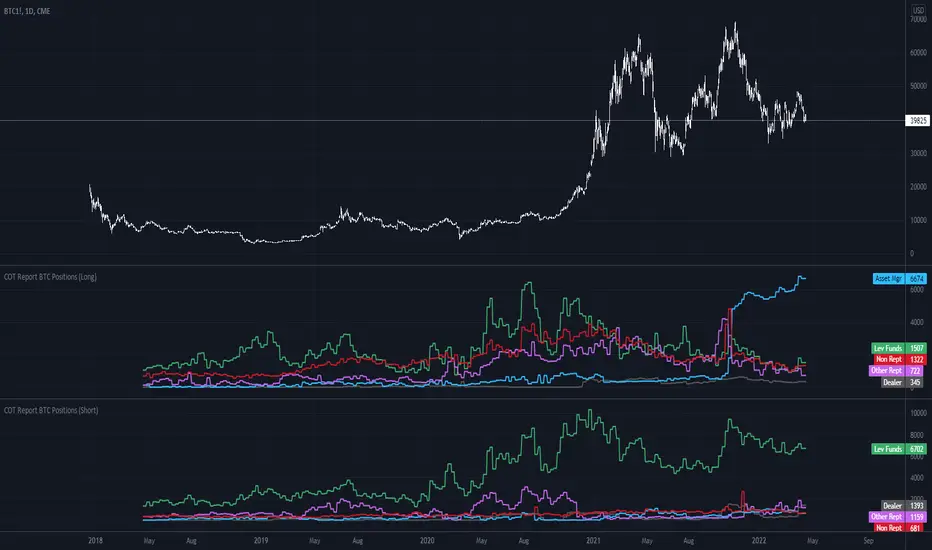
COT Report BTC Positions█ OVERVIEW Showing the Commitments of Traders (COT) report(*) for BITCOIN Positions - CHICAGO MERCANTILE EXCHANGE (futures only) with COT charts on TradingView data. * COT reports are released each Friday (except for U.S. holidays) by the CFTC. * Each COT report release includes data from the previous Tuesday. * Original data is www.cftc.gov Data currently displayed are through April 12, 2022 █ FEATURES You can switch the display for each of the following Positions : Long Short You can switch the display for each of the following Categories : Dealer Asset manager Leverage funds Other reportable Non reportable █ HOW TO USE IT This indicator allows you to see changes for each category within TradingView without having to refer directly to each report.Pine Script® indicatorby nino_tradeUpdated 77345
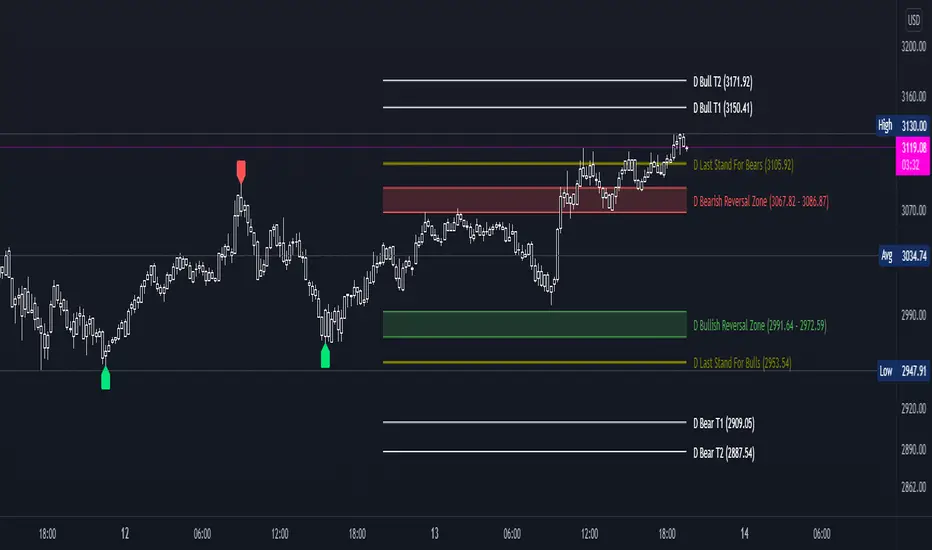
DDG PivotsDDG Pivots is an indicator that autonomously plots current reversal zones, areas of possible pivotal points for intraday trading, price targets, and true lows/highs. This indicator will identify FINAL pivots (H/L) accurately, plotting either a green or red label to identify true lows/highs. Once you are able to determine possible reversal areas and pivotal points, you will have a better idea on the current trend and whether these areas are respected/denied, after you can identify the correct trend, this indicator will then help by projecting predicted price targets on screen. From entry to exit, this indicator helps ease your stress trading. STOP STARING HOPELESSLY AT YOUR SCREEN, THIS INDICATOR HAS PUSH ALERTS FOR EACH OF THESE VITAL LEVLS. *Turn on PUSH NOTIFICATIONS to alert you when these vital areas are touched*Pine Script® indicatorby cswxg18
Macro EMA Correlation This script is useful to see correlation between macroeconomic assets, displayed in different ema line shown in percentage to compare these assets on the same basis. Percentage will depend on the time frame selection. In the higher timeframe you will see higher variation and in small timeframe smaller variation. You can select the timeframe who suit your trading style. The 1h and 4h fit well for longer trend swing trade and the lower time frame 15m, 5m, 1m are good for scalping or daily trading. The following asset are available: Bitcoin Ethereum Gold Crypto total market cap excluding bitcoin (total2) United state 10-year government bond (US10Y) Usdt dominance show the concentration of usdt hold. For example, when trader are fearful they sell their crypto position to keep more usdt in their portfolio (USDT.D) The USD/JPY pair the dollar usd versus the Japanese Yen one of the most forex traded pair. You can clic on parameter to select the asset you want to analyse. The main correlation observed are: bitcoin negatively correlated with the usdt dominance. bitcoin negatively correlated with the usd/jpy pair bitcoin is positively correlated to eth, total2 (altcoin) bitcoin positively correlated with gold bitcoin is mostly negatively correlated to us10y The basis of correlation is that positively correlated asset goes in the same direction and that the negatively correlated goes in opposite direction. So, the idea is to use these information to see trend reversing. Example 1: when bitcoin and usdt dominance are extended in opposite direction we look for a possible retracement toward 1% wich is the middle base. Example 2 : when bitcoin make a move we look for ethereum and total 2 to follow Pine Script® indicatorby F_rank_0174
Aggregated Volume Based Coloured Bars - InFinitoModified version of Kivanc's Volume Based Colored Bars that colors the bars with Aggregated Volume Data. Aggregation code originally from Crypt0rus ***The indicator can be used for any coin/symbol to aggregate volume , but it has to be set up manually*** ***The indicator can be used with specific symbol data only by disabling the aggregation option, which allows for it to be used on any symbol*** - Calculated based on Aggregated Volume instead of by symbol volume . Using aggregated data makes it more accurate and allows to see if the move was supported (Volume-wise) in all exchanges. - As well, in order to make the data as accurate as possible, the data from each exchange aggregated is normalized to report always in terms of 1 BTC . In case this indicator is used for another symbol, the calculations can be adjusted manually to make it always report data in terms of 1 contract/coin.Pine Script® indicatorby In_Finito_Updated 9964
FieryTrading Long-Term Bitcoin Investor ToolDear community, Today I want to present you one of my favorite scripts for long-term Bitcoin trading. I'm publishing this script because I think it will help traders to become more profitable in the long-term. Consequently, this script is targeted at long-term investors only, since it can take years before the price goes from the green area to the red area. To use this script correctly you will need to use the BTCUSD index from Tradingview. Search "Bitcoin Index" in your symbol search bar, top result. Use daily candles on a logarithmic scale. This scripts consists of two price bands, green and red. The green band has historically been a great area for the accumulation of BTC, whilst the red area has historically been a great area for exiting BTC. You could say that if the price is in (or below) the green bands BTC is undervalued, with the opposite being true for the red bands. If you wish to add alerts to this script, simply click on the alert button > condition=Fierytrading BTC Tool. You can add alerts when the price enters the green area (Buy Area Cross) or red area (Sell Area Cross). This simple script has historically proven to be very efficient at identifying bottoms (accumulation) and tops (distribution). Be aware that the usability of this script is not guaranteed in the future.Pine Script® indicatorby FieryTrading66270
DashBoard Alt Season by KziHere is a Dashboard to have an overview of the Alt Season oportunity. Multiple time frame (Month / Week / Daily /4H) How to use it? You have 4 columns TOTAL Crypto / Btc dominance / Btc Price / Alt ? The alt? column is the resulte of the price and dominance of btc + 1 point with the total crypto BTC Dominance UP ? Yes = Négatif for ALTS /// Btc Price UP ?= > Yes = Positif for ALTS NO = super négatif for ALTS No = Positif for ALTS /// Btc Price UP ?= > Yes = super Positif for ALTS NO = Neutral The total market just smooth the total. If Alt columm is Green= It's OK If Alt columm is orange = carrefull If Alt Columm is red = leave the alt You have to considered that you look on the time frame where you want to trade. The overtime frame help to understand the bigger view. Hop you like it and give comment to help the évolutions. Pine Script® indicatorby Cazimiro134
MicroStrategy MetricsA script showing all the key MSTR metrics. I will update the script every time degen Saylor sells some more office furniture to buy BTC. All based around valuing MSTR, aside from its BTC holdings. I.e. the true market cap = enterprise value - BTC holdings. Hence, you're left with the value of the software business + any premium/discount decided by investors. From this we can derive: - BTC Holdings % of enterprise value - Correlation to BTC (in this case we use CME futures...may change this) - Equivalent Share Price (true market cap divided by shares outstanding) - P/E Ratio (equivalent share price divided by quarterly EPS estimates x 4) - Price to FCF Ratio (true market cap divided by FCF (ttm)) - Price to Revenue (^ but with total revenue (ttm))Pine Script® indicatorby Pinnacle_InvestorUpdated 5561
TrendTracers Bitcoin Stock to Flow ModelFor the best results, make sure to view this indicator on a bitcoin chart with a very long history (e.g. BNC:BLX)! This model treats Bitcoin as being comparable to commodities such as gold, silver or platinum. These are known as ‘store of value’ commodities because they retain value over long time frames due to their relative scarcity. It is difficult to significantly increase their supply i.e. the process of searching for gold and then mining it is expensive and takes time. Bitcoin is similar because it is also scarce. In fact, it is the first-ever scarce digital object to exist. There are a limited number of coins in existence and it will take a lot of electricity and computing effort to mine the remaining coins still to be mined, therefore the supply rate is consistently low. The stock-to-flow model predicts value changes in a straightforward manner. It compares an asset’s current stock to the rate of new production, or how much is produced in a year. Calculation: Take bitcoin production in a period, divide it by that period and then multiply by 365 to get the estimated yearly production and then calculate the stock to flow. yearlyFlow = ((stockChange) / period ) * 365 stockToFlow = (stock - missingBitcoins) / yearlyFlow Model Value = -1.84ᵉ * stockToFlow³.³⁶ (mathematical model to calculate the model price) For more information about the calculations followed: stats.buybitcoinworldwide.com Features: Works on the Daily, Weekly and Monthly Timeframe. Allows you to adjust between a 10-day period and a 463-day period. Has the option to account for missing bitcoins, lets you adjust the amount of missing bitcoins. The ability to toggle a standard deviation of the Model Value with a multiplier of 1, 2 or 3 Displays a Stock to Flow Deviation Ratio: If the Deviation Ratio is close to 0 it means the price of Bitcoin is close to the Model Value Line(or Stock to Flow Ratio). If the Deviation Ratio is close to 1 or -1, it means the price of bitcoin is near the selected deviation levels. You can toggle between the Overlay version and the Oscillator version, default is on Oscillator version. If you want to switch: Untick Oscillator mode in the indicator settings, click on the three dots and select "move to existing pane above". Then click on the three dots again and select Pin to scale A. Done! As a bonus: Now you can toggle a "1-year Realized Price" graph, while it's not officially part of the Stock to Flow Model it does share similar technicals about supply and scarcity. The 1-year Realized Price is the realized market cap divided by total amount of generated coins. I just noticed that, while the color gradient function is pretty cool, it does not allow for end users to customize their colors after applying this indicator to their chart. Sorry!Pine Script® indicatorby dab1rd1165