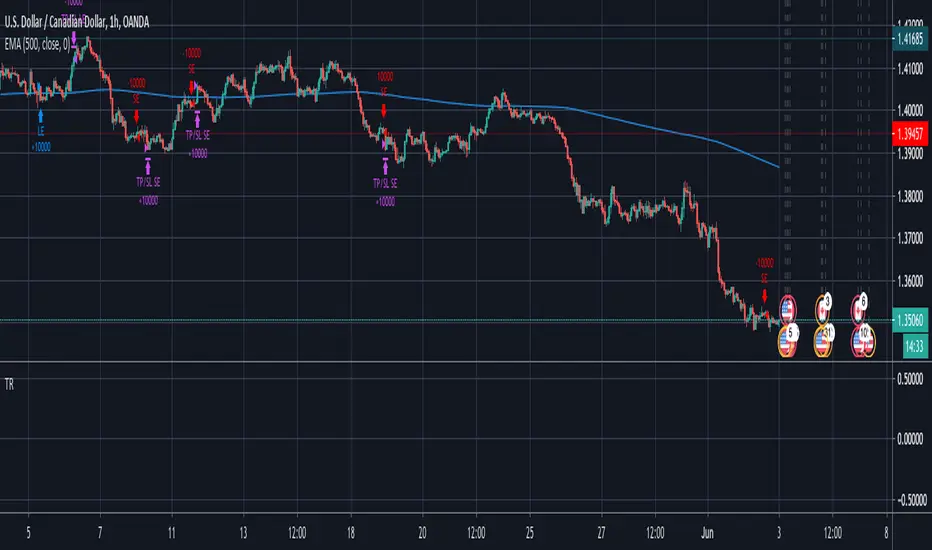
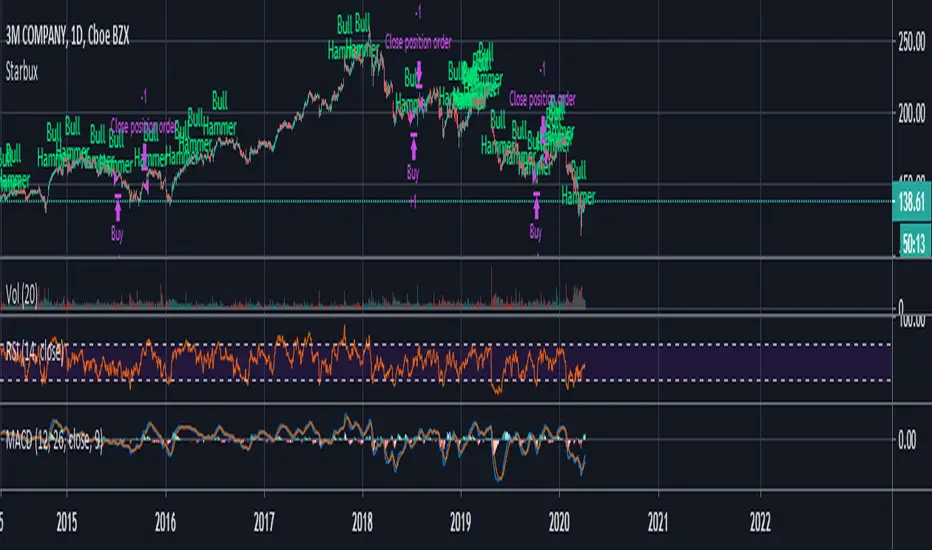
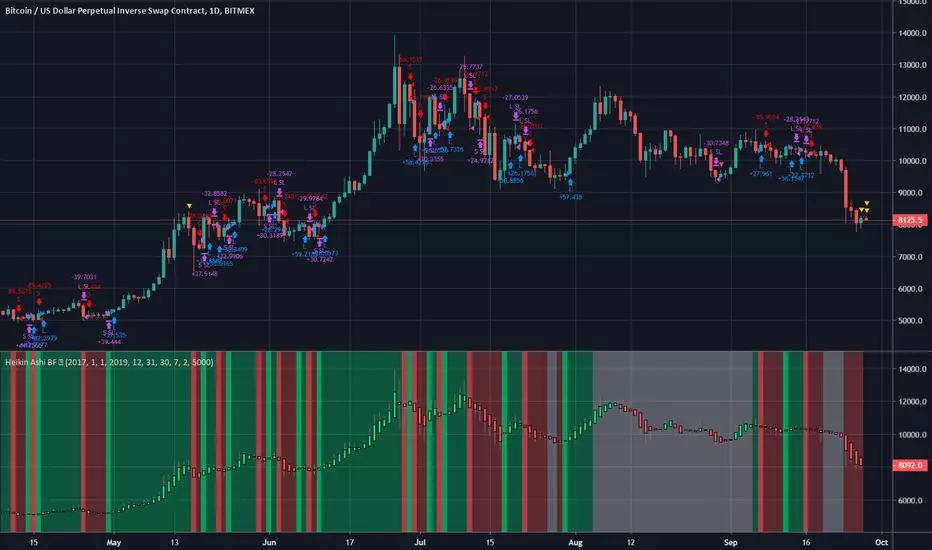
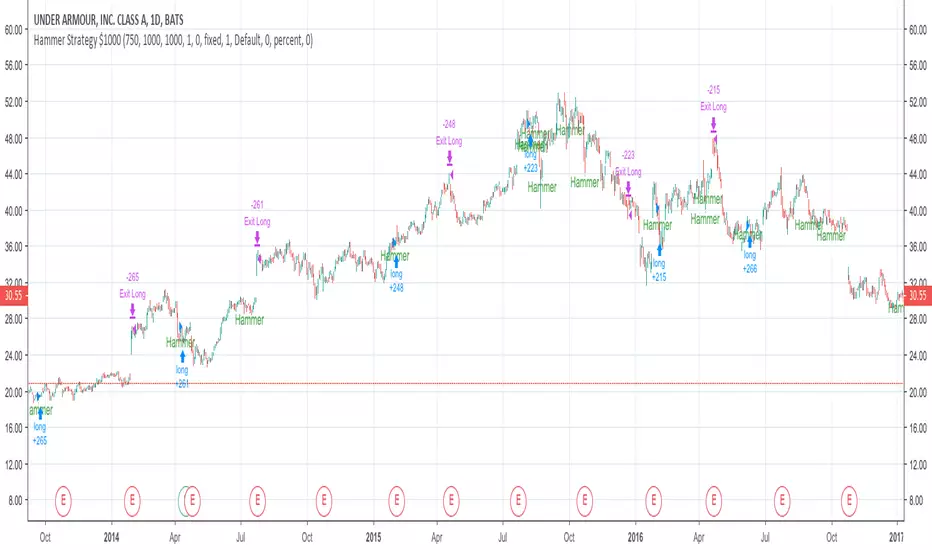
StarbuxI made this in starbucks .
Bullish hammer trading signal algorithm
using MACD for trend determination and holding period.
Candlestick Analysis
BEST Engulfing + Breakout StrategyHello traders
This is a simple algorithm for a Tradingview strategy tracking a convergence of 2 unrelated indicators.
Convergence is the solution to my trading problems.
It's a puzzle with infinite possibilities and only a few working combinations.
Here's one that I like
- Engulfing pattern
- Price vs Moving average for detecting a breakout
Definition
Take out the notebooks :) and some coffee (good for focus). I'm bullish in coffee
The engulfing pattern is a two-candle reversal pattern.
The second candle completely ‘engulfs’ the real body of the first one, without regard to the length of the tail shadows.
The bullish Engulfing pattern appears in a downtrend and is a combination of one red candle followed by a larger green candle
The bearish Engulfing pattern appears in a downtrend and is a combination of one green candle followed by a larger red candle
Example: imgur.com
We're bored sir... what's the point of all this?
In summary, an engulfing is a pattern to track reversals. (the whole TradingView audience stands up now giving a standing ovation)
Adding the Price vs Moving average filters allows to track reversals with momentums (half of the audience collapsed because this is too awesome)
Ok sir... you picked up my interest
I included some cool backtest filters:
- date range filtering
- flexible take profit in USD value (plotted in blue)
- flexible stop loss in USD value (plotted in red)
All the best
Dave
Strategy Test - Cancel Limit Order and Position SizingWhile working thru another project had the need to troubleshoot the canceling of a limit order syntax/process as well as work thru the code and logic to automagically set the position sizing based off two user inputs (Amount to Risk in USD and Leverage to Use) and the potential entry and stop levels for an inside bar candle pattern in this scenario. Once we find the distance between the entry and stop level we can figure out the stop percentage amount which matches up with what a user would see manually drawing using the long or short tool in tradingview. Once we have the user inputs and levels we can get an amount to be used in later qty= type of places in zeeee pine script....
Noro's BottomSensivity v0.6 strategy + rsi + AlarmThe original indicator is Noro's BottomSensivity v0.6
I simply turned noro's bottom sensibility 6.0 indicator, which I consider a great tool to find market bottom, into a strategy.
I also added an additional RSI filter with inputs that can be set by the user for entry and exit from the market.
I have tried to insert an alarm so that I can be notified when this particular purchase condition is formed.
I also tried to insert an additional filter that would allow me to make further pyramid purchases only after a certain percentage of drawdown from the first entry so as to reduce the average purchase price but I was not able ... if someone could implement this I would appreciate it.
Well..this is the first time that I try to program / modify a strategy / indicator, there are certainly some gross errors (as in my English too), please forgive me, I will appreciate the corrections that more experienced users will want to make.
I wish you all a good day, pfjons
Heiken Ashi BF Heiken Ashi candles help us to identify a trend.
This strategy simply enters a long when the Heiken Ashi candles turn green and a short when they turn red.
Because of the way BTC price moves in medium term trends, this simple strategy seems effective.
There is a rate of change function applied to avoid some of the choppy sideways action (thanks again to kiasaki for the code)
There is a 2% fixed stop loss applied and an optional take-profit setting. You can change both in the settings.
As you can see from the code, this strategy does not enter trades based on the Heiken Ashi closes, rather the actual price close. This is an important distinction since the HA closes are based on an average of the OHLC values so attempting to enter at that price may not always be possible. There are some "strategies" that use this information to try and con people by appearing to have awesome entries that are actually not attainable in all cases.
Green = Long
Red = Short
White = No trade
Candle Patterns StrategyThe script allows you to test popular candlestick patterns on various instruments and timeframes. In addition, you can configure risk management (if the value is zero, it means the function is disabled), and you can also specify the time of the trading session (for example, so that the positions are not transferred to the next day).
The author is grateful to JayRogers and Phi35, their code examples helped a lot in writing the strategy.
Renko Plot StrategyThis strategy lets you plot Renko open and close values, based on your preferred Renko size brick, on normal candle chart. You can use it on any timeframe, define your preferred brick size and trailing stop.
Three Outside Up Backtest This is a three candlestick bullish reversal pattern consisting of a bullish
engulfing pattern formed by the first two candlesticks then followed by an up
candlestick with a higher close than the prior candlestick.
WARNING:
- For purpose educate only
- This script to change bars colors.
Three Outside Down Backtest This is a three candlestick bearish reversal pattern consisting of a bearish
engulfing pattern formed by the first two candlesticks then followed by a down
candlestick with a lower close than the prior candlestick.
WARNING:
- For purpose educate only
- This script to change bars colors.
Three Inside Up Backtest This is a three candlestick bullish reversal pattern consisting of a
bullish harami pattern formed by the first 2 candlesticks then followed
by up candlestick with a higher close than the prior candlestick.
WARNING:
- For purpose educate only
- This script to change bars colors.
Three Inside Down Backtest This is a three candlestick bearish reversal pattern consisting of a bearish
harami pattern formed by the first 2 candlesticks then followed by down
candlestick with a lower close than the prior candlestick.
WARNING:
- For purpose educate only
- This script to change bars colors.
Basic Hammer StrategyThis is a basic strategy that will buy after a hammer is printed, and sell when a predetermined risk or reward price is hit. You can change the risk and reward values in the settings. Risk and reward values are in increments of $0.01. Default values are 75 ($0.75) and 200 ($2.00). If the strategy is producing losses, try adding a zero to the end of the risk value and the reward value. Example: Higher valued stocks may do better with a Risk of 750 ($7.50) and a Reward of 2000 ($20.00). Maybe even a Risk of 750 ($7.50) and reward of 1000 ($10.00). Play around with these values to get the best result for different charts. Initial investment is set to $1000
Doji Backtest This is a candlestick where the open and close are the same.
WARNING:
- For purpose educate only
- This script to change bars colors.
Dark Cloud Backtest This is a bearish reversal pattern formed by two candlesticks within a uptrend.
Consists of an up candlestick followed by a down candlestick which opens lower
than the prior candlestick and closes below the midrange of the prior candlestick.
It is the reverse of the Piercing Line.
WARNING:
- For purpose educate only
- This script to change bars colors.
Open Close Cross Strategy // Real Back Test // Not goodI changed close series because, close series doing repaint.
I changed the near series with the previous open series .
but can use for sup and resistance
Bullish Harami Backtest This is a bullish reversal pattern formed by two candlesticks in which a small
real body is contained within the prior session's unusually large real body.
Usually the second real body is the opposite color of the first real body.
The Harami pattern is the reverse of the Engulfing pattern.
WARNING:
- For purpose educate only
- This script to change bars colors.
Bearish Harami Backtest This is a bearish reversal pattern formed by two candlesticks in which a short
real body is contained within the prior session's long real body. Usually the
second real body is the opposite color of the first real body. The Harami pattern
is the reverse of the Engulfing pattern.
WARNING:
- For purpose educate only
- This script to change bars colors.
Inside Bar FailureYou can check edge profitability by adjusting the forward looking input, eg. how profitable is this signal after X bars.