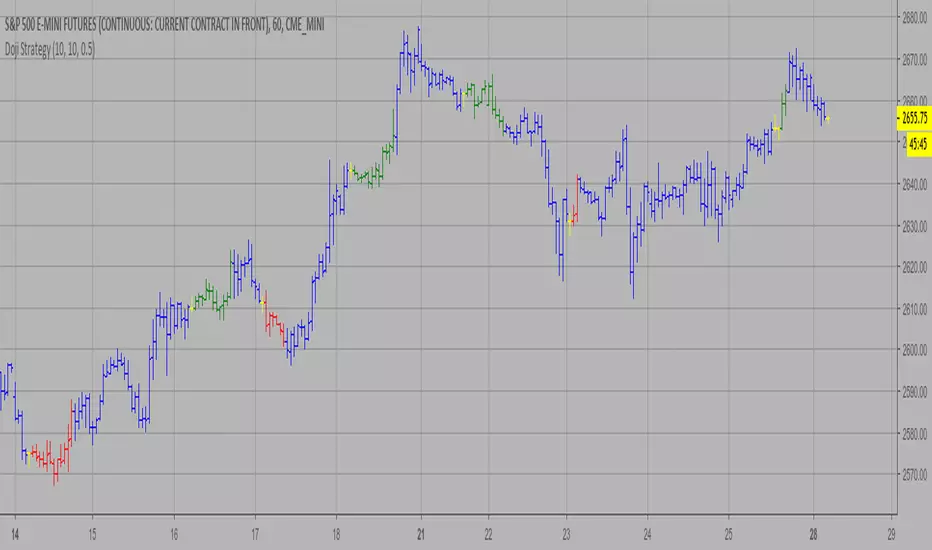
Doji Strategy This is a candlestick where the open and close are the same.
WARNING:
- This script to change bars colors.
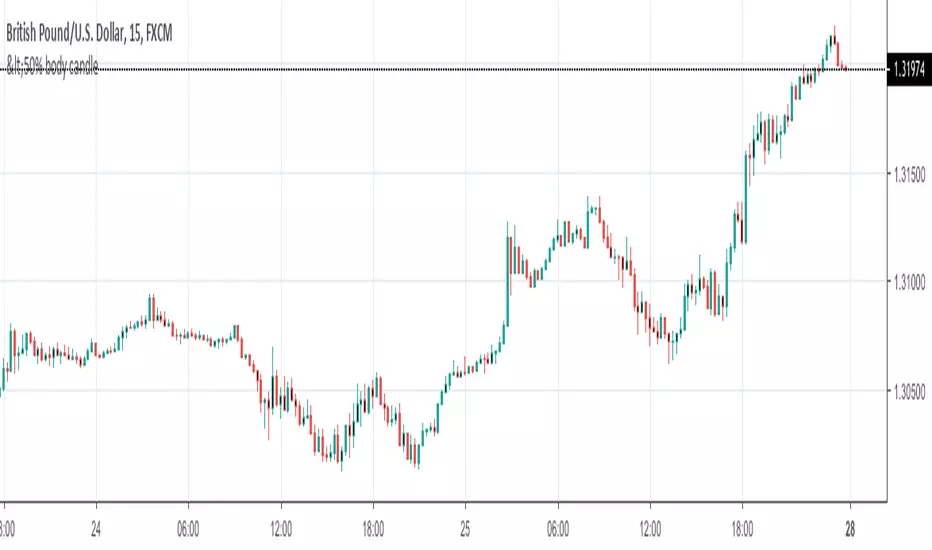
Candlestick Analysis
<50% body candleThis Script shows the candle whose body is less than the full candle and is shown in black color
Kawabunga Swing Failure Points Candles (SFP) by RRBKawabunga Swing Failure Points Candles (SFP) by RagingRocketBull 2019
Version 1.0
This indicator shows Swing Failure Points (SFP) and Swing Confirmation Points (SCP) as candles on a chart.
SFP/SCP candles are used by traders as signals for trend confirmation/possible reversal.
The signal is stronger on a higher volume/larger candle size.
A Swing Failure Point (SFP) candle is used to spot a reversal:
- up trend SFP is a failure to close above prev high after making a new higher high => implies reversal down
- down trend SFP is a failure to close below prev low after making a new lower low => implies reversal up
A Swing Confirmation Point (SCP) candle is just the opposite and is used to confirm the current trend:
- up trend SCP is a successful close above prev high after making a new higher high => confirms the trend and implies continuation up
- down trend SCP is a successful close below prev low after making a new lower low => confirms the trend and implies continuation down
Features:
- uses fractal pivots with optional filter
- show/hide SFP/SCP candles, pivots, zigzag, last min/max pivot bands
- dim lag zones/hide false signals introduced by lagging fractals or
- use unconfirmed pivots to eliminate fractal lag/false signals. 2 modes: fractals 1,1 and highest/lowest
- filter only SFP/SCP candles confirmed with volume/candle size
- SFP/SCP candles color highlighting, dim non-important bars
Usage:
- adjust fractal settings to get pivots that best match your data (lower values => more frequent pivots. 0,0 - each candle is a pivot)
- use one of the unconfirmed pivot modes to eliminate false signals or just ignore all signals in the gray lag zones
- optionally filter only SFP/SCP candles with large volume/candle size (volume % change relative to prev bar, abs candle body size value)
- up/down trend SCP (lime/fuchsia) => continuation up/down; up/down trend SFP (orange/aqua) => possible reversal down/up. lime/aqua => up; fuchsia/orange => down.
- when in doubt use show/hide pivots/unconfirmed pivots, min/max pivot bands to see which prev pivot and min/max value were used in comparisons to generate a signal on the following candle.
- disable offset to check on which bar the signal was generated
Notes:
Fractal Pivots:
- SFP/SCP candles depend on fractal pivots, you will get different signals with different pivot settings. Usually 4,4 or 2,2 settings are used to produce fractal pivots, but you can try custom values that fit your data best.
- fractal pivots are a mixed series of highs and lows in no particular order. Pivots must be filtered to produce a proper zigzag where ideally a high is followed by a low and another high in orderly fashion.
Fractal Lag/False Signals:
- only past fractal pivots can be processed on the current bar introducing a lag, therefore, pivots and min/max pivot bands are shown with offset=-rightBars to match their target bars. For unconfirmed pivots an offset=-1 is used with a lag of just 1 bar.
- new pivot is not a confirmed fractal and "does not exist yet" while the distance between it and the current bar is < rightBars => prev old fractal pivot in the same dir is used for comparisons => gives a false signal for that dir
- to show false signals enable lag zones. SFP/SCP candles in lag zones are false. New pivots will be eventually confirmed, but meanwhile you get a false signal because prev pivot in the same dir was used instead.
- to solve this problem you can either temporary hide false signals or completely eliminate them by using unconfirmed pivots of a smaller degree/lag.
- hiding false signals only works for history and should be used only temporary (left disabled). In realtime/replay mode it disables all signals altogether due to TradingView's bug (barcolor doesn't support negative offsets)
Unconfirmed Pivots:
- you have 2 methods to check for unconfirmed pivots: highest/lowest(rightBars) or fractals(1,1) with a min possible step. The first is essentially fractals(0,0) where each candle is a pivot. Both produce more frequent pivots (weaker signals).
- an unconfirmed pivot is used in comparisons to generate a valid signal only when it is a higher high (> max high) or a lower low (< min low) in the dir of a trend. Confirmed pivots of a higher degree are not affected. Zigzag is not affected.
- you can also manually disable the offset to check on which bar the pivot was confirmed. If the pivot just before an SCP/SFP suddenly jumps ahead of it - prev pivot was used, generating a false signal.
- last max high/min low bands can be used to check which value was used in candle comparison to generate a signal: min(pivot min_low, upivot min_low) and max(pivot max_high, upivot max_high) are used
- in the unconfirmed pivots mode the max high/min low pivot bands partially break because you can't have a variable offset to match the random pos of an unconfirmed pivot (anywhere in 0..rightBars from the current bar) to its target bar.
- in the unconfirmed pivots mode h (green) and l (red) pivots become H and L, and h (lime) and l (fuchsia) are used to show unconfirmed pivots of a smaller degree. Some of them will be confirmed later as H and L pivots of a higher degree.
Pivot Filter:
- pivot filter is used to produce a better looking zigzag. Essentially it keeps only higher highs/lower lows in the trend direction until it changes, skipping:
- after a new high: all subsequent lower highs until a new low
- after a new low: all subsequent higher lows until a new high
- you can't filter out all prev highs/lows to keep just the last min/max pivots of the current swing because they were already confirmed as pivots and you can't delete/change history
- alternatively you could just pick the first high following a low and the first low following a high in a sequence and ignore the rest of the pivots in the same dir, producing a crude looking zigzag where obvious max high/min lows are ignored.
- pivot filter affects SCP/SFP signals because it skips some pivots
- pivot filter is not applied to/not affected by the unconfirmed pivots
- zigzag is affected by pivot filter, but not by the unconfirmed pivots. You can't have both high/low on the same bar in a zigzag. High has priority over Low.
- keep same bar pivots option lets you choose which pivots to keep when there are both high/low pivots on the same bar (both kept by default)
SCP/SFP Filters:
- you can confirm/filter only SCP/SFP signals with volume % change/candle size larger than delta. Higher volume/larger candle means stronger signal.
- technically SCP/SFP is always the first matching candle, but it can be invalidated by the following signal in the opposite dir which in turn can be negated by the next signal.
- show first matching SCP/SFP = true - shows only the first signal candle (and any invalidations that follow) and hides further duplicate signals in the same dir, does not highlight the trend.
- show first matching SCP/SFP = false - produces a sequence of candles with duplicate signals, highlights the whole trend until its dir changes (new pivot).
Good Luck! Feel free to learn from/reuse the code to build your own indicators!

EMA BounceThis indicator will:
signal a GREEN triangle if a candle opens below the EMA and closes above the EMA
signal a RED triangle if the candle opens above the EMA and closes below the EMA
Strategy:
First identify the trend (stick to one timeframe, I use 4h)
If in an UP trend, then go LONG on GREEN triangles, do not trade red triangles as that would be a counter-trend trade (I am placing buy stops at the HIGH of the signal candle)
If in a DOWN trend, then go SHORT on RED triangles, do not trade on green triangles as that would be a counter-trend trade (I am placing sell stops at the LOW of the signal candle)
Default EMA is set to 50, you can change to a higher number for less signals or a lower number for more signal
NOTE: You can set up alerts so that you don't have to watch charts and wait for the signals.
If you find this indicator useful, tips and donations are always appreciated. Venmo @rick-munoz :)

SwingsSwing High and Swing Low as discussed in Bounce Theory
A Swing Low is the low of the candle that has a higher low on either side. A Swing High is the high of the candle that has a lower high on either side.
In the case of Swing High, the high of the neighbour candles are lower than the high of the main candle itself.
In the case of Swing Low, the low of the neighbour candles are higher than the low of the main candle itself.


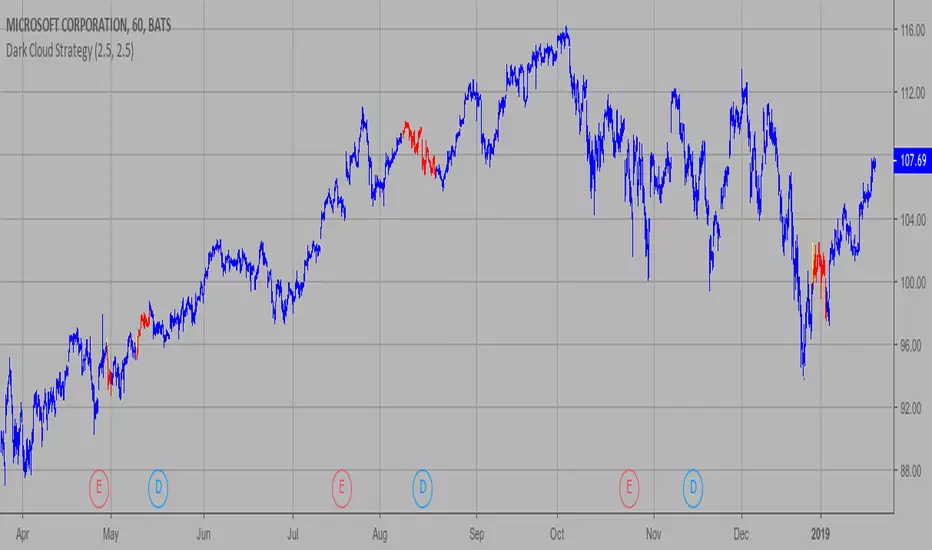
Dark Cloud Strategy This is a bearish reversal pattern formed by two candlesticks within a uptrend.
Consists of an up candlestick followed by a down candlestick which opens lower
than the prior candlestick and closes below the midrange of the prior candlestick.
It is the reverse of the Piercing Line.
WARNING:
- This script to change bars colors.
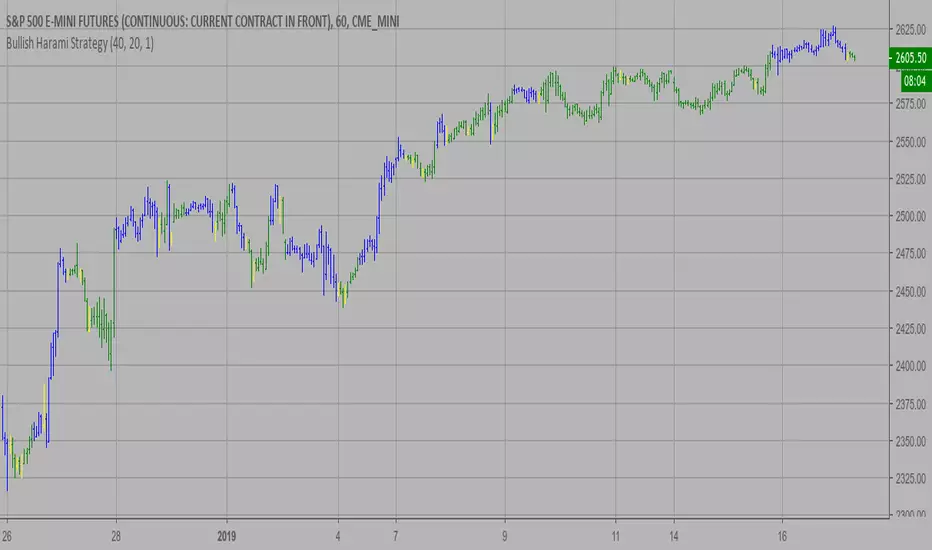
Bullish Harami Strategy This is a bullish reversal pattern formed by two candlesticks in which a small
real body is contained within the prior session's unusually large real body.
Usually the second real body is the opposite color of the first real body.
The Harami pattern is the reverse of the Engulfing pattern.
WARNING:
- This script to change bars colors.
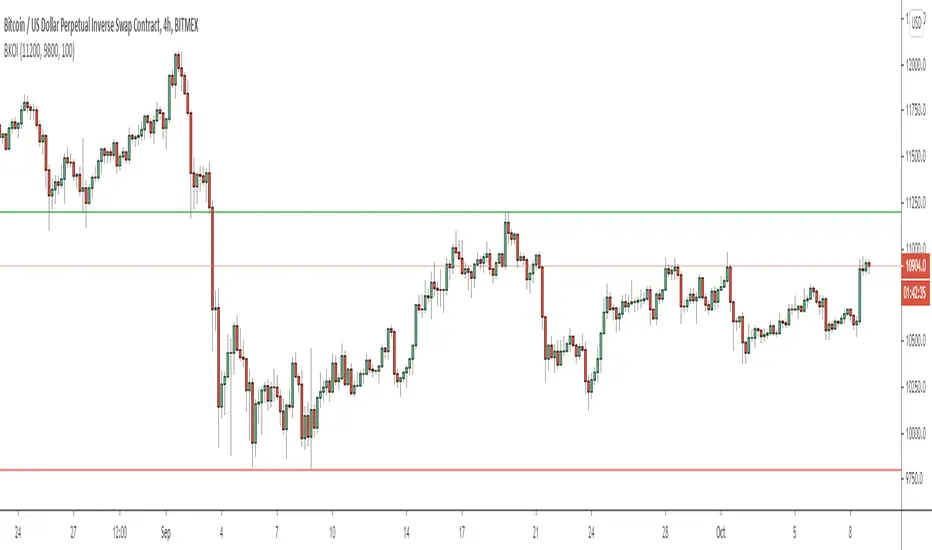
TCG Price Shear PlusThe Chart Guys Price Shear and Abnormal Volume Alerts all rolled into 1 FREE indicator
Based on TCG Price Shear V2 by urisma and Volume Spikes by OstapChester
This powerful script combines Abnormal Volume Alerts with Price Shear which can be based on either ATR or % deviation from an ema, which intern can also be filtered by Abnormal Volume for less false signals.
Look out for my next indicator which will be called TCG Price Shear Plus Scanner which will scan and alert you for several different assets at once!
Enjoy

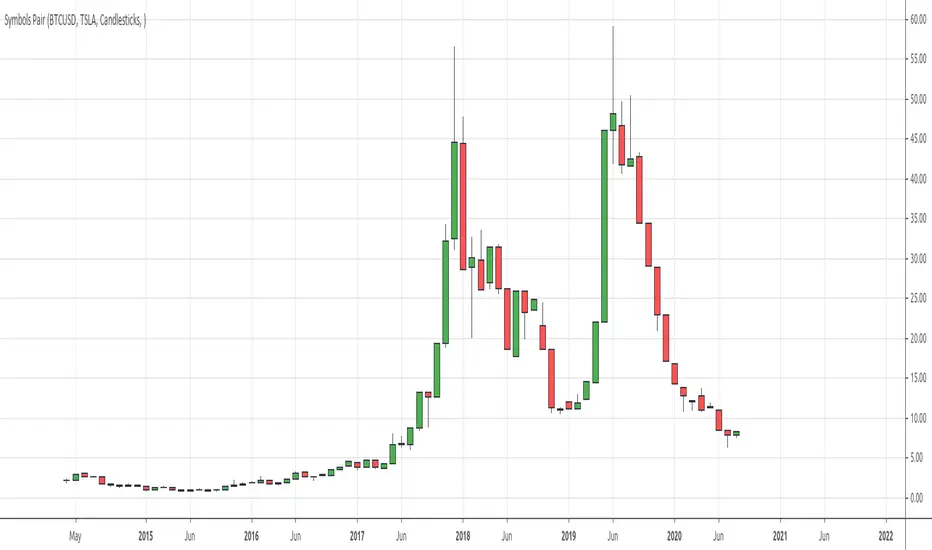
Symbols PairDraws the ratio between two input symbols.
You might find patterns in the ratio.
# Open Source
The code is open source @ github.com and uses the commonpine library github.com
BTC ETH RatioBTCUSD / ETHUSD Ratio.
You might find patterns when to move from BTC to ETH and vice versa.
# Open Source
The code is open source @ github.com and uses the commonpine library github.com

MA CandlesOHLC calculated with a moving average.
You can replace sma with anything. EMA, Hull, sma(sma(sma(sma(close, etc.
You could also make it look clean like Heikin Ashi candlesticks if you include min/max for low/high wicks on candles.

Compare CandlesShows the candles of a specified EXCHANGE:PAIR in an indicator without overlay.
Has the following advantages over the standard comparison in TradingView:
- The compared pair is below your main chart.
- You can see the price of the compared pair.
- You can add multiple compared pairs and all of them will be shown in their own space with their own price.

Breakout IndicatorThis script allows you to set breakout alerts.
An alert will be triggered only when price breaks and closes beyond the specified prices. You will get an alert on the first candle that closes beyond the levels you set.
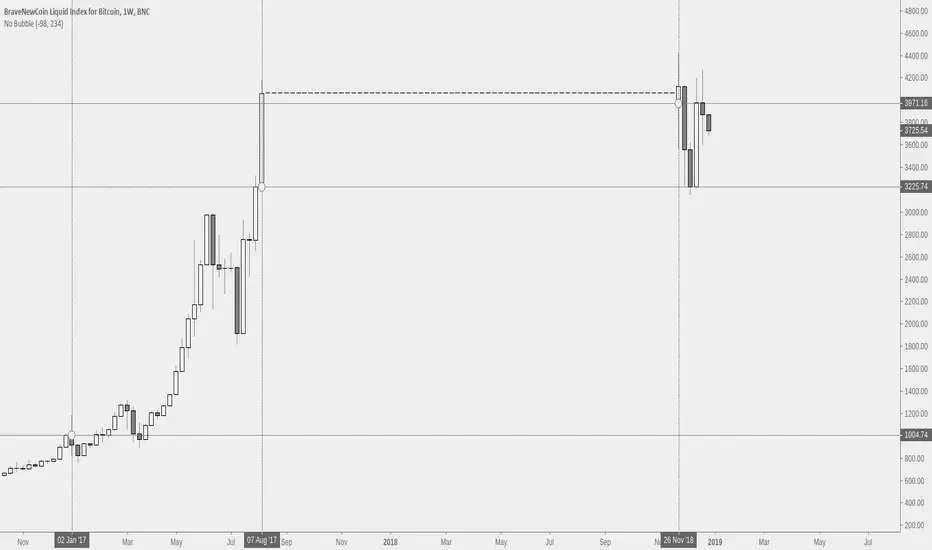
No BubbleSimply removes a period of time from the chart and replaces it with no value. This can help with scaling or bias.