Candlestick Analysis

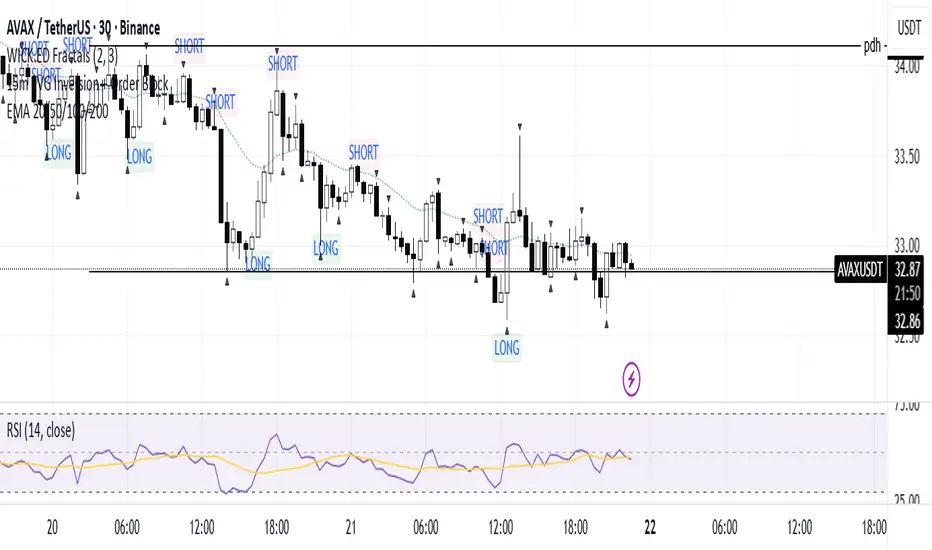
15m FVG Inversion + Order BlockThe indicator finds the inversion of the FVG 15 minutes and the order block, after which it gives an entry signal.
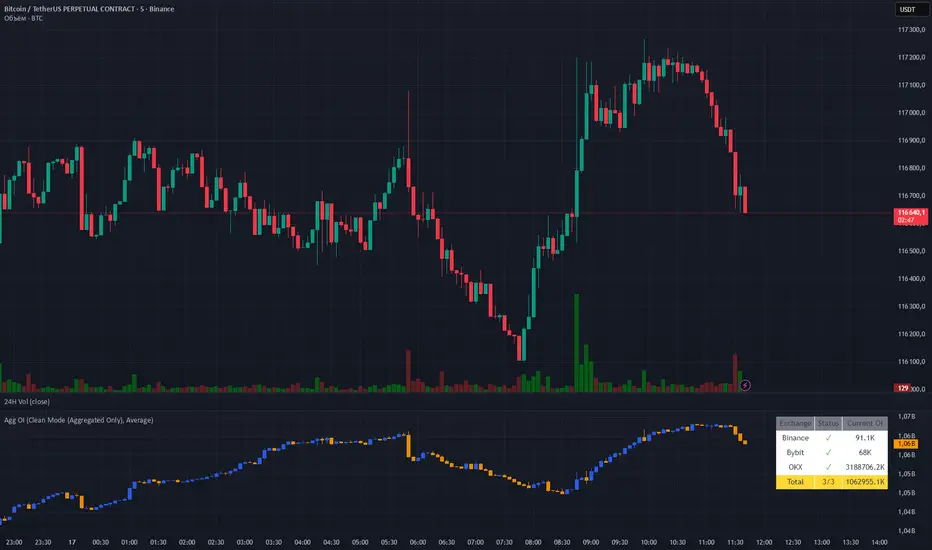
Aggregated OI by MalexThis indicator aggregates Open Interest data from multiple major exchanges (Binance, Bybit, OKX) to provide a comprehensive view of market positioning across platforms.
Original idea by Alex Nikulin.
FEATURES:
Multi-exchange OI aggregation with customizable exchange selection
Choose between Sum or Average aggregation methods
Individual exchange OI display (optional)
Clean mode - show only aggregated data
Real-time status monitoring for each exchange
Candlestick visualization matching standard OI indicators
Information panel showing current values and active exchanges
USAGE:
Enable/disable specific exchanges in settings
Choose aggregation method (Average recommended for balanced view)
Toggle individual exchange display or use clean mode
Monitor the info panel for data availability status
COMPATIBILITY:
Works with any symbol that has Open Interest data available on the selected exchanges.
Best used on perpetual futures contracts (e.g., BTCUSDT, ETHUSDT, etc.)
Heikin Ashi Overlay SuiteHeikin Ashi Overlay Suite is designed to give traders more control and clarity when working with Heikin Ashi candles — whether you're analyzing trend strength, reducing chart noise, or simply improving your visual read of market momentum. It works by layering multiple types of HA overlays and color systems on top of your standard candlestick chart — without switching chart types. With dynamic gradient coloring, smoothing options, and a predictive line tool, this script helps you see not just what the current trend is, but how strong it is, and what it would take to reverse it.
Heikin Ashi candles help reduce noise but this script goes further by:
➡️adding color intelligence that shows trend strength using a streak counter
➡️uses smoothing logic to clean up chop and whipsaws
➡️introduces a predictive close line — a subtle but powerful guide for anticipating trend flips before they happen
Everything is configurable: colors, candle sources, overlays, predictive tools, and line styles. It’s built for traders who want visual speed, but don’t want to sacrifice signal quality.
At its core, the script offers two powerful dropdown controls:
💥HA Color Scheme (Colors Regular Candles) — Applies Heikin Ashi-derived coloring to your regular candles based on trend direction or streak strength. This gives you instant visual context without switching to a separate chart type.
💥HA Candle Overlay Mode — Overlays actual Heikin Ashi-style candles directly on top of your chart, using your preferred source:
➡️Custom HA candles using internal formula logic
➡️TradingView’s built-in Heikin Ashi source with your own colors
➖➖➖➖➖➖➖➖➖➖➖➖➖➖➖➖➖➖➖➖➖➖➖➖➖➖➖➖➖➖➖
🎨 Custom + Gradient HA Coloring🎨
See trend strength at a glance:
➡️1–4 bar streaks → lighter tone
➡️5–8 bars → medium tone
➡️9+ bars → bold tone, ideal for momentum-based entries, exits, or scaling strategies
→ Choose from:
➡️Your own custom color set
➡️A simple 2-color base mode
➡️Or a 3-level gradient for progressive trend analysis (using the streak counter)
🏛️ TradingView Official Heikin Ashi Overlay
Prefer native HA candles but want your own colors?
This mode plots TradingView's Heikin Ashi source, with your personal bullish/bearish color scheme.
➡️Ensures consistency with built-in charts while still leveraging your visual style.
🌊 Smoothed Heikin Ashi Candles — Clarity in Chaos🌊
These aren’t your standard HA candles. Smoothed Heikin Ashi uses a two-step EMA process to transform chaotic price action into a cleaner, slower-moving trend structure:
🔹 First, it smooths the raw OHLC data using EMA — filtering out minor price fluctuations.
🔹 Then, it applies the Heikin Ashi transformation on top of the smoothed data.
🔹 Finally, it applies a second EMA smoothing pass to the HA values — creating ultra-smooth candles.
📈 What You See:
Trends appear more fluid and consistent.
Choppy ranges and fakeouts are visually suppressed.
Minor pullbacks within a trend are de-emphasized, helping you avoid premature exits.
🎯 Best For:
Swing traders looking to stay in positions longer.
Intraday traders dealing with volatile or noisy instruments.
Anyone who wants a "trend map" overlay without the distractions of raw price action.
✅ Reduces whipsaws
✅ Delivers high-contrast trend zones
✅ Makes reversals more visually apparent (but with a slight lag)
📍 Predictive Close Line📍
Shows where the real close must land to flip the current HA candle's color.
✅ Use it like predictive support/resistance
✅ Know if the trend is actually at risk
✅Visualize potential fakeouts or confirmation
Color-coded based on current HA direction (bullish, bearish, or neutral).
📈 Tick by tick & bar-to-bar Plots📈
Provides 2 plot types:
1)1 plot that tracks a bar tick by tick
2)another plot that tracks the close from bar to bar
For the bar to bar plot, you can choose between 2 options:
✅Full Plot — continuous line colored by HA trend
✅Recent Segments — color just the last few bars (configurable) to reduce chart clutter
✅ Customize width, number of bars, and visibility
➖➖➖➖➖➖➖➖➖➖➖➖➖➖➖➖➖➖➖➖➖➖➖➖➖➖➖➖➖➖➖
📘 How to Use this script📘
Imagine you're watching a choppy 15-minute chart on a volatile crypto pair — price action is messy, and it’s hard to tell if a trend is forming or just noise.
Here’s how to cut through the chaos using Heikin Ashi Overlay Suite:
🔹 Step 1: Enable "Smoothed HA Candles"
Start by turning on the smoothed candles. You’ll immediately notice the noise fades, and broader directional moves become easier to follow. It's like switching from static to clean trend zones.
🧠 Why: Smoothed HA uses a double EMA process that filters out small reversals and lets larger moves stand out. Perfect for sideways or jittery charts.
🔹 Step 2: Watch the Color Gradient Build
As the smoothed candles begin to align in one direction, the gradient coloring (1–4, 5–8, 9+ streaks) gives you an at-a-glance visual of how strong the trend is.
✅ If you see 9+ same-colored candles? You’re likely in a mature trend.
✅ If it resets often? You’re in chop — consider staying out.
🔹 Step 3: Use the Predictive Close Line for Anticipation
Now here’s the edge — this line tells you where the candle would have to close to flip colors.
📉 If price is hovering just above it during a bullish run — momentum may be weakening.
📈 If price bounces off it — the trend may be strengthening.
This is excellent for confirming entries, exits, or spotting early warning signs.
🔹 Step 4: Switch Between Candle Modes as Needed
You can flip between:
✅ Custom HA: Gradient candles with your colors
✅ TradingView HA: The official source with your styling
✅ None: Just color regular candles using the HA logic
Use what fits your style — everything is modular.
🔹 Step 5: Tune It to Your Chart
Lastly, tweak streak thresholds (currently only can do this within the source code), smoothing lengths, and line styles to match your timeframe and strategy.
🎯 Tailor The Settings to Fit Your Trading Style🎯
🔹 🧪 Scalper (1–5 min charts)
If you’re trading fast intraday moves, you want quicker responsiveness and less lag.
Try these settings:
🔸Smoothing Lengths: Use lower values (e.g. len = 3, len2 = 5)
🔸Candle Mode: Use Custom HA or TV’s HA for real-time color flips
🔸Predictive Close Line: Great for ultra-fast anticipation of color reversals
🔸Line Mode: Use Recent Segments mode to track short bursts of trend
🔸Colors: Use high-contrast, opaque colors for clarity
✅ These settings help you catch micro-trends and flip signals faster, while still filtering out the worst of the noise.
🔹 🧪 Swing Trader (30m–4h charts and beyond)
If you’re looking for multi-hour or multi-day trend confirmation, prioritize clarity and staying in moves longer.
Recommended setup:
🔸Smoothing Lengths: Medium to high values (e.g. len = 8, len2 = 21)
🔸Candle Mode: Use Smoothed HA Candles to block out intrabar chop
🔸Gradient Colors: Enable to visualize trend maturity and strength
🔸Predictive Close Line: Helps confirm trend continuation or spot early reversals
🔸Line Mode: Use Full Plot Line for clean HA-based trend tracking
✅ These settings give you a calm, clean view of the bigger picture — ideal for holding positions longer and avoiding early exits.
🔧 This script isn’t just a chart overlay — it’s a visual trend engine.🔧
Ideal For:
🔶 Trend-followers who want clean, color-coded confirmation
🔶 Reversal traders spotting exhaustion via predictive flips
🔶 Scalpers filtering noise with lighter smoothing
🔶 Swing traders using smoothed visuals to hold longer
📌 Final Note
Heikin Ashi Overlay Pro is designed to help you see momentum, trend shifts, and market structure with greater clarity — not to predict price on its own. For best results:
✔️ Combine with support/resistance, moving averages, or price action patterns
✔️ Use Predictive Close as a confirmation tool, not a signal generator
✔️ Pair gradient colors with structure to gauge trend maturity
✔️ Always zoom out and check higher timeframes for context
🧠 Use this as part of a layered approach — not a standalone system.
🙏 Credits🙏
⚡HA logic based on SimpleCryptoLife
⚡Smoothed HA concept adapted from a script by Jackvmk
💡💡💡Turn logic into clarity. Structure into trades. And uncertainty into confidence.💡💡💡

Intraday Buy/Sell/Average Zones by Chaitu50cIntraday Buy/Sell/Average Zones by chaitu50c
Timeframe:
Tested on the 5-minute chart.
Recommended timeframe: 5-minute
What it does
This indicator marks intraday Buy (green) and Sell (red) zones made by strong close-confirmed breakouts. These zones act as support/resistance. If price later closes through a zone, the zone changes color from that bar forward (support ↔ resistance). It can flip more than once.
How zones form
Single breakout: an opposite-type candle closes beyond the previous candle’s high/low.
Double breakout: a base candle, then two opposite-type candles, and the second one closes beyond the base high/low.
Zone size
Buy zone: from the combo lowest low up to the nearest open/close of the combo.
Sell zone: from the combo highest high down to the nearest open/close of the combo.
Color shift (optional)
If price closes through a zone, it flips color at that bar and behaves as the other side (support ↔ resistance). Flips can happen again later.
Overlap control
When a new zone overlaps an existing same-color zone in the same session, choose:
Merge (combine), or
Suppress (ignore the new one).
Flipped zones use their current color for this.
Right edge & session
All zones extend to the right (your offset). Detection is limited to your chosen session, and you can show only the last N sessions.
---
How to trade (simple)
A) Initial breakout trade
When a new zone forms, that breakout itself can be a trade idea in the breakout direction, The stoploss will be the zone.
B) Zone breakout trade (flip)
If price later closes out of a zone and it changes color, that breakout is another trade opportunity in the new direction.
C) Retrace & average trade
When price retests a zone, wait for a confirmation candle in the zone’s favor
— bullish close for a green zone, bearish close for a red zone — then average entries inside/near the zone.
Place stops just beyond the opposite edge of the zone.
If the zone flips color, stop averaging; bias changed.
---
Key settings
Breakout type: Single and/or Double
Confirm on Close: strict mode (no intrabar preview) or allow intrabar preview that auto-removes if fail
Color Shift on Breaks: on/off
Same-Type Overlap: Merge/Suppress
Session, Sessions to Display, Right Offset, Colors, Max Zones
Reminder: Best results on the 5-minute timeframe (tested and recommended).

Distribution DaysThis script marks Distribution Days according to the Investors Business Daily method -- a significant decline on higher volume:
(1.) Price has declined > 0.2% from the prior day's close
(2.) Trading volume is greater than the prior day's volume

Open Interest OverlayOpen Interest Overlay
Overview
This indicator displays Open Interest (OI) data directly on your price chart as an overlay, eliminating the need for separate panes while preserving authentic OI movement patterns. Perfect for traders who want to analyze OI correlations without sacrificing chart real estate.
Key Features
📊 Smart Price Scaling
• Automatically maps Open Interest values to fit within your chart's price range
• Preserves all directional movements, timing, and relative magnitude relationships
• Uses official TradingView Open Interest feed for accuracy
🎨 Full Customization
• Custom Colors: Choose your own colors for rising/falling OI (defaults: teal/red)
• Line Style: Toggle between step-line (traditional) or smooth line display
• Optional Fill: Shade area between OI line and mid-price for better visual reference
• Smoothing Options: Apply moving average smoothing to reduce noise
⚙️ Intelligent Settings
• Normalization Window: 300-bar lookback (customizable) for scaling calculations
• Auto Timeframe: Uses daily data for intraday charts on traditional assets, chart timeframe for crypto
• Real Value Display: Shows actual (unscaled) OI value on the last bar
How It Works
The indicator performs proportional mapping of Open Interest data:
1. Calculates OI range (high/low) over the lookback period
2. Maps this range to your chart's price range during the same period
3. Displays OI movements that maintain authentic patterns and timing
Perfect For
✅ Correlation Analysis - See how OI moves with price in real-time
✅ Divergence Spotting - Identify when OI and price trends diverge
✅ Clean Charts - No need for separate panes or window splitting
✅ Pattern Recognition - Spot OI building/declining during key price levels
✅ Cross-Market Analysis - View any symbol's OI overlay on your current chart (e.g., Bitcoin OI while viewing Ethereum prices)
What You Get vs Traditional OI Indicators
Advantages:
• Authentic OI movement patterns preserved
• Direct visual correlation with price action
• No chart real estate sacrifice
• Immediate trend and divergence recognition
Trade-offs:
• Shows relative OI changes rather than absolute values
• Scaling is relative to the selected lookback period
Ideal For
• Day traders monitoring intraday OI flow
• Swing traders analyzing OI trends with price movements
• Futures traders tracking institutional interest
• Anyone wanting clean, correlation-focused OI analysis
Compatible With
• Futures contracts with Open Interest data
• Any timeframe (auto-adjusts for optimal data)
• All TradingView-supported OI symbols

Liquidation/Doji CandlesLiquidation/Doji Candles
This indicator highlights candles with a body length smaller than 30% of the candle’s total range. These candles are displayed in orange, representing potential liquidation points or doji candles.
The idea behind this tool is to help traders spot moments of market indecision, where buying and selling pressure are in balance. Such conditions often hint at institutional liquidation events or possible retail-driven reversals.
You can fully customize the detection sensitivity by adjusting the percentage input. This allows you to tighten or loosen the condition depending on your trading style and market preference.
To support passive traders, the script also includes built-in alerts for:
• The formation of a new liquidation/doji candle.
• A close above its high (bullish engulfment).
• A close below its low (bearish engulfment).
These alerts make it easier to stay on top of potential market shifts without needing to constantly monitor the charts.

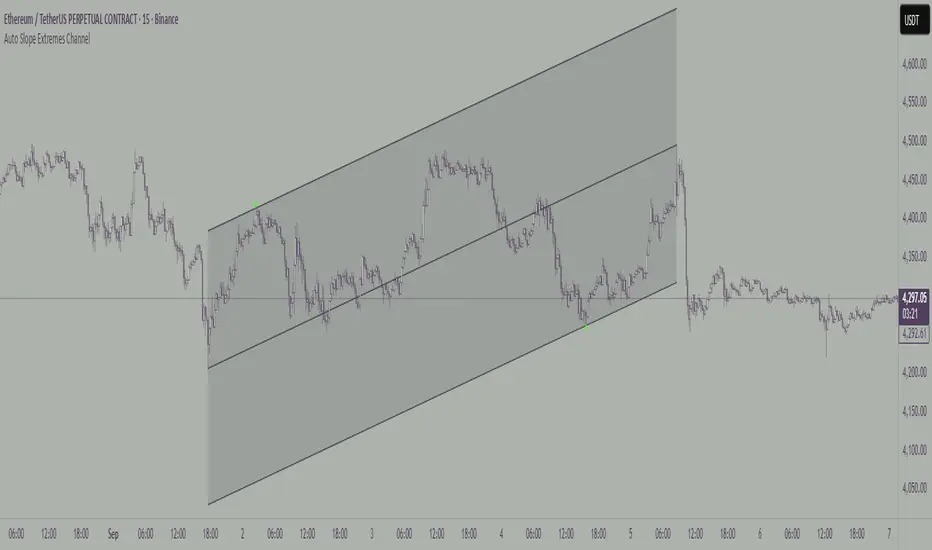
Auto Slope Extremes ChannelAuto Slope Extremes Channel
Expanding channel that locks onto the highest high and lowest low of the slope between A and B.
This indicator builds a dynamic channel between two anchors, A and B.
Unlike fixed-width channels, it adapts to the slope of the leg between A and B and expands until:
• The upper channel line touches the highest candle in that slope.
• The lower channel line touches the lowest candle in that slope.
This method ensures that the channel edges are defined only by the single most extreme high and the single most extreme low within the selected leg. No other candles in the range touch the edges.
A centerline is drawn midway between the two extremes, and small triangle markers highlight the exact candles that determine the upper and lower boundaries.
Features
• Anchored channel defined by two user-selected points (A and B).
• Expands to fit the highest high and lowest low of the slope between A and B.
• Optional centerline and channel fill.
• Extend lines left, right, or both.
• Customizable line widths and colours.
Stockbee Reversal Bullish v2Custom indicator for identifying stocks that meet the Stockbee's Reversal Bullish New criteria. This can be used as a standalone indicator or use it to screen for stocks in Pine Screener.
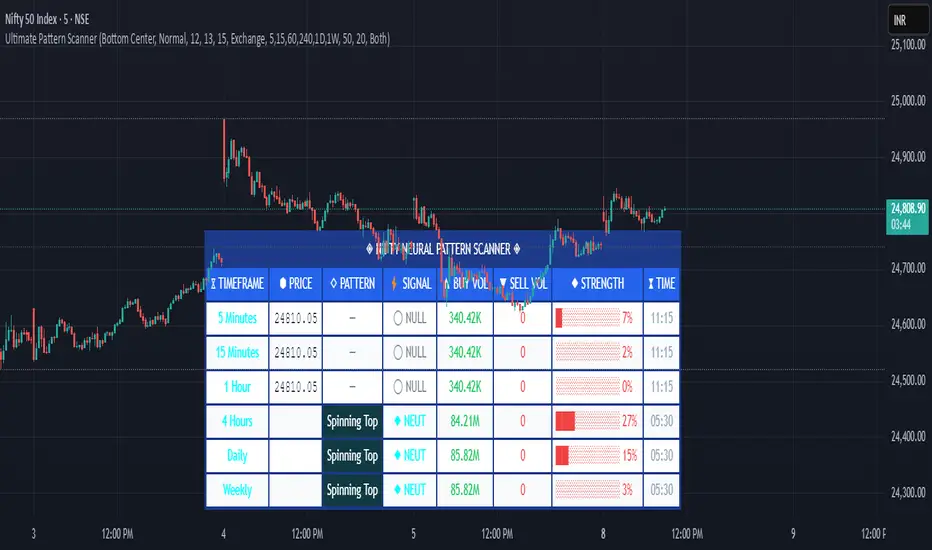
Pattern ScannerUltimate Pattern Scanner — multi-timeframe candlestick discovery tool (educational use only).
Purpose: This script scans user-selected timeframes for classical candlestick patterns (for example: engulfing, morning/evening stars, hammers, dojis, tasuki gaps, three soldiers/crows, tweezers, marubozu, and others) and reports pattern name, detection price, directional signal (Bull / Bear / Neutral), and a simple volume participation metric. It is intended as an idea-generation and training tool to help traders learn pattern mechanics, not as an automated trading system.
Main modules and rationale: 1) Pattern engine — applies classical candle structure rules to detect formations; 2) SMA trend filter (configurable length) — provides a directional bias to favor trade-with-trend setups; 3) Volume heuristic — approximates participation by separating candles into buy-like and sell-like volume and comparing total volume to a moving average; 4) Multi-timeframe aggregator — collects and presents pattern results from multiple timeframes; 5) Alerts — optional alerts list detected patterns and TFs. Combining these modules is intentional: patterns provide structure, SMA provides context, and volume supplies participation confirmation. Together they improve the educational value and practical relevance of each detected pattern.
How to use: Choose timeframes and SMA length that match your trading horizon. Use the scanner to locate pattern candidates, then confirm with higher-timeframe agreement and volume ratio before considering trade entry. Use structural stops (recent swing highs/lows or ATR-based stops) and define risk:reward rules. For learning, replay alerted bars and record outcomes over fixed horizons to build empirical statistics.
Limitations: Volume classification (close>open) is a heuristic and not a true bid/ask tape. SMA is a lagging trend proxy. Multi-timeframe agreement reduces but does not eliminate false signals, especially around news or in low-liquidity instruments. Use demo accounts and backtesting before live trading.
Inputs you can adjust: timeframe list, SMA length, volume MA length, which patterns to enable/disable, display options.
Compliance notes: This description explains why modules are combined and what the script does without exposing source code logic; it is non-promotional and contains no contact links. Remove any trademark symbols unless registration details are provided.
Risk Disclaimer: This tool is provided for education and analysis only. It is not financial advice and does not guarantee returns. Users assume all risk for trades made based on this script. Backtest thoroughly and use proper risk management.
Cumulative Volume Delta Candles Aggregated (Lite)Cumulative Volume Delta Candles Aggregated (Lite)
Multi-Exchange CVD Visualization in Candle Format
This indicator provides an aggregated Cumulative Volume Delta (CVD) view across multiple major perpetual futures exchanges in one chart. It is designed for traders who want a broader perspective on buying and selling pressure without switching between multiple charts or relying on a single exchange feed.
What It Does
Combines volume delta data from Binance, Bybit, OKX, Bitget, and Coinbase into a unified representation.
Displays CVD as candlesticks, where each candle reflects the open, high, low, and close of cumulative delta for the selected period.
Offers a clear visual of how buying and selling pressure evolves across markets in a structured, familiar candle format.
Key Features
✔ Exchange Aggregation: Incorporates data from several top futures markets available on TradingView.
✔ Anchor Reset: Allows you to set an anchor timeframe (e.g., daily) to reset cumulative values for better readability and analysis.
✔ Unit Normalization: Since exchanges report volumes in different units, the indicator normalizes all data and outputs values denominated in the base currency (coins) for consistency.
✔ Hidden OHLC Outputs: Provides open, high, low, and close values as hidden plots for use with other indicators or strategies.
✔ Lightweight Design: Optimized for efficiency while handling multiple real-time data requests.
Why It’s Different
Unlike standard single-exchange CVD tools, this indicator aggregates the majority of perpetual volume data available on TradingView, offering a more representative view of market sentiment. The candle-based representation of CVD introduces an additional layer of structure, helping traders identify shifts in momentum and pressure with more context than a simple cumulative line.
Use Cases
- Spotting aggregated buy/sell pressure trends across multiple exchanges.
- Confirming breakout or reversal signals with broader volume delta context.
- Serving as a custom data source for other indicators or algorithmic strategies.

RB — Rejection Blocks (Price Structure)This indicator detects and visualizes Rejection Blocks (RBs) using pure price action logic.
A bullish RB occurs when a down candle forms a lower low than both its neighbors. A bearish RB occurs when an up candle forms a higher high than both its neighbors.
Validated RBs are displayed as boxes, optional lines, or labels. Blocks are automatically removed when invalidated (price closes through them), keeping the chart uncluttered and focused.
How to use
• Apply on any timeframe, from intraday to higher timeframes.
• Watch how price reacts when revisiting RB zones.
• Treat these zones as contextual areas, not entry signals.
• Combine with your own trading methods for confirmation.
Originality
Unlike generic support/resistance tools, this indicator isolates a specific structural pattern (rejection blocks) and renders it visually on the chart. This selective focus allows traders to study structural reactions with more clarity and precision.
⚠️ Disclaimer: This is not a trading system or a signal provider. It is a visual analysis tool designed for structural and educational purposes.

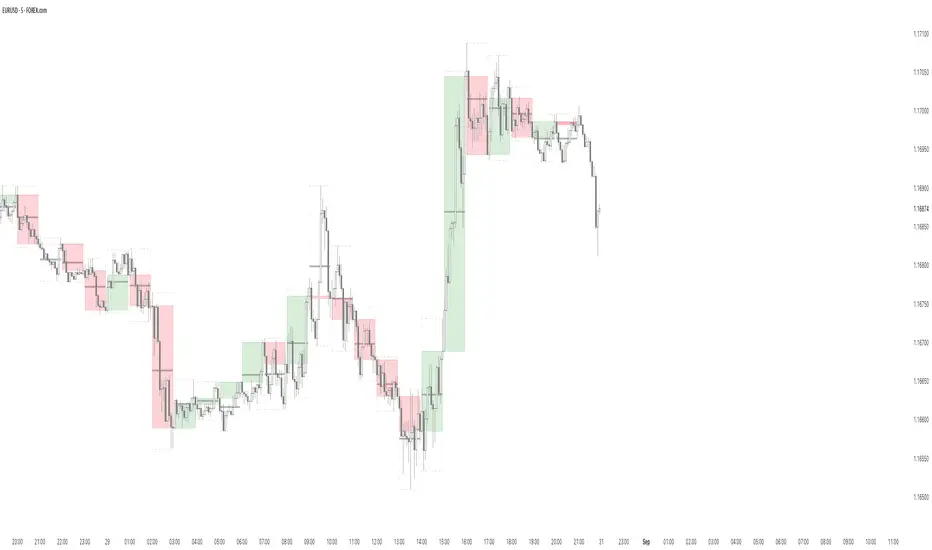
B A N K $ - HTF Candle Boxes (Power of 3)This indicator allows you to visualise the HTF candles on the LTF's, this is useful for using the Power of 3 / Accumulation, Manipulation & Distribution concepts.
By default, the HTF interval is set to 1h, this means that an outline will be created around the LTF candles that are within that 1h window. (i.e from 13:00-14:00 etc).
Features
HTF Interval Selector - this allows the user to customise which HTF interval to use
Candle Boxes - this outlines the full outer perimeter of the relevant candles
Include Body - this highlights the distance between the candle Open & Close
Show MidLine
Additional Settings
Hide Side Lines - this will only draw the Top & Bottom lines
Extend Lines to Current Candle - most recent Top & Bottom lines will extend to current price
Draw Lines from Exact Candle - this makes the most recent candle lines cleaner
I personally use this indicator to outline the most recent 3 1h candles to make it easier to identify sweeps & reversals however there is additional functionality to allow the user to customise the indicator to their preference.
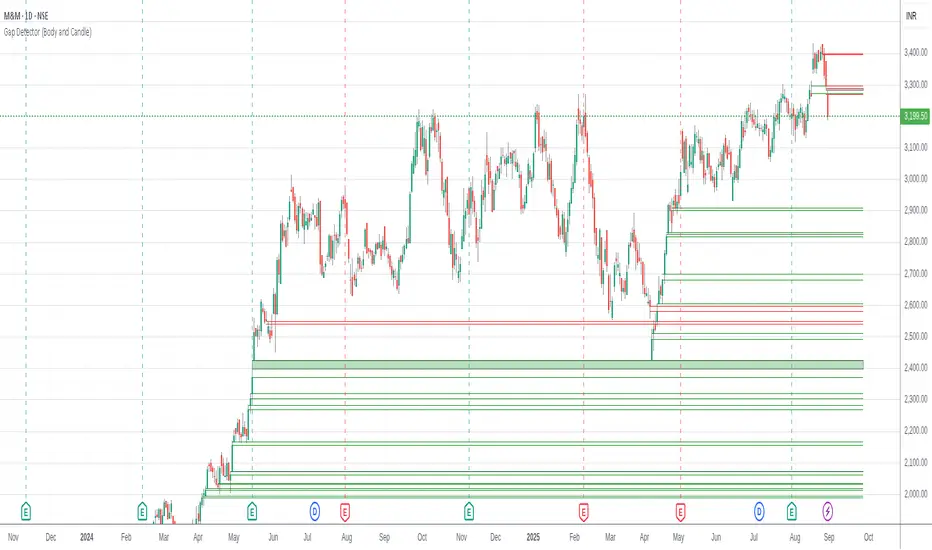
Gap Detector (Body and Candle)Finds/Detects gaps between candles and candle bodies for any chart/timeframe with O(n+delta) performance.
Candle Gaps (between wicks) act as strong support or resistance. They are drawn as solid boxes.
Body Gaps (ignores wicks) act as mild support or resistance. They are depicted with lines.
Adjust the settings for candle/body gap width, smaller the time frame, smaller the gap.
Adjust max historical bars to fine tune performance on your system/setup. The more historical bars the script scans, more time required to load the chart. At times based on system configuration, TradingView may timeout the script due to too many bars. Reducing the max bars helps in this scenario.
This is a revamped version of "Body Gap Detector".
Happy charting !
MEMA X-OL9+A. 5, 10, 20, 50 ema's
B. When the 10 goes below the 20 it has shades of red between the 10 and 20.
C. When there is a downward crossover, There will be a Red arrow pointing down.
D. When the 10 is moving closer (upward) towards the 20 it has orange shading. I use this to catch 10 over 20 crossovers.
E. When there is a crossover 10 over 20 it will shade green and have a gold arrow pointing upward. A little redundant, because you'll see the crossover from the shading.
F. Finally there will be smaller blue arrows that represent when there is a close of a candle, if it is lower than the prior candle.
All customizable and defaults should work.

New Highs - MarkerDescription:
This indicator highlights every bar that sets a new high or matches the previous high.
New Highs (ATH or Lookback Highs) are marked with a green triangle above the candle.
Equal Highs (ties) are marked with an orange triangle above the candle.
You can choose between All-Time Highs (lookback = 0) or rolling lookback highs over a user-defined number of bars.
Alerts are included for both new highs and equal highs.
Use this tool to quickly spot breakouts or double-top style patterns as they form.
Cnagda Liquidit Trading SystemCnagda Liquidit Trading System helps spot where price is likely to trap traders and reverse, then gives simple, actionable Level to entry, place SL, and take profits with confidence. It blends imbalance zones, trend bias, order blocks, liquidity pools, high-probability fake Signal, and context-aware candle patterns into one clean workflow.
🟩🟥 Imbalance boxes: “Crowd rushed, gaps left”
What it is: Green/red boxes mark fast, one-sided moves where price “skipped” orders—think FVG-like zones that often get revisited.
Why it helps: Price frequently pulls back to “fill” these zones, creating clean retest entries with logical stops.
⏩How to use:
Green box = potential demand retest; Red box = potential supply retest. Enter on pullback into box, not on first impulse. Put stop on far side of box and aim first targets at recent swing points.
↕️ Swing bias (HH/HL vs LH/LL): “Which way is the road?”
What it is: Higher-highs/higher-lows = up-bias; Lower-highs/lower-lows = down-bias. system plots Buy/Sell OB levels aligned with that bias.
Why it helps: Trading with the broader flow reduces “hero trades” against institutions. Bias gives clearer entries and cleaner drawdowns.
⏩How to use:
Up-bias: look for long on Buy OB retests. Down-bias: look for short on Sell OB retests. Wait for a small rejection/engulfing to confirm before triggering.
🧱Order blocks: “Where big players remember”
What it is: last opposite-colored candle before an impulsive move—these zones often hold memory and reaction. system plots these as Buy/Sell OB lines.
Why it helps: Many breakouts pull back to the origin. Good entries often happen on retest, not on the breakout chase.
⏩ How to use:
Let price return into the OB, show wick rejection, and decent volume. Enter with stop beyond OB; define risk-reward before entry.
📊Volume coloring: “How Volume is move?”
What it is: Bar color reflects relative volume; inside bars are black. The dashboard also shows Volume and “Volume vs Prev.”
Why it helps: Patterns without volume often fade; volume validates strength and intent of moves.
⏩ How to use:
Favor entries where imbalance/OB/liquidity-grab coincide with higher volume. If volume is weak, reduce size or skip.
🧲 BSL/SSL liquidity pools: “Fishing for stops”
What it is: Equal highs cluster stops above (BSL); equal lows cluster stops below (SSL). system plots these and highlights the nearest one (“magnet”).
Why it helps: Price often sweeps these pools to trigger stops before reversing. This is a prime trap-reversal location.
⏩ How to use:
Watch nearest BSL/SSL. If price wicks through and closes back inside, anticipate a reversal. Trade reaction, not first poke. When price closes beyond, consider that pool mitigated and move on.
🟢🔴 Advanced liquidity grab: “Catch fakeout”
What it is: Bullish grab = makes a new low beyond a prior low but closes back above it, with a long lower wick, small body, and higher volume. Bearish is mirror. Labeled automatically.
Why it helps: It exposes trap moves (stop hunts) and often precedes true direction.
⏩ How to use:
Best when it aligns with a nearby imbalance/OB and supportive volume. Enter on reversal candle break or on retest. Stop goes beyond sweep wick.
🧠 Smart candlestick patterns (only in right place)
What it is: Engulfing, Hammer, Shooting Star, Hanging Man, Doji (with high volume), Morning/Evening Star, Piercing—but marked “effective” only if context (swing/trend/location) agrees.
Why it helps: same pattern in the wrong place is noise; in the right place, it’s signal.
⏩ How to use:
Location first (BSL/SSL/OB/imbalance), then pattern. Treat pattern as trigger/confirmation—one fresh label shows to keep chart clean.
🧭 Dashboard: “Context in a glance”
⏩ Reversal Level: current swing anchor—expect turns or reactions nearby; great for alerts and planning.
⏩ Volume vs Prev + Volume: Strength meter for signal candle—higher adds conviction.
⏩ Nearest Pool: next “magnet” area—look for sweeps/rejections there.
🧩Step-by-step trading flow (with mindset)
⏩ Set bias: HH/HL = long bias, LH/LL = short bias. Counter-trend only on clean sweeps with strong confirmation.
⏩ Find magnet: Check Nearest Pool (BSL/SSL). Focus attention there; it saves screen time.
⏩ Wait for event: Look for a sweep/grab label, or sharp rejection at pool/OB/imbalance. Avoid FOMO.
⏩ Add confluence: Stack 2–3 of these—imbalance box, OB, contextual pattern, supportive volume.
⏩Plan entry: Bullish: trigger above reversal candle high or take retest of FVG/OB. Stop below sweep wick/zone. Target at least 1:1.5–1:2.
Bearish: mirror above.
⏩Manage smartly: Take partials, move to breakeven or trail thoughtfully. Don’t drag stops inside zone out of emotion.
🎛️ Parameter tuning (to reduce human error)
⏩ swingLen: Smaller = faster but noisier; larger = cleaner but slower. Backtest first, then go live.
⏩ Tolerance (ATR or percent): ATR tolerance adapts to volatility (good for fast markets and lower TFs). Start around 0.15–0.30. In calm markets, try percent 0.05–0.15%.
⏩ minBarsGap: Start with 3–5 so equal highs/lows are truly equal—reduces false pools.
❌Common mistakes → ✅ Better habits
⏩Chasing every breakout → Wait for sweep/rejection, then confirm.
⏩Ignoring volume → Validate strength; cut size or skip on weak volume.
⏩Losing history of pools → If reviewing/backtesting, keep mitigated pools visible (dashed/faded).
⏩Over-tight tolerance/too small swingLen → Increases false signals; backtest to find balance.
📝 checklist (before entry)
⏩ Is there a nearby BSL/SSL and did a sweep/grab happen there?
⏩ Is there a close imbalance/OB that price can retest?
⏩ Do we have an effective pattern plus supportive volume?
⏩Is the stop beyond the wick/zone and RR ≥ 1:1.5?
•?((¯°·._.• 🎀 𝐻𝒶𝓅𝓅𝓎 𝒯𝓇𝒶𝒹𝒾𝓃𝑔 🎀 •._.·°¯((?•

Global Sessions with Trend & Liquidity Features:
-Session ranges with customizable lines & colors
-Opening range markers and optional background shading
-Automatic trend detection per session (Bullish / Bearish / Neutral)
-Indicators when highs/lows are broken
-Clean visual design with toggles for minimal or detailed display
This Pine Script code is designed to help traders visualize and analyze different market sessions. It's a tool that displays the trading hours for the Asian, London, and New York sessions right on the chart.
The main purpose is to show when these key markets are open and to highlight their price ranges. It also includes features to track the trend within each session and to identify "liquidity sweeps" or moments when the price breaks the high or low of a previous session.
In simple terms, it helps a trader see what the market is doing and where the price is likely to go, all based on the major global trading times. It's especially useful for day traders who want to align their strategies with the activity of specific markets.
P.S. Apologies to users not in the EST timezone! This version is hardcoded to Eastern Standard Time, and I'm not currently sure how to automatically adjust it for different timezones. But you can adjust manually and click the dropdown menu to Save As Default.
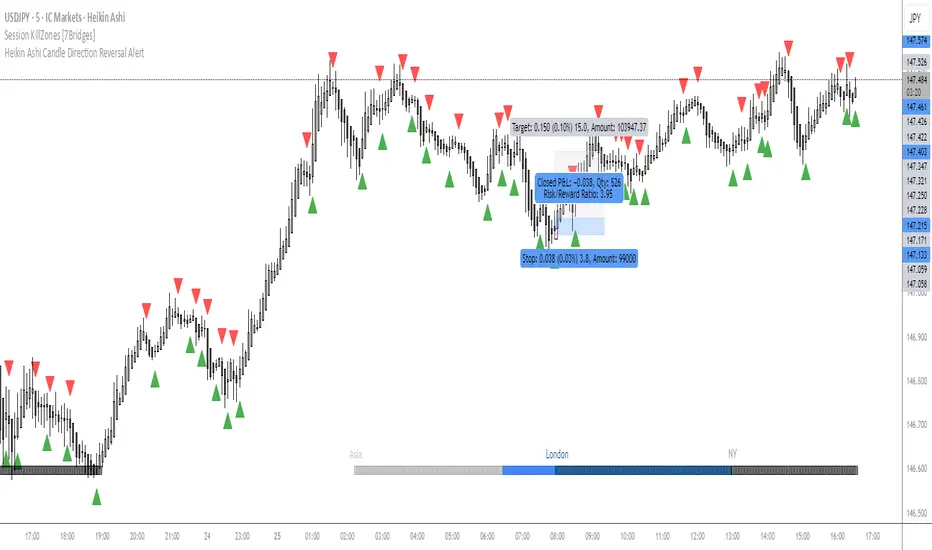
OMN Heikin Ashi Candle Direction Reversal AlertThis is a indicator to let you know once Heikin Ashi candle has changed direction compared to the candle before it. Set an alert on the indicator to get an audible alert.
TEEREX COUNTDOWN BY N' TEEREX HOONJONGPANG Features:
Price Flip Detection – identifies initial buy/sell setups based on close price comparisons to previous bars.
Setup Phase (1–9) – counts consecutive bars fulfilling Teerex number conditions; plots numbers on each candle.
Cd Phase (1–13) – continues counting after Setup 9; highlights potential reversal points.
Signals – marks Setup 9 and Countdown 13 with clear labels and arrows (“LONG” / “SELL”).
TDST Lines – draws dynamic support (Buy TDST) or resistance (Sell TDST) lines based on Setup 9 highs/lows. These lines help identify potential breakout or bounce zones.
Customizable Display – options to show/hide numbers, signals, and TDST lines; color-coded for clarity.
Usage:
Monitor Setup 9 and Countdown 13 labels for strong buy/sell signals.
Use TDST lines as reference for support/resistance, target levels, or confirmation of trend continuation.
Visuals:
Numbers 1–9/1–13 appear on the chart for precise counting.
Arrows and labels indicate Setup 9 completion and Cd 13 completion.
TDST lines extend to the right, updating with each new Setup 9.

VPOC Harmonics - Liquidity-Weighted Price / Time RatiosVPOC Harmonics - Liquidity-Weighted Price / Time Ratios
Summary
This indicator transforms a swing’s price range, duration, and liquidity profile into a structured set of price-per-bar ratios. By anchoring two points and manually entering the swing’s VPOC (highest-volume price), it generates candidate compression values that unify price, time, and liquidity structure. These values can be applied to chart scaling, harmonic testing, and liquidity-aware market geometry.
________________________________________
Overview
Most swing analysis tools only consider price (ΔP) and time (N bars). This script goes further by incorporating the VPOC (Point of Control) — the price with the highest traded volume — directly into swing geometry.
• Anchors define the swing’s Low (L), High (H), and bar count (N).
• The user manually enters the VPOC (highest-volume price).
• The indicator then computes a suite of ratios that integrate range, duration, and liquidity placement.
The output is a table of liquidity-weighted price-per-bar candidates, designed for compression testing and harmonic analysis across swings and instruments.
________________________________________
How to Use
1. Select a Swing
- Place Anchor A and Anchor B to define the swing’s Low, High, and bar count.
2. Find the VPOC
- Apply TradingView’s Fixed Range Volume Profile tool over the same swing.
- Identify the Point of Control (POC) — the price level with the highest traded volume.
3. Enter the VPOC
- Manually input the POC into the indicator settings.
4. Review Outputs
- The table will display candidate ratios expressed mainly as price-per-bar values.
5. Apply in Practice
- Use the ratios as chart compression inputs or as benchmarks for testing harmonic alignments across swings.
________________________________________
Outputs
Swing & Inputs
• Bars (N): total bar count of the swing.
• Low (L): swing low price.
• High (H): swing high price.
• ΔP = H − L: price range.
• Mid = (L + H) ÷ 2: midpoint price.
• VPOC (V): user-entered highest-volume price.
• Base slope s0 = ΔP ÷ N: average change per bar.
• π-adjusted slope sπ = (π × ΔP) ÷ (2 × N): slope adjusted for half-cycle arc geometry.
________________________________________
VPOC Harmony Ratios (L, H, V, N)
• λ = (V − L) ÷ ΔP: normalized VPOC position within the range.
• R = (V − L) ÷ (H − V): symmetry ratio comparing lower vs. upper segment.
• s1 = (V − L) ÷ N: slope from Low → VPOC.
• s2 = (H − V) ÷ N: slope from VPOC → High.
________________________________________
Blended Means (s1, s2)
These combine the two segment slopes in different ways:
• HM(s1,s2) = 2 ÷ (1/s1 + 1/s2): Harmonic mean, emphasizes the smaller slope.
• GM(s1,s2) = sqrt(s1 × s2): Geometric mean, balances both slopes proportionally.
• RMS(s1,s2) = sqrt((s1² + s2²) ÷ 2): Root-mean-square, emphasizes the larger slope.
• L2 = sqrt(s1² + s2²): Euclidean norm, the vector length of both slopes combined.
________________________________________
Slope Blends
• Quadratic weighting: s_quad = s0 × ((V−L)² + (H−V)²) ÷ (ΔP²)
• Tilted slope: s_tilt = s0 × (0.5 + λ)
• Entropy-scaled slope: s_ent = s0 × H2(λ), with H2(λ) = −
________________________________________
Curvature & Liquidity Extensions
• π-arc × λ: s_arc = sπ × λ
• Liquidity-π: s_piV = sπ × (V ÷ Mid)
________________________________________
Scale-Normalized Families
With k = sqrt(H ÷ L):
• k (scale factor) = sqrt(H ÷ L)
• s_comp = s0 ÷ k: compressed slope candidate
• s_exp = s0 × k: expanded slope candidate
• Exponentiated blends:
- s_kλ = s0 × k^(2λ−1)
- s_φλ = s0 × φ^(2λ−1), with φ = golden ratio ≈ 1.618
- s_√2λ = s0 × (√2)^(2λ−1)
________________________________________
Practical Application
All formulas generate liquidity-weighted price-per-bar ratios that integrate range, time, and VPOC placement.
These values are designed for:
• Chart compression settings
• Testing harmonic alignments across swings
• Liquidity-aware scaling experiments
________________________________________

Inside Candle DivergenceStudy Material: Inside Candle Divergence Indicator (aiTrendview)
1. Introduction
The Inside Candle Divergence Indicator is a custom tool built on TradingView using Pine Script. It is designed to help traders identify potential reversal points or trend continuations using a mix of candlestick analysis, RSI (Relative Strength Index), VWAP (Volume Weighted Average Price), Pivot Points, and Volume analytics. The tool also provides a dashboard table on the chart, summarizing all key values in a single glance for traders and analysts.
This indicator is not just a signal generator but also an educational framework—explaining how different concepts in technical analysis combine to build a systematic approach for market entries and exits.
________________________________________
2. Core Concepts Behind the Tool
A. Inside Candle Pattern
An Inside Candle forms when the current candle’s high is lower than or equal to the previous candle’s high, and the low is higher than or equal to the previous candle’s low.
• This means the entire price action of the current candle is "inside" the range of the previous candle.
• A bullish inside candle occurs when the close is higher than the open.
• A bearish inside candle occurs when the close is lower than the open.
This pattern shows market indecision but also sets up potential breakouts or trend reversals.
________________________________________
B. RSI (Relative Strength Index)
The indicator calculates RSI using the formula from the ta.rsi() function in TradingView. RSI helps measure momentum in the market.
• A low RSI (below 25) signals an oversold zone → possible buy.
• A high RSI (above 75) signals an overbought zone → possible sell.
By combining RSI with the Inside Candle, the indicator ensures that signals are triggered only when momentum and price patterns confirm each other.
________________________________________
C. Buy & Sell Signals
• Buy Signal: Triggered when RSI < Buy Level (default 25) and a bullish inside candle forms.
• Sell Signal: Triggered when RSI > Sell Level (default 75) and a bearish inside candle forms.
When triggered, the chart displays a BUY (green label below candle) or SELL (red label above candle) marker. The indicator also saves the entry price and signal bar for future reference inside the dashboard.
________________________________________
D. VWAP (Volume Weighted Average Price)
VWAP is calculated using the typical price (H+L+C)/3 and weighting it by volume.
• VWAP shows the average trading price weighted by volume, widely used by institutions.
• The tool calculates the distance of price from VWAP in % terms.
• If price is far above VWAP, the market may be overheated (overbought). If far below, it may be undervalued (oversold).
________________________________________
E. Volume Analysis
The tool splits volume into Buy Volume and Sell Volume:
• Buy Volume: If close > open.
• Sell Volume: If close ≤ open.
• Cumulative totals are maintained, and percentages are calculated to show what proportion of total market volume is bullish vs bearish.
• A progress bar style visual (using blocks █) shows the dominance of buyers or sellers.
This allows traders to quickly measure whether buyers or sellers are controlling the market trend.
________________________________________
F. Daily Pivot Points
Pivot Points are calculated using the previous day’s high, low, and close:
• Pivot = (High + Low + Close) / 3
• R1, S1, R2, S2, R3, S3 levels are derived from this pivot.
• These levels act as support and resistance zones.
The script plots Pivot, R1, and S1 lines on the chart for easy reference.
________________________________________
G. Trend Direction
The indicator checks where the price is compared to R1 and S1:
• If price > R1 → Bullish Trend
• If price < S1 → Bearish Trend
• Otherwise → Neutral Trend
The trend direction is displayed in the dashboard with arrows (↑, ↓, →).
________________________________________
H. Price Change Calculation
The tool calculates:
• Price Change = Current Close – Previous Close
• Percentage Change = (Change / Previous Close) × 100
• Displays ▲ (green upward) or ▼ (red downward) with the exact percentage.
This gives traders a quick snapshot of intraday price movement.
________________________________________
I. Dashboard Table
One of the most powerful features is the real-time dashboard table shown on the chart. It contains:
1. Symbol & Price Info (Current ticker, price, change %)
2. RSI Reading (with color coding: green for oversold, red for overbought)
3. VWAP and Distance from VWAP
4. Volume Analysis with Progress Bar (Buy vs Sell %)
5. Pivot Levels (Pivot, R1, S1)
6. Trend Direction (Bullish, Bearish, Neutral)
7. Signal Status (Last Buy/Sell signal with entry price)
This reduces the need for multiple indicators and gives traders a command-center view directly on the chart.
________________________________________
J. Alerts
The tool generates alerts whenever a Buy or Sell condition is met. Traders can set up TradingView alerts to be notified instantly when:
• Buy Signal Alert → RSI oversold + Bullish inside candle
• Sell Signal Alert → RSI overbought + Bearish inside candle
This ensures no opportunity is missed even if you’re not actively monitoring the chart.
________________________________________
K. Background Highlights
The chart background also changes faintly (light green or light red) when a Buy or Sell condition is triggered. This gives traders visual confirmation along with signals and alerts.
________________________________________
3. Practical Use of This Tool
• Scalpers & Intraday Traders can use it for quick momentum-based entries.
• Swing Traders can use the RSI + Inside Candle + Pivot Points to find medium-term reversals.
• Analysts can use the dashboard for real-time summaries in reports.
• Volume Analysis helps understand institutional activity.
Remember: This is not a standalone holy grail. It must be used with proper risk management and confirmation from higher timeframes.
________________________________________
4. Strict Disclaimer (aiTrendview)
⚠️ Disclaimer from aiTrendview:
This indicator is designed for educational and analytical purposes only. It is not financial advice or a guaranteed trading strategy. Markets are inherently risky and unpredictable; past performance of indicators does not ensure future results. Trading involves risk of financial loss, and traders must use proper risk management, stop-loss, and independent judgment.
aiTrendview strictly follows TradingView.com rules and compliance guidelines.
Any misuse of this tool, its code, or analytical features for unauthorized commercial purposes, false promises, or misleading activities is strictly discouraged. The creators of this script and aiTrendview will not be responsible for any losses, damages, or misuse arising from its application. Always trade responsibly and only with money you can afford to lose.
________________________________________
