UTS CORE + BOS + CHOCH – RR/TP/SL 📊 Indicator Working Principle
### 🔹 1. BOS (Break of Structure)
* **Definition:** Occurs when the price breaks the previous swing high or swing low level.
* **Interpretation:**
* If the last high is broken upwards → **Bullish BOS** (confirmation of uptrend).
* If the last low is broken downwards → **Bearish BOS** (confirmation of downtrend).
---
### 🔹 2. CHOCH (Change of Character)
* **Definition:** Indicates a trend reversal.
* **Interpretation:**
* In an uptrend, if the last low is broken downwards → **CHOCH↓** (start of downtrend).
* In a downtrend, if the last high is broken upwards → **CHOCH↑** (start of uptrend).
* **Chart:** Blue “CHOCH↑” labels on the chart mark trend reversals.
---
### 🔹 3. FVG (Fair Value Gap)
* **Definition:** A price gap formed between 3 candles.
* **Logic:**
* If the low of one candle stays above the high of the candle two bars back, a gap is created.
* Price tends to return to these gaps to “fill” them.
* **Chart:** The indicator highlights these gaps automatically (green/purple lines).
---
### 🔹 4. Signal Generation (BUY / SELL)
* A valid BOS or CHOCH confirmation + presence of FVG → **signal is triggered.**
* **Rules:**
* Upward break → **BUY signal**
* Downward break → **SELL signal**
* **Chart:** Red “SELL” and green “BUY” labels represent these trade signals.
---
### 🔹 5. RR – TP/SL Management
* When a trade is opened, the indicator automatically calculates **Entry, Stop Loss (SL), and Take Profits (TP1, TP2, TP3).**
* **Risk/Reward ratios:**
* TP1 = 1R
* TP2 = 2R
* TP3 = 3R
* If TP1 is hit and “Breakeven” option is enabled → SL moves to entry (risk-free trade).
---
👉 In short: this indicator tracks **market structure (BOS/CHOCH)**, detects **imbalances (FVG)**, and combines them with **risk/reward management (TP/SL)** to give you a ready-made trade
Candlestick analysis

First X Days Of A YearFirst X-Day Indicator
Overview
The "First X-Day Indicator" is a powerful tool to visualize and analyze market sentiment during the crucial first trading days of each new year. It provides immediate visual feedback on whether the year is starting with positive or negative momentum compared to the previous year's close, a concept often related to market theories like the "January Effect" or the "First Five Days Rule."
The indicator is designed to be clean, intuitive, and fully customizable to fit your charting style.
Key Features
Yearly Baseline: Automatically draws a horizontal line at the previous year's closing price. This line serves as a clear 0% reference for the current year's performance.
Dynamic Background Coloring: For a user-defined number of days at the start of the year, the chart background is colored daily. Green indicates the close is above the previous year's close, while red indicates it's below.
Final Performance Symbol: At the end of the analysis period (e.g., on the 5th day), a single summary symbol (like 👍 or 👎) appears. This symbol represents the final performance outcome of the initial trading period.
Settings & Customization
You have full control over all visual elements:
Analysis Period: Define exactly how many days at the start of the year you want to analyze (e.g., 3, 5, or 10 days).
Line Customization: Fully control the yearly baseline's appearance. You can change its color, width, and style (Solid, Dashed, or Dotted) or hide it completely.
Symbol Customization: Choose any character or emoji for the positive and negative performance symbols. You can also adjust their size (Small, Normal, Large) or hide them.
Background Control: Enable or disable the daily background coloring and select your preferred custom colors for positive and negative days.

Previous session High/Low – Asia London USA Overview
This indicator automatically plots the Previous Day’s (PD) session Highs and Lows for the Asia (Tokyo), London, and USA (New York) trading sessions.
Each session is color-coded for clarity:
🟩 Asia (Green)
🟥 London (Red)
🟦 USA (Blue)
At the close of each session, the indicator records that session’s high and low, draws horizontal lines across the chart, and labels them neatly in the center of each range — above the high and below the low for perfect visual balance.
⚙️ How It Works
The script continuously tracks the current high and low within each session.
When a session closes, those values are locked in as the PD High and PD Low.
Clean lines and centered labels are drawn immediately.
The labels automatically offset slightly above or below the line to avoid overlap, with user-controlled spacing.
This helps traders quickly identify where price interacts with the previous session’s structure, a core concept for many session-based and liquidity-based strategies.
🧭 Sessions and Timezones
Each market session runs in its native timezone, so you can align them perfectly to your chart or your preferred trading hours:
Asia Session: Default 08:30 – 11:00 (Australia/Adelaide time)
London Session: Default 08:00 – 10:00 (Europe/London)
USA Session: Default 09:30 – 16:00 (America/New_York)
You can change each session’s hours and timezone from the Inputs panel.
🎨 Customization
In the Inputs menu you can:
Toggle each session on or off
Choose line color and thickness
Enable or disable labels
Adjust vertical offset (ticks) for label spacing
“High label offset” – moves label further above the high line
“Low label offset” – moves label further below the low line
These adjustments make it easy to keep charts clean and readable on any instrument or timeframe.
📈 Practical Use
This indicator is ideal for:
Session traders who mark PD Highs/Lows as liquidity zones
London or NY session scalpers who watch for breakouts, fakeouts, or reversals
ICT / Smart Money Concepts users wanting automatic session reference levels
Anyone wanting a quick visual map of inter-session structure

Aynet- True Wick Projector for Non-Standard ChartsTechnical Explanation: "Data Projection and Synchronization"
This script is, at its core, a "data projection" tool. The fundamental technical problem it solves is compensating for the information loss that occurs when using different data visualization models.
1. The Core Problem: Information Loss
Standard Charts (Time-Based): Normal candlesticks are time-based. Each candle represents a fixed time interval (like 1 hour or 1 day) and displays the complete Open, High, Low, and Close (OHLC) data for that period. The "wicks" show the volatility and the extreme price points (the High and Low).
Non-Standard Charts (Price/Momentum-Based): Charts like Kagi, Renko, or Line Break filter out time. Their only concern is price movement. While one Renko box or Kagi line is forming, 10 or more time-based candles might have formed in the background. During this "noise filtering" process, the true high and low values (the wicks) from those underlying candles are lost.
The problem is this: A trader looking at a non-standard chart cannot see how high or low the price actually went while that block or line was forming. This is a critical loss of information regarding market volatility, support/resistance levels, and price rejection.
2. The Technical Solution: A "Dual Data Stream"
This script intelligently combines two different data streams to compensate for this information loss:
Main Stream (Current Chart): The open and close data from your active Kagi, Renko, etc., chart.
Secondary Stream (Projected Data): The high and low data from the underlying standard (time-based) chart.
3. The Code's Methodical Steps
Step 1: Identifying the Data Source (syminfo...)
This step precisely identifies the source for the secondary data stream. By using syminfo.prefix + ":" + syminfo.ticker (e.g., "NASDAQ:AAPL"), it guarantees that the data is pulled from the exact correct instrument and exchange.
Step 2: Data Request & "Lookahead" Synchronization (request.security)
This is the most critical part of the operation.
request.security(...): This is the function Pine Script uses to pull data from another dataset (the secondary stream) onto the current chart.
: This tells the function, "The only data I care about is the 'High' and 'Low' of the standard candle from that timeframe."
lookahead = barmerge.lookahead_on (The Critical Key): This command solves the "time paradox."
Normally (without this): request.security fetches data from the last completed bar. But as your Kagi bar is currently forming, the standard candle is also currently forming. This would cause the data to always be one bar behind (lag).
With lookahead_on: This permits the script to "look ahead" at the data from the currently forming, incomplete standard bar. Because of this, as your Kagi bar moves, the true wick data is updated in real-time. This achieves real-time synchronization.
Step 3: Visual Engineering (plotcandle)
After the script retrieves the data, it must "draw" it. However, it only wants to draw the wicks, not the candle bodies.
bodyTop and bodyBottom: First, it finds the top and bottom of the current Kagi bar's body (using math.max(open, close)).
Plotting the Upper Wick (Green):
It calls the plotcandle function and instructs it to draw a fake candle.
It fixes this fake candle's Open, Low, and Close (open, low, close) values to the top of the Kagi bar's body (bodyTop).
It only sets the High (high) value to the realHigh it fetched with request.security.
The result: A wick is drawn from the bodyTop level up to the realHigh level, with no visible body.
Plotting the Lower Wick (Red):
It applies the reverse logic.
It fixes the fake candle's Open, High, and Close values to the bottom of the Kagi bar's body (bodyBottom).
It only sets the Low (low) value to the realLow.
The result: A lower wick is drawn from bodyBottom down to realLow.
Invisibility (color.new(color.white, 100)):
In both plotcandle calls, the color (body color) and bordercolor are set to 100 transparency. This makes the "fake" candle bodies completely invisible, leaving only the colored wicks.
Conclusion (Technical Summary)
This script reclaims the volatility data (the wicks) that is naturally sacrificed by non-standard charts.
It achieves this with technical precision by creating a secondary data stream using request.security and synchronizing it with zero lag using the lookahead_on parameter.
Finally, it intelligently manipulates the plotcandle function (by creating invisible bodies) to project this lost data onto your Kagi/Renko chart as an "augmented reality" layer. This allows a trader to benefit from the clean, noise-filtered view of a non-standard chart without losing access to the full picture of market volatility.
Asia Session 2h (8PM–10PM EST, Today Only)This indicator automatically highlights the first 2 hours of the Asia trading session (8:00 PM – 10:00 PM EST) with a transparent teal box. It updates daily and only displays the current day’s session for a clean chart appearance.
Features:
Marks the Asia session open range (8–10 PM EST).
Automatically adjusts each day.
Works on any timeframe.
No clutter — only shows today’s box.
Ideal for traders who want to track Tokyo/Asia session volatility or identify key breakout zones before the London open.

Dot traderInterpret Signals: Green triangles indicate buy (e.g., if BTC holds $109k with bullish crossover); red triangles indicate sell (e.g., if it breaks $108k with bearish divergence).
Candle Colors: Green/bullish, red/bearish, orange/overbought (>70 RSI), blue/oversold (<30 RSI).
Alerts: Enable in TradingView for real-time notifications.
X rVPoCOverview
The rVPoC indicator isolates and displays the Volume Point of Control — the price level within a chosen lookback window that has accumulated the highest traded volume.
Unlike typical volume profiles that analyze an entire session or day, this version is designed for rolling intraday precision. It continually updates the VPoC using data from a lower “zoomed-in” timeframe (e.g., 1-minute) to refine accuracy, even when viewed on higher-timeframe charts.
How It Works
At its core, the indicator “zooms in” via Pine Script’s multi-timeframe engine:
Lower timeframe aggregation:
A secondary (zoomed) timeframe — by default 1-minute — is used to pull detailed OHLCV data through request.security().
Rolling window analysis:
The user-defined bars_per_current parameter determines how many of those lower-timeframe bars to include (e.g., 15 → a 15-minute rolling window).
Volume binning:
The high-to-low range of that window is divided into evenly spaced price bins (vp_price_levels). Each bin accumulates the volume of trades overlapping its range.
Point of Control selection:
The bin with the greatest accumulated volume is located, and its volume-weighted midpoint is plotted as the VPoC.
Visual output:
Discrete line-break markers are plotted for each bar, preventing the “connecting line” distortions common in continuous plots.
Use Case
This indicator is ideal for intraday traders who want to:
Track how the most active traded price shifts over time.
Identify short-term value zones forming within a 15-minute (or custom) rolling range.
Observe micro-structure behavior during developing sessions without committing to full volume profile tools.
Overlay a lightweight VPoC on top of other tools such as open-range or VWAP-based frameworks.
It is particularly effective on 1-minute and 5-minute charts, providing a granular yet efficient measure of volume concentration that updates bar-by-bar.
Summary
The VPoC indicator delivers a continuously updating micro-profile of where trading volume is most active within a chosen intraday window.
It’s designed to complement range, VWAP, and order-flow analysis by highlighting evolving value zones without visual clutter or session-anchoring logic.
Traders can interpret shifts in the VPoC as changes in short-term control — where buyers or sellers are concentrating their activity within the evolving price structure.

[LTS] Marubozu Candle StrategyOVERVIEW
The Marubozu Candle Strategy identifies and trades wickless candles (Marubozu patterns) with dynamic take-profit and stop-loss levels based on market volatility. This indicator combines traditional Japanese candlestick pattern recognition with modern volatility-adjusted risk management and includes a comprehensive performance tracking dashboard.
A Marubozu candle is a powerful continuation pattern characterized by the complete absence of wicks on one side, indicating strong directional momentum. This strategy specifically detects:
- Bullish Marubozu: Close > Open AND Low = Open (no lower wick)
- Bearish Marubozu: Close < Open AND High = Open (no upper wick)
When price returns to test these levels, the indicator generates trading signals with predefined risk-reward parameters.
CORE METHODOLOGY
Detection Logic:
The script scans each bar for Marubozu formations using precise price comparisons. When a wickless candle appears, a horizontal line extends from the opening price, marking it as a potential support (bullish) or resistance (bearish) level. These levels remain active until price touches them or until the maximum line limit is reached.
EMA Filter (Optional):
An exponential moving average filter enhances signal quality by requiring proper trend alignment. For bullish signals, price must be above the EMA when touching the level. For bearish signals, price must be below the EMA. This filter reduces counter-trend trades and improves win rates in trending markets. Users can disable this filter for range-bound conditions.
Dynamic Risk Management:
The strategy employs ATR-based (Average True Range) position sizing rather than fixed point values. This approach adapts to market volatility automatically:
- In low volatility: Tighter stops and targets
- In high volatility: Wider stops and targets proportional to market movement
Default settings use a 2:1 reward-to-risk ratio (1x ATR for take-profit, 0.5x ATR for stop-loss), but users can adjust these multipliers to match their trading style.
HOW IT WORKS
Step 1 - Pattern Detection:
On each bar, the indicator evaluates whether the candle qualifies as a Marubozu by comparing the high, low, open, and close prices. When detected, the opening price becomes the key level.
Step 2 - Level Management:
Horizontal lines extend from each Marubozu's opening price. The indicator maintains two separate arrays: one for unbroken levels (actively extending) and one for broken levels (historical reference). Users can configure how many of each type to display, preventing chart clutter while maintaining relevant context.
Step 3 - Signal Generation:
When price returns to touch a Marubozu level, the indicator evaluates the EMA filter condition. If the filter passes (or is disabled), the script draws TP/SL boxes showing the expected profit and loss zones based on current ATR values.
Step 4 - Trade Tracking:
Each valid signal enters the tracking system, which monitors subsequent price action to determine outcomes. The script identifies whether the take-profit or stop-loss was hit first (discarding trades where both trigger on the same candle to avoid ambiguous results).
PERFORMANCE DASHBOARD
The integrated dashboard provides real-time strategy analytics to automatically convert results to dollar values for any instrument:
Tracked Metrics:
- Total Trades: Complete count of closed positions
- Wins/Losses: Individual counts with color coding
- Win Rate: Success percentage with dynamic color (green >= 50%, red < 50%)
- Total P&L: Cumulative profit/loss in dollars
- Avg Win: Mean dollar amount per winning trade
- Avg Loss: Mean dollar amount per losing trade
NOTE: The dollar values shown in the dashboard are for trading only a single share/contract/etc. You will need to manually multiply those numbers by the amount of shares/contracts you are trading to get a true value.
The dollar conversion works automatically across all markets:
- Futures contracts (ES, NQ, CL, etc.) use their contract specifications
- Forex pairs use standard lot calculations
- Stocks and crypto use their respective point values
This eliminates manual calculation and provides immediate performance feedback in meaningful currency terms.
CUSTOMIZATION OPTIONS
ATR Settings:
- ATR Period: Lookback length for volatility calculation (default: 14)
- TP Multiplier: Take-profit distance as multiple of ATR (default: 3.0)
- SL Multiplier: Stop-loss distance as multiple of ATR (default: 1.5)
EMA Settings:
- EMA Length: Period for trend filter calculation (default: 9)
- Use EMA Filter: Toggle trend confirmation requirement (default: enabled)
Visual Settings:
- Bullish Color: Color for long signals and wins (default: green)
- Bearish Color: Color for short signals and losses (default: red)
- EMA Color: Color for trend filter line (default: orange)
- Line Width: Thickness of Marubozu level lines (1-5, default: 2)
- EMA Width: Thickness of EMA line (1-5, default: 2)
Line Management:
- Max Unbroken Lines: Limit for active extending lines (default: 10)
- Max Broken Lines: Limit for historical touched lines (default: 5)
Dashboard Settings:
- Show Dashboard: Toggle performance display on/off
- Dashboard Position: Corner placement (4 options)
- Dashboard Size: Text size selection (Tiny/Small/Normal/Large)
HOW TO USE
1. Add the indicator to your chart
2. Adjust ATR multipliers based on your risk tolerance (higher values = more conservative)
3. Configure the EMA filter based on market conditions (enable for trending, disable for ranging)
4. Set line limits to match your visual preference and chart timeframe
5. Monitor the dashboard to track strategy performance in real-time
6. Use the TP/SL boxes as reference levels for manual trades or automation
Best Practices:
- Enable EMA filter in strongly trending markets
- Disable EMA filter if you want more trade signals but at lower quality
- Increase ATR multipliers in highly volatile markets
- Decrease ATR multipliers for tighter, more frequent trades
- Review avg win/loss ratio to ensure positive expectancy
UNIQUE FEATURES
Unlike basic Marubozu detectors, this strategy provides:
1. Automatic level tracking with memory management
2. Volatility-adjusted risk parameters instead of fixed values
3. Optional trend confirmation via EMA filter
4. Real-time performance analytics with automatic dollar conversion
5. Separate tracking of wins/losses with individual averages
6. Configurable visual display to prevent chart clutter
7. Complete transparency with all logic visible in open-source code

Timeframe LiquidityTimeframe Liquidity – Multi-Timeframe Highs & Lows by
Timeframe Liquidity automatically plots previous day, week, month, and year highs and lows, key liquidity zones used by smart money and price-action traders. These levels extend into the future and can automatically stop once price wicks through, showing clear liquidity sweeps and tested zones.
Perfect for traders using ICT / SMC concepts, liquidity theory, or market structure analysis. Instantly see where liquidity rests, where it’s been taken, and how price reacts at major support and resistance.
Features:
Auto-plots PDH/PDL, PWH/PWL, PMH/PML, PYH/PYL
Custom line styles, colors, and label sizes
Option to stop line on wick (liquidity sweep)
Smart timeframe visibility (hides same-TF levels)
Accurate UTC offset handling
Identify liquidity pools fast, trade cleaner charts, and track where smart money hunts liquidity.
Built for precision, clarity, and confluence.

Ticker Info & Look-Ahead Lines (W/D)This versatile Pine Script indicator for trading views clearly displays current chart information and predicts and plots important future timeframe boundaries (next week, the day after tomorrow, etc.).
Key Features of the Indicator 📈
This indicator is divided into three main sections:
1. Ticker/Timeframe Display
Clearly displays the current ticker and timeframe on the chart.
Customization: You can set the display position (top/middle/bottom, left/center/right), font size, default text color, and background color.
Auto Color by Timeframe: The text color automatically changes depending on the timeframe, allowing you to quickly visually grasp the current timeframe.
2. Weekly Look-Ahead Lines
Predicts the start times of the next week and the week after from the time the current bar is determined, and plots them as vertical lines on the chart.
Display Control: You can toggle the visibility of individual lines.
Style: You can set the line color and style (dotted, dashed, solid).
Maximum Number of Lines Displayed: You can control the number of previously drawn lines to retain (consumes two lines per set).
💡 Daily Chart Specific Filter
When viewing a daily chart, this filter hides all past weekly lines and displays only the most recent two (the lines for the following week and the week after). This significantly reduces the visual noise on the daily chart.
3. Daily Look-Ahead Lines
These lines predict the start times of the next and the day after tomorrow from the time the current bar is determined, and are drawn as vertical lines on the chart.
Display Control/Style: As with weekly lines, you can set the visibility, color, and style of lines.
Maximum Number of Lines Displayed: You can control the number of previously drawn lines to retain (consumes two lines per set).
4. Master Timeframe Filter
This is a master ON/OFF switch that centrally manages the automatic hiding of both weekly and daily lines except for the appropriate timeframe.
Auto-hide Daily Lines: When displaying a chart with a timeframe greater than the line's base timeframe, such as a daily, weekly, or monthly chart, the daily lines will be automatically hidden.
Auto-hide Weekly Lines: When displaying a weekly or monthly chart, the weekly lines will be automatically hidden.
This feature allows you to clearly see the leading lines when analyzing shorter timeframes, while preventing the chart from becoming cluttered with lines when switching to longer timeframes (daily or longer).
このインジケーターは、現在のチャート情報を明確に表示し、さらに将来の重要な時間軸の区切り(翌週、明後日など)を予測して描画する機能を持つ、トレーディングビュー用の多機能な Pine Script インジケーターです。
インジケーターの主要機能 (Key Features) 📈
このインジケーターは、以下の3つの主要なセクションに分かれています。
1. 銘柄・時間足情報表示 (Ticker/Timeframe Display)
チャート上に現在の銘柄名 (Ticker) と時間足 (Timeframe) を分かりやすく表示します。
カスタマイズ: 表示位置(上/中/下、左/中央/右)、文字サイズ、デフォルトの文字色、背景色を設定できます。
時間足別自動カラー: 時間足に応じて文字色が自動的に変わるオプションがあり、現在の時間足を視覚的に素早く把握できます。
2. 週足先行ライン (Weekly Look-Ahead Lines)
現在の足が確定した時点から見た、翌週と再来週の開始時刻を予測し、チャートに垂直線として描画します。
表示制御: ラインの表示/非表示を個別に切り替えられます。
スタイル: ラインの色とスタイル(点線、破線、実線)を設定できます。
最大表示本数: 過去に描画されたラインを何本まで保持するかを制御できます(1組あたり2本消費)。
💡 日足チャート限定フィルター (Daily Chart Specific Filter)
特に日足チャートを表示しているときに、過去の週足ラインをすべて非表示にし、直近の2本(翌週と再来週のライン)のみを表示するフィルター機能があります。これにより、日足チャートの視覚的なノイズを大幅に減らせます。
3. 日足先行ライン (Daily Look-Ahead Lines)
現在の足が確定した時点から見た、翌日と明後日の開始時刻を予測し、チャートに垂直線として描画します。
表示制御・スタイル: 週足ラインと同様に、ラインの表示/非表示、色、スタイルを設定できます。
最大表示本数: 過去のライン保持数を制御できます(1組あたり2本消費)。
4. 時間足フィルター一括制御 (Master Timeframe Filter)
週足ラインと日足ラインの両方に対し、適切な時間足以外での自動非表示を一括で管理するマスターON/OFFスイッチです。
日足ラインの自動非表示: 日足、週足、月足チャートなど、ラインの元となる時間足以上のチャートを表示している場合、日足ラインを自動で非表示にします。
週足ラインの自動非表示: 週足、月足チャートを表示している場合、週足ラインを自動で非表示にします。
この機能は、短期足での分析時には先行ラインを明確に見せつつ、長期足(日足以上)に切り替えた際にチャートが線で cluttered になるのを防ぎます。

CHOCH + FVG Signals [30m Optimized]CHOCH + FVG Signals
🎯 What It Does:
This script automatically scans your chart for high-probability Smart Money Concepts (SMC) setups based on two key institutional trading principles:
Change of Character (CHOCH) – A shift in market structure signaling potential reversal
Fair Value Gap (FVG) – An imbalance zone where price moved too fast, often acting as support/resistance
When both conditions align, the script plots clear Buy (▲) and Sell (▼) signals directly on your chart — ideal for intraday trading on the 30-minute timeframe (but works on any timeframe).
✅ Key Features:
🔹 Visual Fair Value Gaps
Green shaded zones = Bullish FVGs (potential support)
Red shaded zones = Bearish FVGs (potential resistance)
Toggle on/off in settings
🔹 Smart CHOCH Detection
Detects breaks of recent swing highs/lows with proper context
Avoids false signals by confirming prior price structure
🔹 Clear Trade Signals
Green ▲ below bar = Buy signal (Bullish CHOCH + FVG confluence)
Red ▼ above bar = Sell signal (Bearish CHOCH + FVG confluence)
🔹 Customizable Filters
Option to require FVG for a signal (recommended for higher accuracy)
Adjust sensitivity via swing detection settings (default optimized for 30m)
🔹 Alert-Ready
Built-in alert conditions for instant notifications on TradingView mobile/desktop
⚙️ How to Use:
Apply to a 30-minute chart (e.g., EURUSD, Gold, NAS100, BTC)
Wait for at least 50–100 bars to load (so swing points appear)
Look for:
A green triangle (▲) → consider long entry near FVG support
A red triangle (▼) → consider short entry near FVG resistance
Confirm with price action: Wait for a strong candle close or rejection at the FVG zone
Use stop-loss below/above the FVG and target recent liquidity pools
💡 Pro Tip: Best used during high-volume sessions (e.g., London Open 7–10 AM UTC, NY Open 12:30–3:30 PM UTC).
🛠️ Settings (Inputs):
Show Fair Value Gaps
✅ Enabled
Visualize FVG zones
Max FVG History
100 bars
Prevent chart clutter
Require FVG for Signal?
✅ Enabled
Higher-quality setups (disable to test CHOCH-only)
⚠️ Important Notes:
This is a signal generator, not financial advice. Always manage risk.
Works best in trending or breaking markets — avoid during low-volatility ranges.
FVGs may get filled (tested) before price continues — patience improves results.
Backtest on historical data before live trading.
📣 Ideal For:
Retail traders learning Smart Money Concepts (SMC)
Price action traders seeking institutional-level confluence
Intraday scalpers & swing traders on 30m–1H timeframes

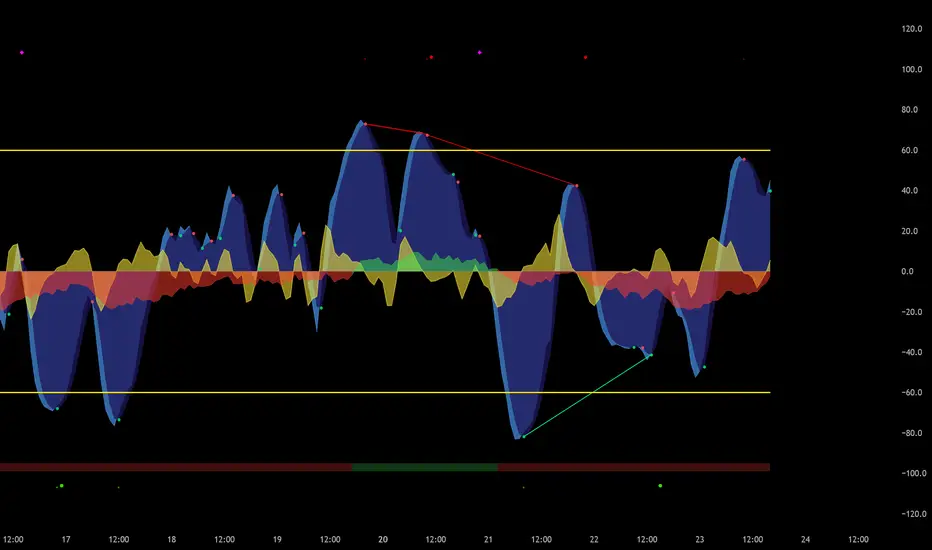
ten2 Cipher v.1Created and built by ten2crypto
This is not just another "Market Cipher" clone. This is my personal, ground-up build of a comprehensive momentum and divergence toolkit, designed to provide a deeper, more nuanced view of the market. The ten2 Cipher Divergence Engine combines the best aspects of classic momentum oscillators with a powerful, multi-layered divergence system.
This indicator was built for my own trading and is now being shared with the community.
Indian Gold Festival Dates HistoricalIndian Gold Festival Dates (1975-2025)
Marks 8 major Indian festivals associated with gold buying over 50 years of historical data. Essential for analyzing seasonal patterns and cultural demand cycles in gold markets.
Festivals Included:
Dhanteras (Gold) - Most auspicious gold buying day
Diwali (Orange) - Festival of Lights
Akshaya Tritiya (Green) - "Never-ending" prosperity
Dussehra (Red) - Victory and success
Makar Sankranti (Cyan) - Solar new year
Gudi Padwa (Magenta) - Hindu New Year (Maharashtra)
Ugadi (Purple) - Hindu New Year (South India)
Navratri (Yellow) - 9-day festival
Features:
✓ 408 exact historical dates (1975-2025)
✓ Color-coded vertical lines for easy identification
✓ Toggle individual festivals on/off
✓ Adjustable line width and labels
✓ Works on all timeframes (best on daily/weekly)
Perfect for traders analyzing gold seasonality, Indian market sentiment, and cultural demand patterns. Use on XAUUSD, GC1!, or Indian gold futures.

WorldCup Dashboard + Institutional Sessions© 2025 NewMeta™ — Educational use only.
# Full, Premium Description
## WorldCup Dashboard + Institutional Sessions
**A trade-ready, intraday framework that combines market structure, real flow, and institutional timing.**
This toolkit fuses **Institutional Sessions** with a **price–volume decision engine** so you can see *who is active*, *where value sits*, and *whether the drive is real*. You get: **CVD/Delta**, volume-weighted **Momentum**, **Aggression** spikes, **FVG (MTF)** with nearest side, **Daily Volume Profile (VAH/POC/VAL)**, **ATR regime**, a **24h position gauge**, classic **candle patterns**, IBH/IBL + **first-hour “true close”** lines, and a **10-vote confluence scoreboard**—all in one view.
---
## What’s inside (and how to trade it)
### 🌍 Institutional Sessions (Sydney • Tokyo • London • New York)
* Session boxes + a highlighted **first hour**.
* Plots the **true close** (first-hour close) as a running line with a label.
**Use:** Many desks anchor risk to this print. Above = bullish bias; below = bearish. **IBH/IBL** breaks during London/NY carry the most signal.
### 📊 CVD / Delta (Flow)
* Net buyer vs seller pressure with smooth trend state.
**Use:** **Rising CVD + acceptance above mid/POC** confirms continuation. Bearish price + rising CVD = caution (possible absorption).
### ⚡ Volume-Weighted Momentum
* Momentum adjusted by participation quality (volume).
**Use:** Momentum>MA and >0 → trend drive is “real”; <0 and falling → distribution risk.
### 🔥 Aggression Detector
* ROC × normalized volume × wick factor to flag **forceful** candles.
**Use:** On spikes, avoid fading blindly—wait for pullbacks into **aligned FVG** or for aggression to cool.
### 🟦🟪 Fair Value Gaps (with MTF)
* Detects up to 3 recent FVGs and marks the **nearest** side to price.
**Use:** Trend pullbacks into **bullish FVG** for longs; bounces into **bearish FVG** for shorts. Optional threshold to filter weak gaps.
### 🧭 24h Gauge (positioning)
* Shows current price across the 24h low⇢high with a mid reference.
**Use:** Above mid and pushing upper third = momentum continuation setups; below mid = sell the rips bias.
### 🧱 Daily Volume Profile (manual per day)
* **VAH / POC / VAL** derived from discretized rows.
**Use:** **POC below** supports longs; **POC above** caps rallies. Fade VAH/VAL in ranges; treat them as break/hold levels in trends.
### 📈 ATR Regime
* **ATR vs ATR-avg** with direction and regime flag (**HIGH / NORMAL / LOW**).
**Use:** HIGH ⇒ give trades room & favor trend following. LOW ⇒ fade edges, scale targets.
### 🕯️ Candle Patterns (contextual, not standalone)
* Engulfings, Morning/Evening Star, 3 Soldiers/Crows, Harami, Hammer/Shooting Star, Double Top/Bottom.
**Use:** Only with session + flow + momentum alignment.
### 🤝 Price–Volume Classification
* Labels each bar as **continuation**, **exhaustion**, **distribution**, or **healthy pullback**.
**Use:** Align continuation reads with trend; treat “Price↑ + Vol↓” as a caution flag.
### 🧪 Confluence Scoreboard & B/S Meter
* Ten elements vote: 🔵 bull, ⚪ neutral, 🟣 bear.
**Use:** Execution filter—take setups when the board’s skew matches your trade direction.
---
## Playbooks (actionable)
**Trend Pullback (Long)**
1. London/NY active, Momentum↑, CVD↑, price above 24h mid & POC.
2. Pullback into **nearest bullish FVG**.
3. Invalidate under FVG low or **true-close** line.
4. Targets: IBH → VAH → 24h high.
**Range Fade (Short)**
1. Asia/quiet regime, **Price↑ + Vol↓** into **VAH**, ATR low.
2. Nearest FVG bearish or scoreboard skew bearish.
3. Invalidate above VAH/IBH.
4. Targets: POC → VAL.
**News/Impulse**
Aggression spike? Don’t chase. Let it pull back into the aligned FVG; require CVD/Momentum agreement before entry.
---
## Alerts (included)
* **Bull/Bear Confluence ≥ 7/10**
* **Intraday Target Achieved** / **Daily Target Achieved**
* **Session True-Close Retests** (Sydney/Tokyo/London/NY)
*(Keep alerts “Once per bar” unless you specifically want intrabar triggers.)*
---
## Setup Tips
* **UTC**: Choose the reference that matches how you track sessions (default UTC+2).
* **Volume threshold**: 2.0× is a strong baseline; raise for noisy alts, lower for majors.
* **CVD smoothing**: 14–24 for scalps; 24–34 for slower markets.
* **ATR lengths**: Keep defaults unless your asset has a persistent regime shift.
---
## Why this framework?
Because **timing (sessions)**, **truth (flow)**, and **location (value/FVG)** together beat any single signal. You get *who is trading*, *how strong the push is*, and *where risk lives*—on one screen—so execution is faster and cleaner.
---
**Disclaimer**: Educational use only. Not financial advice. Markets are risky—backtest and size responsibly.

6am Candle High/Low Indicator with Highlight6am Candle High/Low Indicator with Highlight
6am Candle High/Low Indicator with Highlight
6am Candle High/Low Indicator with Highlight
6am Candle High/Low Indicator with Highlight 6am Candle High/Low Indicator with Highlight

Alerts Killzones + PD/WL/ML Levels (No Labels)This indicator automatically highlights the London and New York killzones and triggers alerts at key price levels — without adding any labels or text clutter to the chart.
Features:
Highlights London (10:00–13:00) and New York (15:00–17:00) sessions (GMT+3, Romania).
Draws and updates key levels automatically:
PDH / PDL – Previous Day High & Low
WH / WL – Previous Week High & Low
MH / ML – Previous Month High & Low
Alerts when price touches any of these levels.
Alerts at session opens and closes for both London and New York.
Clean interface – no labels or extra markers on chart.
Ideal for:
Traders who follow ICT concepts, session-based setups, or liquidity sweeps and want precise alerts without chart noise.

The Vishnu Zone Ver 2 by Dr. Sudhir Khollam## 📜 **The Vishnu Zone — Trade When the Brahma Zone Ends**
**Author:** Dr. Sudhir Khollam (SALSA© Method of Astrology & Market Psychology)
**Category:** Volatility Phase Detection / Bollinger Band Expansion Analysis
---
### 🔶 **Concept Overview**
In the **SALSA© Market Philosophy**, every market phase follows a cosmic rhythm —
* **Brahma Phase** represents *creation and expansion* (high volatility and strong directional movement).
* **Vishnu Phase** represents *maintenance and stability* (where expansion cools down and balanced opportunities appear).
**“The Vishnu Zone”** indicator identifies the exact moments when the **Brahma Phase ends** — signaling that the expansion has completed and the market is likely to enter a more stable, tradable state.
This is a **precision-timing indicator** that helps traders avoid entering at the end of impulsive phases and instead prepare for equilibrium-based trades (mean reversion, range setups, or steady trends).
---
### ⚙️ **How It Works**
The indicator measures **Bollinger Band Width (BBW)** to quantify expansion and contraction in volatility.
1. It calculates the **adaptive expansion threshold** using the average BBW over a rolling lookback period.
2. When the current BBW **drops below** this adaptive threshold **after being above it**, the script marks it as the **end of the Brahma Phase**.
3. This moment is shown visually as:
* 🕉 **“Vishnu” label** above the candle
* A **horizontal dotted line** extending for several bars
Together, these mark a **Vishnu Zone**, where the market transitions from expansion to consolidation — an ideal time for stabilization or entry planning.
---
### 📊 **Inputs & Settings**
| Parameter | Description |
| ---------------------------------- | ------------------------------------------------------------------------------ |
| **Bollinger Band Length** | The number of bars used for SMA and standard deviation (default 20). |
| **Bollinger Multiplier** | Determines the width of Bollinger Bands (default 2.0). |
| **Adaptive Lookback Period** | Rolling window to calculate the mean BBW for dynamic adjustment (default 150). |
| **Expansion Multiplier** | Multiplies the mean BBW to define the expansion threshold (default 1.35). |
| **Horizontal Line Extension Bars** | Number of bars to extend the Vishnu Zone line into the future (default 40). |
| **Show End-of-Brahma Labels?** | Toggle 🕉 labels on/off. |
| **Show Horizontal Lines?** | Toggle Vishnu Zone lines on/off. |
---
### 🔔 **Alerts**
When the **Brahma Phase ends**, the indicator triggers an alert:
> *“Brahma Phase Ends, Vishnu has taken over.”*
This helps traders receive real-time notification of volatility contraction and possible entry zones.
---
### 🧠 **Best Practices**
* Works effectively on **5-minute to 1-hour timeframes** for intraday trading.
* Best paired with **momentum or volume filters** to confirm trend exhaustion.
* Avoid entering during rapid expansion (Brahma phase). Wait for a Vishnu signal to ensure market stabilization.
---
### 🌌 **Philosophical Interpretation (SALSA© Principle)**
Just as Vishnu sustains the universe after Brahma’s creation, the market too enters a **maintenance phase** after every burst of expansion.
Recognizing this shift allows traders to align with **cosmic rhythm and price psychology**, not just technical metrics.
---
### 🧩 **Summary**
✅ Detects when expansion volatility ends
✅ Marks transition zones between impulsive and stable phases
✅ Sends real-time alerts
✅ Adaptive and self-adjusting across markets and assets
✅ Simple, clean visualization — ideal for disciplined trading
---
### ⚡ **Use Case**
Perfect for traders who:
* Prefer **low-risk entries** after volatility spikes
* Trade **mean reversion**, **range breakouts**, or **volatility collapses**
* Believe in the **cyclic nature of market energy**
---

Previous day high lowThis script Identifies and draw Previous day High low on 15 min Intra day chart
LANZ Origins🔷 LANZ Origins – Multi-Framework Liquidity, Structure & Risk Management Overlay
LANZ Origins is an advanced multi-framework visualization toolkit that unifies key institutional concepts into one efficient interface. Designed for professional traders, it merges session mapping, liquidity analysis, imbalance detection, multi-account risk control, and higher-timeframe candle tracing — all in a single overlay.
🧩 Core Components
🈵 Asian Range Liquidity
Automatically detects and projects the Asian session range (19:00–02:00 NY) with an optional mid-price line (50 %). This provides visual context for intraday liquidity and manipulation zones commonly referenced in ICT-style analysis.
📊 Imbalance Detector
Highlights Fair Value Gaps (FVG), Opening Gaps (OG), and Volume Imbalances (VI) directly on-chart, using separate color schemes for bullish and bearish inefficiencies. Each element can be customized by width, ATR filter, and extension length.
🕯️ Higher-Timeframe Candles (ICT Style)
Displays multi-timeframe candles (HTF1–HTF6) simultaneously — e.g., 5 m, 30 m, 1 h, 4 h, 1 D, 1 W — each rendered with independent wick, border, and fill settings. Includes remaining-time counters, timeframe labels, and optional imbalance shading between bodies.
📈 Market Structure (ZigZag 30 m)
Replicates 30-minute swing structure to all active timeframes, producing dynamic pivots with live extension. Ideal for contextualizing BOS/CHoCH events across multiple scales.
💸 Multi-Account Lot Size Panel
Calculates position size for up to five accounts simultaneously, using your defined capital, risk %, and fixed SL distance (in pips). Results appear in a clean table at the bottom-right corner of the chart.
🎨 Session Visualization
Colored backgrounds mark key trading phases:
🟢 Day division
🔴 No-action zone
🔵 Kill-zone
🟡 Hold session
⚙️ Customization & Performance
Every module can be toggled individually, with full color, opacity, and style control. The script is optimized for overlay use and supports up to 500 boxes, lines, and labels with efficient resource handling.
🧠 Best Use Case
LANZ Origins is ideal for traders who follow:
Smart Money Concepts / ICT methodology
Liquidity & Imbalance-based trading
Multi-timeframe confluence setups
Risk-based position sizing workflows
Use it to observe how price interacts with liquidity pools, higher-timeframe candles, and imbalances within key sessions — while monitoring lot size risk in real time.
📌 Recommended Setup
Timeframes: 30m - 5m – 3m
Pairs: FX
Session Timezone: New York (EST/EDT)
Combine with: LANZ Strategy series for execution and journaling
💬 Note
This indicator does not generate buy/sell signals. It’s a visual and analytical tool built to support your own decision-making process.

DCA Percent SignalOverview
The DCA Percent Signal Indicator generates buy and sell signals based on percentage drops from all-time highs and percentage gains from lowest lows since ATH. This indicator is designed for pyramiding strategies where each signal represents a configurable percentage of equity allocation.
Definitions
DCA (Dollar-Cost Averaging): An investment strategy where you invest a fixed amount at regular intervals, regardless of price fluctuations. This indicator generates signals for a DCA-style pyramiding approach.
Gann Bar Types: Classification system for price bars based on their relationship to the previous bar:
Up Bar: High > previous high AND low ≥ previous low
Down Bar: High ≤ previous high AND low < previous low
Inside Bar: High ≤ previous high AND low ≥ previous low
Outside Bar: High > previous high AND low < previous low
ATH (All-Time High): The highest price level reached during the entire chart period
ATL (All-Time Low): The lowest price level reached since the most recent ATH
Pyramiding: A trading strategy that adds to positions on favorable price movements
Look-Ahead Bias: Using future information that wouldn't be available in real-time trading
Default Properties
Signal Thresholds:
Buy Threshold: 10% (triggers every 10% drop from ATH)
Sell Threshold: 30% (triggers every 30% gain from lowest low since ATH)
Price Sources:
ATH Tracking: High (ATH detection)
ATL Tracking: Low (low detection)
Buy Signal Source: Low (buy signals)
Sell Signal Source: High (sell signals)
Filter Options:
Apply Gann Filter: False (disabled by default)
Buy Sets ATL: False (disabled by default)
Display Options:
Show Buy/Sell Signals: True
Show Reference Lines: True
Show Info Table: False
Show Bar Type: False
How It Works
Buy Signals: Trigger every 10% drop from the all-time highest price reached
Sell Signals: Trigger every 30% increase from the lowest low since the most recent all-time high
Smart Tracking: Uses configurable price sources for signal generation
Key Features
Configurable Thresholds: Adjustable buy/sell percentage thresholds (default: 10%/30%)
Separate Price Sources: Independent sources for ATH tracking, ATL tracking, and signal triggers
Configurable Signals: Uses low for buy signals and high for sell signals by default
Optional Gann Filter: Apply Gann bar analysis for additional signal filtering
Optional Buy Sets ATL: Option to set ATL reference point when buy signals occur
Visual Debug: Detailed labels showing signal parameters and values
Usage Instructions
Apply to Chart: Use on any timeframe (recommended: 1D or higher for better signal quality)
Risk Management: Adjust thresholds based on your risk tolerance and market volatility
Signal Analysis: Monitor debug labels for detailed signal information and validation
Signal Logic
Buy signals are blocked when ATH increases to prevent buying at peaks
Sell signals are blocked when ATL decreases to prevent selling at lows
This ensures signals only trigger on subsequent bars, not the same bar that establishes new reference points
Buy Signals:
Calculate drop percentage from ATH to buy signal source
Trigger when drop reaches threshold increments (10%, 20%, 30%, etc.)
Always blocked on ATH bars to prevent buying at peaks
Optional: Also blocked on up/outside bars when Gann filter enabled
Sell Signals:
Calculate gain percentage from lowest low to sell signal source
Trigger when gain reaches threshold increments (30%, 60%, 90%, etc.)
Always blocked when ATL decreases to prevent selling at lows
Optional: Also blocked on down bars when Gann filter enabled
Limitations
Designed for trending markets; may generate many signals in sideways/ranging markets
Requires sufficient price movement to be effective
Not suitable for scalping or very short timeframes
Implementation Notes
Signals use optimistic price sources (low for buys, high for sells), these can be configured to be more conservative
Gann filter provides additional signal filtering based on bar types
Debug information available in data window for real-time analysis
Detailed labels on each signal show ATH, lowest low, buy level, sell level, and drop/gain percentages

Scalp BTC/ETH — Reversal & Continuation (v1, Pine v6)Scalp BTC/ETH — Reversal & Continuation (1m à 10m)
Cet indicateur détecte des opportunités de micro-scalping sur futures (BTC/ETH) basées sur deux mécaniques courtes validées par structure de prix :
A) Reversal de pression (contre-mouvement contrôlé)
Détection d’une sur-extension brutale suivie d’une absorption sur la bougie suivante.
Objectif : capturer la première respiration après un excès de prix (rejet court).
B) Continuation courte (momentum + reprise)
Détection de 3 bougies directionnelles consécutives suivies d’un pullback léger, puis signal sur la reprise du mouvement initial.
Gestion intégrée (scénario standard TP dynamique)
TP1 → 50% de la position à un gain fixe (% adaptable au timeframe)
Stop déplacé au Break-Even sur le restant
Sortie finale sur bougie inverse significative
(correction ≥ X% du corps précédent) ou timeout (max bars en trade)
Scalp BTC/ETH — Reversal & Continuation (1m to 10m)
This indicator detects short-term futures scalping setups on BTC & ETH using two mechanical price-action models designed for fast execution:
A) Reversal Compression (counter-move entry)
Identifies a sharp impulse (overextension) followed by absorption / failure to extend on the next candle.
Objective: capture the first corrective pullback after exhaustion.
B) Controlled Continuation (momentum follow-through)
Identifies 3 consecutive trend candles, then a shallow pullback, and triggers an entry on the resumption of the main leg.
Built-in trade logic (dynamic TP structure)
TP1 → scale out 50% of the position at a fixed percentage (auto-scaled per timeframe)
Stop moved to Break-Even after TP1
Final exit on either:
• a meaningful opposite candle (≥ X% correction of prior body), or
• a timeout (max bars in trade)
Technical characteristics
Designed for 1m / 3m / 5m / 7m / 10m
No repainting (bar-close confirmed logic)
Works for both LONG & SHORT
Built-in alert events:
ENTRY_LONG / ENTRY_SHORT / TP1 / EXIT_STOP / EXIT_INVERSE / EXIT_TIMEOUT
Suitable for manual execution, semi-automation (alerts) or full bot integration (webhook JSON)
Purpose
Provide a repeatable, rule-based, non-subjective framework to harvest micro-moves with controlled risk, without relying on lagging indicators or long-term prediction.
(A Strategy / backtesting version is planned as a next iteration.)
