GK Zero-Lag Major BOS TrendGK ZERO-LAG Major BOS Trend
is a technical indicator designed to highlight breaks of structure BOS
in the direction of the prevailing trend
The script uses a zero-lag trend filter combined with confirmed structural high/low breaks to reduce noise and avoid minor or premature prints.
Print labels are only printed after candle close, ensuring stable, and confirmed prints
The indicator is designed to help traders identify trend continuation and structural shifts,
making it suitable as a confirmed tool across multiple markets and timeframes.
Best used on higher timeframes 5/15/30Min 2/3/4Hour
also resistance and support lines
Disclaimer
this indicator is provided for educational purposes only
Chart patterns

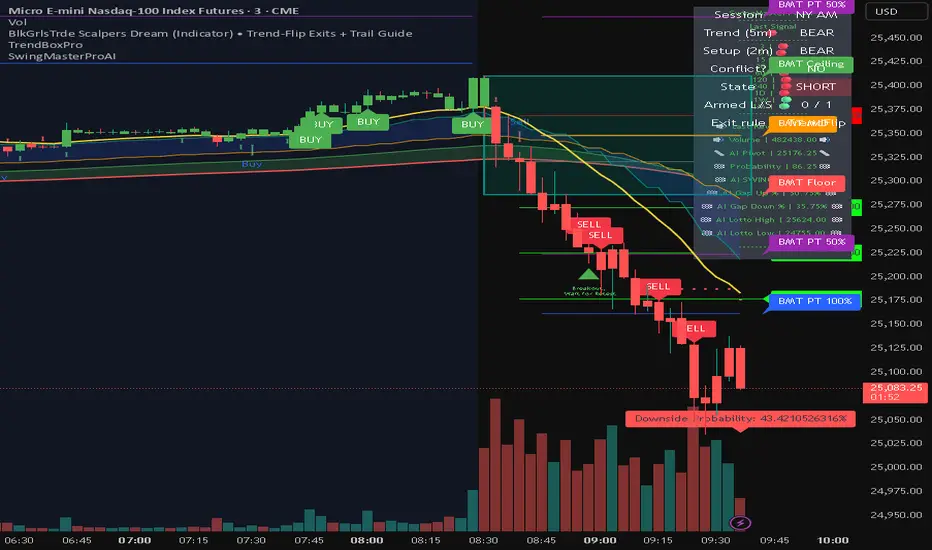
BlkGrlsTrde Scalpers DreamBlkGrlsTrde – Scalpers Dream (MNQ)
BlkGrlsTrde – Scalpers Dream is a discretionary scalping indicator designed specifically for Micro E-Mini Nasdaq (MNQ) traders who want clear, structured entries and exits without clutter or over-engineering.
This tool focuses on momentum continuation after key price reactions, helping traders stay aligned with higher-timeframe context while executing on lower timeframes such as the 1-minute chart.
What It Provides
Clear BUY and SELL signals for scalp entries
Structured trade levels with:
Stop level
TP1 (partial target)
TP2 (runner target)
Exit signals, including:
TP1 hit
TP2 hit
Stop hit
Exit on opposite signal
No-Trade (Conflict) state when conditions do not align, displayed clearly in gray so you know when to stand down
Session awareness for London, NY AM, and NY PM trading windows
On-chart status panel showing current market state at a glance
Designed For
MNQ scalpers
Traders who prefer structure but manual execution
Traders who want clarity over complexity
Live trading during active sessions without constant indicator stacking
How to Use
Best used on MNQ 1-minute charts
Take signals in the direction of the displayed bias
Manage risk using the plotted stop and targets
Stand aside during NO TRADE states
Use TP1 to reduce risk and TP2 for runners
This is an indicator, not an automated trading system. It is intended to support disciplined decision-making, not replace it.
Disclaimer
This indicator is for educational and informational purposes only. Trading futures involves substantial risk. Always manage risk appropriately and trade within your plan.
EBP Auto Fibonacci Drawer 👑 Daily EBP Trading Strategy (Final Refined Summary)
This is a daily price action strategy that combines a specific reversal candle (EBP) with a Fibonacci retracement for a confirmed trend continuation entry.
1. 🕯️ The Signal Candle (EBP Confirmation)
Wait for a single daily candle to close that meets two strict criteria:
Liquidity Sweep: The candle's low must first wick below the low of the preceding day.
Strong Reversal: The candle must then reverse and close above the high of the preceding day (confirming a strong move).
2. 📐 Fibonacci Retracement Setup
The Fibonacci Retracement tool is applied to the newly confirmed EBP Candle to define the retracement and entry zone for the next day.
Drawing the Fib (for a Buy Setup): Draw the Fib from the EBP Candle's Close to the EBP Candle's Low.
3. 🎯 Entry and Risk Management
The trade is executed on the next candle (Day 2) after the price retraces and then reverses, confirmed by a candle close.
Action Retracement & Entry Condition Stop Loss (SL) Placement Target (TP) Placement
Buy (Long) Price retraces into the Fib levels, and then the candle CLOSES above any of the key breakout levels: 0%, 25%, 50%, 75%, or 100%. Placed at the Most Recent Swing Low (The lowest point before the EBP candle's move). The EBP Candle's High Wick.
Sell (Short) (Inverse) Price retraces into the Fib levels, and then the candle CLOSES below any of the key breakout levels: 0%, 25%, 50%, 75%, or 100%. Placed at the Most Recent Swing High (The highest point before the EBP candle's move). The EBP Candle's Low Wick.
Export to Sheets
Key Takeaways:
Timeframe: Daily candles are used for all signals and entries.
Entry Trigger: A confirmed candle close outside the Fib level is required, not just a wick or price crossing.
Risk Control: The Stop Loss is set at a structural point (the recent swing) for better protection.
Would you like to search for examples of this "Engineered Block Pricing" (EBP) candle pattern on a chart? That clarification makes sense, as placing the Stop Loss (SL) at the recent swing low (or high for a short) is a more conservative and structurally sound location than just the immediate EBP candle's wick.
Here is the final, fully refined summary of the Daily EBP Trading Strategy, incorporating all criteria: the specific signal candle, the Fibonacci retracement levels, the candle close entry trigger, and the recent swing low/high for the stop loss.
👑 Daily EBP Trading Strategy (Final Refined Summary)
This is a daily price action strategy that combines a specific reversal candle (EBP) with a Fibonacci retracement for a confirmed trend continuation entry.
1. 🕯️ The Signal Candle (EBP Confirmation)
Wait for a single daily candle to close that meets two strict criteria:
Liquidity Sweep: The candle's low must first wick below the low of the preceding day.
Strong Reversal: The candle must then reverse and close above the high of the preceding day (confirming a strong move).
2. 📐 Fibonacci Retracement Setup
The Fibonacci Retracement tool is applied to the newly confirmed EBP Candle to define the retracement and entry zone for the next day.
Drawing the Fib (for a Buy Setup): Draw the Fib from the EBP Candle's Close to the EBP Candle's Low.
3. 🎯 Entry and Risk Management
The trade is executed on the next candle (Day 2) after the price retraces and then reverses, confirmed by a candle close.
Action Retracement & Entry Condition Stop Loss (SL) Placement Target (TP) Placement
Buy (Long)
Price retraces into the Fib levels, and then the candle CLOSES above any of the key breakout levels: 0%, 25%, 50%, 75%, or 100%.
Placed at the Most Recent Swing Low (The lowest point before the EBP candle's sharp move). The EBP Candle's High Wick.
Sell (Short) (Inverse) Price retraces into the Fib levels, and then the candle CLOSES below any of the key breakout levels: 0%, 25%, 50%, 75%, or 100%.
Placed at the Most Recent Swing High (The highest point before the EBP candle's sharp move). The EBP Candle's Low Wick.

Line9EMA+BOLL
The 9 EMA moving averages can be freely adjusted, and they are overlaid with the upper, middle, and lower bands of the Bollinger Bands.

Supply & Demand - Trading Vidhyalaya (Free)A powerful script that automatically plots Supply and Demand zones on your chart. Designed to help traders identify potential reversal areas with precision.
Free Version Capabilities:
Works exclusively on the Daily (1D) Timeframe.
Includes Wick & Strong validation logic.
📍 Pinpoint accurate reversals.
🔔 Real-time alerts for Daily zones.
📉 "Touched" zone logic to keep your chart clean.
Want to use this on Intraday Charts? The Premium version supports ALL Timeframes (1m to Monthly) and includes Multi-Timeframe (MTF) overlay capabilities.

Institutional Execution Engine v3 [Nishith Rajwar]
Institutional Execution Engine v3
Market-Structure-Driven Execution Framework (Indicator + Strategy Hybrid)
The **Institutional Execution Engine v3** is a professional-grade execution framework designed to model **how institutional participants interact with liquidity, volatility regimes, and market structure**.
It is built for **index traders, crypto traders, and systematic intraday participants** who require **non-repainting, forward-validated signals** with strict risk control.
This is **not a mashup of indicators**.
Every module is purpose-built and interacts through a unified execution pipeline.
---
🔍 Core Concepts & Methodology
1️⃣ Market Structure & POI Engine
* Identifies **Points of Interest (POIs)** using swing structure, volatility context, and liquidity positioning
* POIs are **confirmed only after bar close** (strict non-repaint enforcement)
* Adaptive pivot sensitivity based on selected execution preset
2️⃣ Liquidity-Aware Scoring System
Each potential trade is filtered through a **multi-factor execution score**, including:
* Structural alignment
* Volatility normalization (ATR regime)
* Liquidity reaction quality
* Directional efficiency
Trades are only allowed when the **minimum institutional score threshold** is met.
3️⃣ Regime Detection (Forward-Walk Safe)
The engine dynamically classifies market conditions into execution regimes:
* Trending
* Rotational
* Mean-reverting
Regime detection is **forward-walk compatible** and does **not leak future data**.
4️⃣ Risk-First Execution Model
* ATR-normalized stop placement
* R-multiple-based take-profit targeting
* Optional **single-trade-per-session guard**
* Strategy engine includes **open-trade protection** to prevent over-execution
5️⃣ Strategy + Indicator Hybrid
This script can be used in **two ways**:
* **Indicator mode** → discretionary execution with visual POIs, signals, and context
* **Strategy mode** → systematic backtesting with full TradingView Strategy Tester support
Both modes share the **same execution logic** (no divergence).
---
⚙️ Preset-Driven Architecture
Built-in execution presets auto-configure internal parameters without changing core logic:
* **Scalp (Index)**
* **Daytrade (Index)**
* **Crypto Intraday**
* **Institutional Research (FWalk)**
Presets adjust pivot sensitivity, score thresholds, ATR behavior, and risk profile — while preserving execution integrity.
---
## 🚫 Non-Repainting & Data Integrity
* No look-ahead bias
* No future bar references
* No repainting signals
* VWAP and regime logic reset correctly per session
* Safe handling of strategy.opentrades to avoid execution errors
All signals are **bar-close confirmed**.
---
📊 Who This Is For
✔ Index traders (NIFTY / BANKNIFTY / SENSEX)
✔ Crypto intraday traders
✔ Systematic traders validating execution logic
✔ Traders who value **structure + liquidity + risk discipline** over indicators
---
⚠️ Disclaimer
This script is a **research and execution framework**, not financial advice.
Always forward-test and adapt risk parameters to your instrument and timeframe.
---
**Author:** Nishith Rajwar
**Version:** v3
**Execution Philosophy:** Trade where institutions execute — not where indicators react.

Line6EMA+BOLL
The values of the six EMA moving averages can be freely adjusted, and it also integrates the upper, middle, and lower lines of the Bollinger Bands.

Day Trading MA Crossover IndicatorDay Trading MA Crossover Indicator Overview The Day Trading MA Crossover Indicator is a simple yet effective tool designed for day traders to identify potential buy and sell opportunities based on moving average crossovers. It plots two customizable moving averages on your chart and generates clear visual signals when they cross, helping you spot trend reversals or continuations in fast-paced markets.This indicator is ideal for intraday trading on lower timeframes (e.g., 5-min, 15-min charts) but can be adapted for swing trading or higher timeframes. It's built with flexibility in mind, allowing you to tweak the MA lengths and types to suit your strategy.Key FeaturesMoving Average Crossovers: Generates "BUY" signals when the fast MA crosses above the slow MA (potential bullish entry) and "SELL" signals when it crosses below (potential bearish entry or exit).
Visual Signals: Green "BUY" labels below bars for long entries and red "SELL" labels above bars for short entries or exits. Optional subtle background coloring highlights signals for quick spotting.
Customizable Parameters:Fast MA Length (default: 9): Period for the shorter moving average.
Slow MA Length (default: 21): Period for the longer moving average.
MA Type (default: EMA): Choose between SMA (Simple), EMA (Exponential), or WMA (Weighted) for different smoothing behaviors.
Overlay Mode: Plots directly on your price chart without cluttering separate panes.
Lightweight and Efficient: Minimal computation for real-time performance on TradingView.
How It WorksMoving Averages Calculation: The indicator computes two MAs based on your selected type and lengths using closing prices.
Signal Detection: A buy signal triggers on an upward crossover (fast MA > slow MA), indicating potential momentum shift to the upside. A sell signal triggers on a downward crossunder (fast MA < slow MA), signaling possible downside momentum.
Visual Aids: Signals appear as labeled shapes with optional background tints to emphasize key bars.
Usage TipsFor Day Trading: Apply on volatile instruments like forex pairs, stocks, or crypto. Combine with support/resistance levels or other indicators (e.g., RSI for overbought/oversold confirmation) to filter false signals in ranging markets.
Backtesting: Test on historical data to optimize MA lengths for your asset—shorter periods for aggressive trading, longer for smoother trends.
Risk Management: Always use stop-losses and position sizing. Signals are not foolproof and work best in trending conditions.
Customization: Adjust inputs via the indicator settings panel after adding it to your chart.
Example SetupOn a 5-min EUR/USD chart: Use EMA (9/21) for quick crossovers. Look for buy signals above key support with increasing volume.
Avoid choppy markets where frequent false crossovers ("whipsaws") can occur.
This indicator is provided for educational and informational purposes only. It is not financial advice, and past performance does not guarantee future results. Trading involves risk; consult a professional advisor before using any strategy. If you have feedback or suggestions for improvements, feel free to comment!

Swing Elite Supply & Demand MTFSwing Elite Supply & Demand MTF
This indicator automates Supply & Demand zone detection using the classic base-candle pattern methodology, enhanced with multi-timeframe confluence and zone strength classification.
How Zones Are Detected
The algorithm identifies zones by scanning for the Leg-Base-Leg structure that defines institutional order flow areas. A valid zone requires three components: an initial directional candle (the "leg in"), one or more consolidation candles forming the base, and an explosive breakout candle (the "leg out") that confirms institutional participation.
Base candles are identified using a body-to-range ratio threshold — candles where the body occupies less than 55% of the total range qualify as indecision/accumulation. The explosive candle must have a body ratio exceeding 50% and must close beyond the base boundaries, confirming genuine breakout rather than false signals.
Zone boundaries are drawn from the base candles, with two width options: "Preferred" uses the candle bodies for tighter zones, while "Wider" extends to the full wick range for more conservative entries.
Pattern Classification
Zones are labeled by their formation pattern. RBR (Rally-Base-Rally) and DBR (Drop-Base-Rally) indicate demand zones, while DBD (Drop-Base-Drop) and RBD (Rally-Base-Drop) mark supply zones. This classification helps traders understand the preceding price action context.
Level on Level (LOL) Strength
When a new zone forms that overlaps an existing zone of the same type by a configurable percentage, the zones merge into a "Level on Level" formation. These stacked zones represent areas where institutional orders have accumulated multiple times, suggesting stronger support or resistance. LOL zones use stricter mitigation rules — they're only removed when price closes through them entirely, rather than the standard percentage penetration.
FLIP Level Detection
The indicator tracks swing highs and lows using pivot detection. When price breaks a significant swing level and subsequently forms a zone that encompasses that broken level, it's marked as a "FLIP" zone. These represent potential support-turned-resistance or resistance-turned-support areas — a key concept in price action trading.
Big Brother Multi-Timeframe Confluence
The "Big Brother" feature detects zones on a higher timeframe and checks whether current-timeframe zones fall within them. Zones with higher-timeframe coverage are labeled with "BB" and the confirming timeframe. This helps traders prioritize zones that align with larger structural levels. The higher timeframe auto-selects based on the zone timeframe (e.g., 15m zones check against 4H, daily zones check against weekly).
Zone Management
Zones are automatically removed when mitigated. Standard zones use percentage-based mitigation (default 25% penetration), while LOL zones require a full close beyond the zone. Additionally, zones that have been touched but see price move beyond a configurable R-multiple distance are removed, preventing stale zones from cluttering the chart.
Gap Finder
The indicator also identifies unfilled price gaps — areas where consecutive candles don't overlap. These gaps often act as magnets for price and can provide additional confluence when aligned with supply or demand zones.
Practical Application
This tool is designed for traders who use Supply & Demand methodology but want objective, consistent zone identification. The strength classification (standard, LOL, FLIP, BB confluence) helps prioritize which zones deserve attention. The built-in stop loss calculation provides a starting point for risk management based on zone dimensions.

ARVEXV1“Failed Reversal – Opposite Candle Only (No Doji/Hammer/Hanging Man)”:
This strategy captures failed reversal attempts where the current candle is opposite to the previous candle and volume is higher. It enters long if a bearish candle fails to break a previous bullish candle’s low, and short if a bullish candle fails to break a previous bearish candle’s high. Signals are canceled for Doji, Hammer, or Hanging Man candles. Entries only, fully backtestable.

ARVEX V1“Failed Reversal – Opposite Candle Only (No Doji/Hammer/Hanging Man)”:
This strategy captures failed reversal attempts where the current candle is opposite to the previous candle and volume is higher. It enters long if a bearish candle fails to break a previous bullish candle’s low, and short if a bullish candle fails to break a previous bearish candle’s high. Signals are canceled for Doji, Hammer, or Hanging Man candles. Entries only, fully backtestable.

INSTITUTIONAL VOLUME PROFILE + FIBONACCI + ENHANCED SIGNALS🎯 INSTITUTIONAL VOLUME PROFILE + FIBONACCI + ENHANCED SIGNALS
A professional-grade indicator combining Volume Profile analysis, Fibonacci retracements, Anchored VWAP, and intelligent signal filtering to identify high-probability institutional positioning and trade setups.
📊 CORE FEATURES
▸ Volume Profile with POC (Point of Control)
- Visualizes where institutional volume accumulated
- Identifies High Volume Nodes (HVN) as key support/resistance
- Shows Value Area (70% volume zone) for market equilibrium
▸ Dynamic Fibonacci Levels
- Auto-detects swing high/low for retracement levels
- Golden Pocket (0.618-0.65) highlight zone
- Bull/bear direction recognition
▸ Anchored VWAP
- Anchored to swing range start
- Institutional mean reversion baseline
- Real-time trend bias indicator
▸ Graded Signal System (A+/B/C)
- A+ Signals: High probability setups (VWAP cross + POC alignment)
- B Signals: Above-average quality (VWAP cross above POC)
- C Signals: Lower probability (counter-trend setups)
🎮 DISPLAY MODES
⚡ TRADING LIVE MODE
- Clean chart showing only A+ signals
- Minimal visual noise for active trading
- Perfect for intraday execution
📈 FULL OVERVIEW MODE
- Complete analysis with all zones visible
- Volume Profile + Fibonacci + Value Area
- All signal grades displayed
- Statistics dashboard
🔬 ADVANCED SIGNAL FILTERS
✓ Volume Confirmation
- Requires above-average volume on signals
- Filters out weak institutional participation
- Configurable volume multiple (default 1.2x)
✓ Momentum Filter
- Ensures price momentum aligns with signal direction
- Prevents counter-trend entries
- Configurable lookback period
✓ SR Proximity Upgrade ⭐ GAME CHANGER
- Automatically upgrades B/C signals to A+ when near key levels
- Detects proximity to POC and HVN zones
- Combines technical confluence for best setups
🔔 SMART ALERTS
▸ Configurable alerts for A+, B, or C signals
▸ Real-time notifications to your device
▸ No need to watch charts constantly
▸ "Once per bar close" prevents repainting
💡 HOW TO USE
FOR DAY TRADING:
1. Switch to "Trading Live" mode
2. Enable only A+ alerts
3. Set filters: Volume 1.5x, Momentum ON, Proximity 0.3%
4. Trade only A+ signals at key levels
FOR SWING TRADING:
1. Use "Full Overview" mode
2. Analyze Value Area and Fibonacci confluence
3. Set filters: Volume 1.2x, Momentum ON, Proximity 0.8%
4. Enter on A+ signals with multi-timeframe confirmation
FOR ANALYSIS:
1. Full Overview mode with all visuals enabled
2. Disable filters to see all raw signals
3. Study how institutions positioned at key zones
4. Plan trades around POC and Value Area
⚙️ RECOMMENDED SETTINGS
5-15 MIN CHARTS (Scalping):
- Lookback: 200-300 bars
- Volume: 1.5x, Momentum: 5 bars, Proximity: 0.3%
- Trading Live mode + A+ alerts only
1 HOUR CHARTS (Intraday):
- Lookback: 300 bars
- Volume: 1.3x, Momentum: 3 bars, Proximity: 0.5%
- Full Overview or Trading Live
4 HOUR CHARTS (Swing):
- Lookback: 300-500 bars
- Volume: 1.2x, Momentum: 3 bars, Proximity: 0.8%
- Full Overview mode
DAILY CHARTS (Position):
- Lookback: 300-500 bars
- Volume: 1.1x, Momentum: 2 bars, Proximity: 1.0%
- Full Overview mode
📈 KEY CONCEPTS
POC (Point of Control): Price level with highest volume - acts as magnet
Value Area: Zone containing 70% of volume - equilibrium range
HVN: High Volume Nodes - institutional accumulation zones
AVWAP: Anchored VWAP - institutional average entry price
Golden Pocket: 0.618-0.65 Fib zone - highest probability reversal area
🎯 TRADING STRATEGY TIPS
1. Wait for A+ signals - quality over quantity
2. Best setups occur at POC or Value Area boundaries
3. Use multiple timeframes for confirmation
4. Combine with your own risk management rules
5. Signals are high probability, not guaranteed - always use stops


Ribbon Cross Strategy This strategy uses a simple moving-average ribbon crossover system with a customizable entry filter. You can choose whether trades trigger near the fast or slow average, allowing flexibility in capturing early or confirmed trend moves.
It’s best suited for index trading on intraday timeframes , helping identify short-term trend reversals and continuations with clear visual cues and backtestable logic.

Swing elite MTF Momentum Confluence📊 MTF Momentum Confluence Strategy
Overview
The MTF Momentum Confluence Strategy identifies high-probability trade setups by analyzing momentum alignment across multiple timeframes. When momentum agrees across 4 different timeframes, the probability of a successful trade increases significantly.
The core principle is simple: trade in the direction where all timeframes agree.

Liquidity-Aware Daily Box (Stable v4)Highlights previous day liquidity range and estimates potential liquidation zones using volume and volatility stress. Overlapping lines indicate stronger liquidity confluence areas. Designed as a context tool, not a standalone signal.

Prev Day & Prev Hour Fibo Zones (Normal + Reverse)this works on previous day and hour fibb golden zone

FreeSisters - System v1.8System v1.8
Marks out high time frame levels.
Market Structure defined by quarters theory, based on the lowest price within a 12 month period.

LQ plots w/filled - 0x/Gh0stLiquidity Indicator
This indicator identifies significant swing highs and swing lows based on user-defined pivot strength and projects them forward as potential liquidity and reaction levels.
When a valid swing forms, the script:
1. Draws a horizontal level at the swing price
a. Optionally extends that level forward in time
b. Visualizes the level as a line and/or price box
c. Tracks the level until price interacts with or fills it
2. When price trades back through a level:
a. The level is marked as filled
b. A clear X marker is drawn at the point of fill
c. The level is optionally removed or hidden based on user settings
3. Useful for:
a. Designed for traders who focus on:
1. Market structure
2. Liquidity targets
Swing-based support and resistance
Identifying where price has already “paid” liquidity
This tool is structure-driven, it highlights where price has reacted and where it has not, letting YOU, the trader decide how to act.


Harmonic Patterns (Experimental) [Kodexius]Harmonic Patterns (Experimental) is a multi pattern harmonic geometry scanner that automatically detects, validates, and draws classic harmonic structures directly on your chart. The script continuously builds a pivot map (swing highs and swing lows), then evaluates the most recent pivot sequence against a library of harmonic ratio templates such as Gartley, Bat, Deep Bat, Butterfly, Crab, Deep Crab, Cypher, Shark, Alt Shark, 5-0, AB=CD, and 3 Drives.
Unlike simple “pattern exists / pattern doesn’t exist” indicators, this version scores candidates by accuracy . Each pattern includes “ideal” ratio targets, and the script computes a total error score by measuring how far the observed ratios deviate from the ideal. When multiple patterns could match the same pivot structure, the script selects the best match (lowest total error) and displays that one. This reduces clutter and makes the output more practical in real market conditions where many ratio ranges overlap.
The end result is a clean, information rich visualization of harmonic opportunities that is:
-Pivot based and swing aware
-Ratio validated with configurable tolerance
-Direction filtered (bullish, bearish, or both)
-Ranked by accuracy to prefer higher quality matches
Note: This is an experimental pattern engine intended for research, confluence and chart study. Harmonic patterns are probabilistic and can fail often. Always combine with your own risk management and confirmation tools.
🔹 Features
🔸Pivot Detection
The script uses pivot functions to detect structural turning points:
-Pivot Left Bars controls how many bars must exist on the left of the pivot
-Pivot Right Bars controls confirmation delay on the right (smaller value reacts faster)
Additionally, a Min Swing Distance (%) filter can ignore tiny swings to reduce noise. Pivots are stored separately for highs and lows and capped by Max Pivots to Store to keep the script efficient.
🔸Pattern Library (XABCD and Beyond)
Supported structures include:
-Gartley, Bat, Deep Bat, Butterfly, Crab, Deep Crab
-Cypher (uses XC extension and CD retracement logic)
-Shark and Alt Shark (0-X-A-B-C mapping)
-5-0 (AB and BC extensions with CD retracement)
-AB=CD (symmetry and proportionality checks)
-3 Drives (6 point structure, drive and retracement ratios)
Each pattern is defined by ratio ranges and also “ideal” ratio targets used for scoring.
🔸 Pattern Fibonacci Rules (Detailed Ratio Definitions)
This script validates each harmonic template by measuring a small set of Fibonacci relationships between the legs of the pattern. All measurements are computed using absolute price distance (so the ratios are direction independent), and then a directional sanity check ensures the geometry is positioned correctly for bullish or bearish cases.
How ratios are measured
Most patterns in this script use the standard X A B C D harmonic structure. Four ratios are evaluated:
1) XB retracement of XA
This measures how much price retraces from A back toward X when forming point B .
xbRatio = |B - A| / |A - X|
2) AC retracement of AB
This measures how much point C retraces the AB leg.
acRatio = |C - B| / |B - A|
3) BD extension of BC
This measures the “drive” from C into D relative to the BC leg.
bdRatio = |D - C| / |C - B|
4) XD retracement of XA
This is the most important “completion” ratio in many patterns. It measures where D lands relative to the original XA swing.
xdRatio = |D - A| / |A - X|
Important: the script applies a user defined Fibonacci Tolerance to each accepted range, meaning the pattern can still pass even if ratios are slightly off from the textbook values.
🔸 XABCD Pattern Ratio Templates
Below are the exact ratio rules used by the templates in this script.
Gartley
-XB must be ~0.618 of XA
-AC must be between 0.382 and 0.886 of AB
-BD must be between 1.272 and 1.618 extension of BC
-XD must be ~0.786 of XA
In practice, Gartley is a “non extension” structure, meaning D usually remains inside the X boundary .
Bat
-XB between 0.382 and 0.50 of XA
-AC between 0.382 and 0.886 of AB
-BD between 1.618 and 2.618 of BC
-XD ~0.886 of XA
Bat patterns typically complete deeper than Gartley and often create a sharper reaction at D.
Deep Bat
-XB ~0.886 of XA
-AC between 0.382 and 0.886 of AB
-BD between 1.618 and 2.618 of BC
-XD ~0.886 of XA
Deep Bat uses the same completion zone as Bat, but requires a much deeper B point.
Butterfly
-XB ~0.786 of XA
-AC between 0.382 and 0.886 of AB
-BD between 1.618 and 2.618 of BC
-XD between 1.272 and 1.618 of XA
Butterfly is an extension pattern . That means D is expected to break beyond X (in the completion direction).
Crab
-XB between 0.382 and 0.618 of XA
-AC between 0.382 and 0.886 of AB
-BD between 2.24 and 3.618 of BC
-XD ~1.618 of XA
Crab is also an extension pattern . It often produces a very deep D completion and a strong reaction zone.
Deep Crab
-XB ~0.886 of XA
-AC between 0.382 and 0.886 of AB
-BD between 2.0 and 3.618 of BC
-XD ~1.618 of XA
Deep Crab combines a deep B point with a strong XA extension completion.
🔸 Cypher Fibonacci Rules (XC Based)
Cypher is not validated with the same four ratios as XABCD patterns. Instead it uses an XC based completion model:
1) B as a retracement of XA
xb = |B - A| / |A - X| // AB/XA
Must be between 0.382 and 0.618 .
2) C as an extension from X relative to XA
xc = |C - X| / |A - X| // XC/XA
Must be between 1.272 and 1.414 .
3) D as a retracement of XC
xd = |D - C| / |C - X| // CD/XC
Must be ~ 0.786 .
This makes Cypher structurally different: the “completion” is defined as a retracement of the entire XC leg, not XA.
🔸 Shark and Alt Shark Fibonacci Rules (0-X-A-B-C Mapping)
Shark patterns are commonly defined as 0 X A B C . In this script the pivots are mapped like this:
0 = pX, X = pA, A = pB, B = pC, C = pD
So the final pivot (stored as pD) is labeled as C on the chart.
Three ratios are validated:
1) AB relative to XA
ab_xa = |B - A| / |A - X|
Must be between 1.13 and 1.618 .
2) BC relative to AB
bc_ab = |C - B| / |B - A|
Must be between 1.618 and 2.24 .
3) OC relative to OX
oc_ox = |C - 0| / |X - 0|
For Shark it must be between 0.886 and 1.13 .
For Alt Shark it must be between 1.13 and 1.618 (a deeper / more extended completion).
🔸 5-0 Fibonacci Rules
5-0 is validated as a sequence of extensions and then a fixed retracement:
1) AB extension of XA
ab_xa = |B - A| / |A - X|
Must be between 1.13 and 1.618 .
2) BC extension of AB
bc_ab = |C - B| / |B - A|
Must be between 1.618 and 2.24 .
3) CD retracement of BC
cd_bc = |D - C| / |C - B|
Must be approximately 0.50 .
Note that for 5-0 the script does not rely on an XA completion ratio like 0.786 or 1.618. The defining completion is the 0.5 retracement of BC.
🔸 AB=CD Fibonacci Rules
AB=CD is a symmetry pattern and is treated differently from the harmonic templates:
1) AB and CD length symmetry
The script checks if CD is approximately equal to AB within tolerance.
2) BC proportion
BC/AB is expected to fall in a common Fibonacci retracement zone:
-approximately 0.618 to 0.786 (with a looser tolerance in code)
3) CD/BC expansion
CD/BC is expected to be an expansion ratio:
-approximately 1.272 to 1.618 (also with a looser tolerance)
This allows the script to capture both classic equal leg AB=CD and common “expanded” variations.
🔸 3 Drives Fibonacci Rules (6 Point Structure)
3 Drives is a 6 point structure and is validated using retracement ratios and extension ratios:
Retracement rules
Retracement 1 must be between 0.618 and 0.786 of Drive 1
Retracement 2 must be between 0.618 and 0.786 of Drive 2
Extension rules
Drive 2 must be between 1.272 and 1.618 of Retracement 1
Drive 3 must be between 1.272 and 1.618 of Retracement 2
This pattern is meant to capture rhythm and proportional repetition rather than a single XA completion ratio.
🔸 Why the script can show “ratio labels” on legs
If you enable Show Fibonacci Values on Legs , the script prints the measured ratios near the midpoint of each leg (or diagonal, depending on pattern type). This makes it easy to visually confirm:
-Which ratios caused the pattern to pass
-How close the structure is to ideal harmonic values
-Why one template was preferred over another via the accuracy score
🔸 Fibonacci Tolerance Control
All ratio checks use a single tolerance input (percentage). This tolerance expands or contracts the acceptable ratio ranges, letting you decide whether you want:
-Tight, high precision matches (lower tolerance)
-Broader, more frequent matches (higher tolerance)
🔸 Direction Filter (Bullish Only / Bearish Only / Both)
You can restrict scanning to bullish patterns, bearish patterns, or allow both. This is useful if you are aligning with higher timeframe bias or only trading one side of the market.
🔸 Best Match Selection (Anti Clutter Logic)
When a new pivot confirms, the script evaluates all enabled patterns against the latest pivot sequence and keeps the one with the smallest total error score. This is especially helpful because many harmonic templates overlap in real time. Instead of drawing multiple conflicting labels, you get one “most accurate” candidate.
🔸 Clean Visual Rendering and Optional Details
The drawing system can display:
-Main structure lines (X-A-B-C-D or special mappings)
-Dashed diagonals for geometric context (XB, AC, BD, XD)
-Pattern fill to visually highlight the structure zone
-Point labels (X,A,B,C,D or 0..5 for 3 Drives, 0-X-A-B-C for Shark)
-Leg Fibonacci labels placed around midpoints for fast ratio reading
All colors (bullish and bearish line and fill) are configurable.
🔸 Pattern Spacing and Display Limits
To keep charts readable, the script includes:
-Max Patterns to Display to limit on-chart drawings
-Min Bars Between Patterns to avoid repeated signals too close together in the same direction
Older patterns are automatically deleted once the display limit is exceeded.
🔸 Alerts
When enabled, alerts trigger on new confirmed detections:
-Bullish Pattern Detected
-Bearish Pattern Detected
Alerts fire once per bar when a new pattern is confirmed by a fresh pivot.
🔹 Calculations
This section summarizes the core logic used under the hood.
1) Pivot Detection and Swing Filtering
The script confirms pivots using right side confirmation, then optionally filters them by minimum swing distance relative to the last opposite pivot.
// Pivot detection
float pHigh = ta.pivothigh(high, pivotLeftBars, pivotRightBars)
float pLow = ta.pivotlow(low, pivotLeftBars, pivotRightBars)
// Example swing distance filter (conceptual)
abs(newPivot - lastOppPivot) / lastOppPivot >= minSwingPercent
Pivots are stored in capped arrays (high pivots and low pivots), ensuring performance and stable memory usage.
2) Ratio Measurements (Retracement and Extension)
The engine measures harmonic ratios using two core helpers:
Retracement measures how much the third point retraces the previous leg.
Extension measures how much the next leg extends relative to the previous leg.
// Retracement: (p3 - p2) compared to (p2 - p1)
calcRetracement(p1, p2, p3) =>
float leg = math.abs(p2.price - p1.price)
float retr = math.abs(p3.price - p2.price)
leg != 0 ? retr / leg : na
// Extension: (p4 - p3) compared to (p3 - p2)
calcExtension(p2, p3, p4) =>
float leg = math.abs(p3.price - p2.price)
float ext = math.abs(p4.price - p3.price)
leg != 0 ? ext / leg : na
For a standard XABCD pattern the script evaluates:
-XB retracement of XA
-AC retracement of AB
-BD extension of BC
-XD retracement of XA
3) Tolerance Based Range Check
Ratio validation uses a flexible range check that expands min and max by the tolerance percent:
isInRange(value, minVal, maxVal, tolerance) =>
float tolMin = minVal * (1.0 - tolerance)
float tolMax = maxVal * (1.0 + tolerance)
value >= tolMin and value <= tolMax
This means even “fixed” ratios (like 0.786) still allow a user controlled deviation.
4) Positional Sanity Check for D (Beyond X or Not)
Some harmonic patterns require D to remain within X (non extension patterns), while others require D to break beyond X (extension patterns). The script enforces that using a boolean flag in each template.
Conceptually:
-If the pattern is an extension type, D should cross beyond X in the expected direction
-If the pattern is not extension type, D should stay on the correct side of X
This prevents visually incorrect “ratio matches” that violate the intended geometry.
5) Template Definitions (Ranges + Ideal Targets)
Every pattern includes ratio ranges plus ideal values. The ideal values are used only for scoring quality, not for pass/fail. Example concept:
-Ranges determine validity
-Ideal targets determine ranking
6) Accuracy Scoring (Total Error)
When a candidate passes all validity checks, the script computes an accuracy score by summing absolute deviations from ideal ratios:
calcError(value, ideal) =>
math.abs(value - ideal)
// Total error is the sum of the four leg errors (as available for the pattern)
totalError =
calcError(xbRatio, xbIdeal) +
calcError(acRatio, acIdeal) +
calcError(bdRatio, bdIdeal) +
calcError(xdRatio, xdIdeal)
Lower score means closer to the “textbook” harmonic proportions.
7) Best Match Resolution (Choosing One Winner)
When multiple enabled patterns match the same pivot structure, the script selects the one with the lowest totalError:
updateBest(currentBest, newCandidate) =>
result = currentBest
if not na(newCandidate)
if na(currentBest) or newCandidate.totalError < currentBest.totalError
result := newCandidate
result
This is a major practical feature because it reduces clutter and highlights the highest quality interpretation.
8) Bullish and Bearish Scanning Logic
The scanner runs when pivots confirm:
-Bullish patterns are evaluated on a newly confirmed pivot low (potential D)
-Bearish patterns are evaluated on a newly confirmed pivot high (potential D)
From that D pivot, the script searches backward through stored pivots to build a valid pivot sequence (X,A,B,C,D). If 3 Drives is enabled, it also attempts to find the extra preceding point needed for the 6 point structure.
9) Rendering: Lines, Fill, Labels, and Leg Fib Text
After detection the script draws:
-Primary legs with thicker lines
-Geometric diagonals with dashed lines (for XABCD types)
-Optional fill between selected legs to emphasize the structure area
-A summary label showing direction, pattern name, and ratios
-Optional point labels and leg ratio labels placed near midpoints
To avoid overlapping with candles, the script offsets labels using ATR:
float yOff = math.max(ta.atr(14) * 0.15, syminfo.mintick * 10)
10) Pattern Lifecycle and Cleanup
To respect chart limits and keep visuals clean, the script deletes old drawings once the maximum visible patterns threshold is exceeded. This includes lines, fills, and labels.

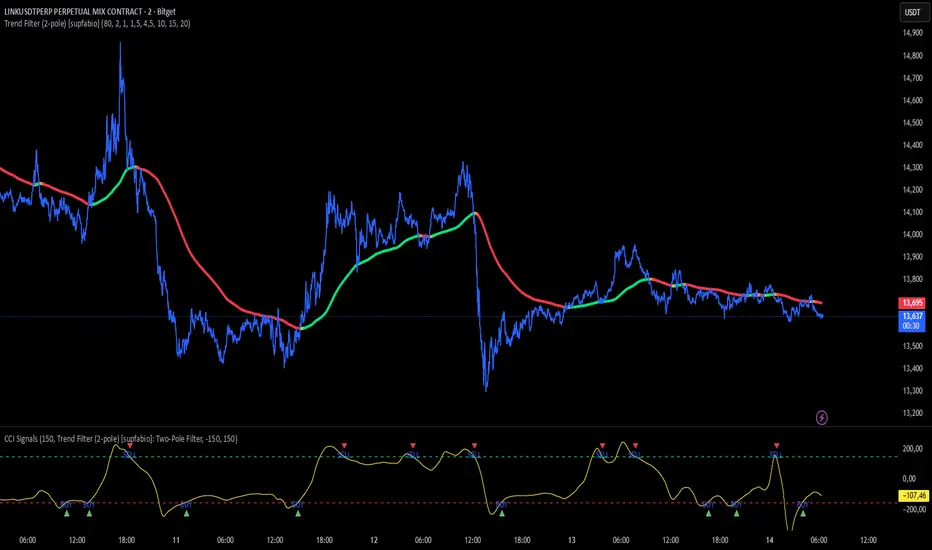
CCI + Buy/Sell Cross (supfabio)This indicator is an enhanced version of the Commodity Channel Index (CCI) designed to generate clear BUY and SELL signals based on customizable level crossovers, with built-in support for webhook automation and external trade execution.
🔹 Signal Logic
BUY Signal:
Triggered when the CCI crosses upward (from below to above) the user-defined BUY level (red line).
SELL Signal:
Triggered when the CCI crosses downward (from above to below) the user-defined SELL level (green line).
Signals can optionally be configured to trigger only on candle close, reducing real-time noise and false signals.
🔹 Key Features
✅ Original CCI calculation (standard formula preserved)
✅ Fully configurable BUY and SELL levels
✅ Optional display of signal level lines
✅ Visual BUY / SELL markers plotted on the CCI panel
✅ Support for moving average smoothing and Bollinger Bands applied to the CCI
✅ Dynamic alerts using alert(), ideal for:
Webhook integrations
Trading bots
External servers and automated execution systems
🔹 Alerts & Webhook Integration
The indicator sends dynamic alert messages containing:
Action type (BUY / SELL)
Symbol
Closing price
Timestamp
To use:
Add the indicator to your chart
Create an alert and select “Any alert() function call”
Enable Webhook URL and configure your endpoint
Done — signals will be sent automatically
🔹 Best Use Cases
Traders who use CCI as a primary entry trigger
Momentum or mean-reversion strategies
Automated trading systems
Visual backtesting and signal validation
⚠️ Disclaimer
This indicator is not a complete trading system and does not replace proper risk management. Always use it in combination with market context, confirmation tools, and sound position sizing.
Session Boxes 03:33-07:30 + 14:00ession Boxes & Pre-Market Structure (14:00–07:30) Indicator
This indicator plots key session structures and highlights a unique pre-market range window using colored boxes on the 15-minute chart. Designed for intraday traders, it visually marks important institutional activity times and a strategic price zone that often sets the tone for the following trading day.
📍 Key Features:
✅ 03:00 AM Box
Draws a purple box around the 03:00 candle (EST) until 16:00 (market close).
Useful for identifying London/early European session impact.
✅ 07:30 AM Box
Draws an orange box around the 07:30 candle (EST) until 16:00.
Marks the key pre-market data release period (e.g., CPI/NFP days).
✅ 🔴 14:00 to Next Day 07:30 Range Box
Draws a red box with 50% opacity starting from the 14:00 (2 PM) candle and ending at the 07:30 AM candle the next day.
This range often represents institutional positioning and pre-market accumulation/distribution zones.
Ideal for identifying breakout or rejection zones for the next session.
⚠️ Important Notes:
Works only on the 15-minute timeframe.
Auto-adjusts to the New York timezone (EST/EDT).
A visual label reminds you to switch to the correct timeframe if you’re on the wrong chart.
