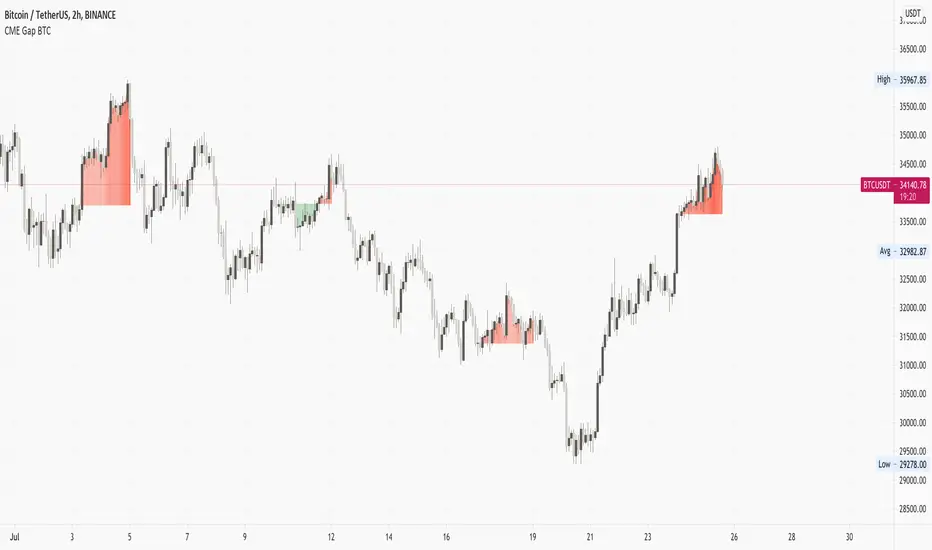
BTC CME Gaps Detector [SwissAlgo]BTC CME Gaps Detector
Track Unfilled Gaps & Identify Price Magnets
------------------------------------------------------
Overview
The BTC CME Gap Detector identifies and tracks unfilled price gaps on any timeframe (1-minute recommended for scalping) to gauge potential trading bias.
Verify Gap Behavior Yourself : Use TradingView's Replay Mode on the 1-Minute chart to observe how the price interacts with gaps. Load the BTC1! ticker (Bitcoin CME Futures), enable Replay Mode, and play forward through time (for example: go back 15 days). You may observe patterns such as price frequently returning to fill gaps, nearest gaps acting as near-term targets, and gaps serving as potential support/resistance zones. Some gaps may fill quickly, while others may remain open for longer periods. This hands-on analysis lets you independently assess how gaps may influence price movement in real market conditions and whether you may use this indicator as a complement to your trading analysis.
------------------------------------------------------
Purpose
Price gaps occur when there is a discontinuity between consecutive candles - when the current candle's low is above the previous candle's high (gap up), or when the current candle's high is below the previous candle's low (gap down).
This indicator identifies and tracks these gaps on any timeframe to help traders:
Identify gap zones that may attract price (potential "price magnets")
Monitor gap fill progression
Assess potential directional bias based on nearest unfilled gaps (long, short)
Analyze market structure and liquidity imbalances
------------------------------------------------------
Why Use This Indicator?
Universal Gap Detection : Identifies all gaps on any timeframe (1-minute, hourly, daily, etc.)
Multi-Candle Mitigation Tracking : Detects gap fills that occur across multiple candles
Distance Analysis : Shows percentage distance to nearest bullish and bearish gaps
Visual Representation : Color-coded boxes indicate gap status (active vs. mitigated)
Age Filtering : Option to display only gaps within specified time periods (3/6/12/24 months), as older gaps may lose relevance
ATR-Based Sizing : Minimum gap size adjusts to instrument volatility to filter noise (i.e. small gaps)
------------------------------------------------------
Trading Concept
Gaps represent price zones where no trading occurred. Historical market behavior suggests that unfilled gaps may attract price action as markets tend to revisit areas of incomplete price discovery. This phenomenon creates potential trading opportunities:
Bullish gaps (above current price) may act as upside targets where the price could move to fill the gap
Bearish gaps (below current price) may act as downside targets where price could move to fill the gap
The nearest gap often provides directional bias, as closer gaps may have a higher probability of being filled in the near term
This indicator helps quantify gap proximity and provides a visual reference for these potential target zones.
EXAMPLE
Step 1: Bearish Gaps Appear Below Price
Step 2: Price Getting Close to Fill Gap
Step 3: Gap Mitigated Gap
------------------------------------------------------
Recommended Setup
Timeframe: 1-minute chart recommended for maximum gap detection frequency. Works on all timeframes (higher timeframes will show fewer, larger gaps).
Symbol: Any tradable instrument. Originally designed for BTC1! (CME Bitcoin Futures) but compatible with all symbols.
Settings:
ATR Length: 14 (default)
Min Gap Size: 0.5x ATR (adjust based on timeframe and noise level)
Gap Age Limit: 3 months (configurable)
Max Historical Gaps: 300 (adjustable 1-500)
------------------------------------------------------
How It Works
Gap Detection : Identifies price discontinuities on every candle where:
Gap up: current candle low > previous candle high
Gap down: current candle high < previous candle low
Minimum gap size filter (ATR-based) eliminates insignificant gaps
Mitigation Tracking : Monitors when price touches both gap boundaries. A gap is marked as filled when the price has touched both the top and bottom of the gap zone, even if this occurs across multiple candles.
Visual Elements :
Green boxes: Unfilled gaps above current price (potential bullish targets)
Red boxes: Unfilled gaps below current price (potential bearish targets)
Gray boxes: Filled gaps (historical reference)
Labels: Display gap type, price level, and distance percentage
Analysis Table: Shows :
Distance % to nearest bullish gap (above price)
Distance % to nearest bearish gap (below price)
Trade bias (LONG if nearest gap is above, SHORT if nearest gap is below)
------------------------------------------------------
Key Features
Detects gaps on any timeframe (1m, 5m, 1h, 1D, etc.)
Boxes extend 500 bars forward for active gaps, stop at the fill bar for mitigated gaps
Real-time distance calculations update on every candle
Configurable age filter removes outdated gaps
ATR multiplier ensures gap detection adapts to market volatility and timeframe
------------------------------------------------------
Disclaimer
This indicator is provided for informational and educational purposes only.
It does not constitute financial advice, investment recommendations, or trading signals. The concept that gaps attract price is based on historical observation and does not guarantee future results.
Gap fills are not certain - gaps may remain unfilled indefinitely, or the price may reverse before reaching a gap. This indicator should not be used as the sole basis for trading decisions.
All trading involves substantial risk, including the potential loss of principal. Users should conduct their own research, apply proper risk management, test strategies thoroughly, and consult with qualified financial professionals before making trading decisions.
The authors and publishers are not responsible for any losses incurred through the use of this indicator.
CME

Weekend GapsIdentify unfilled gaps between the close of one candle and the opening of the next. Optimised for weekends by highlighting friday gaps with a triangle and bold horizontal ray. Depending on the price action required to fill it, they are marked in red or green.

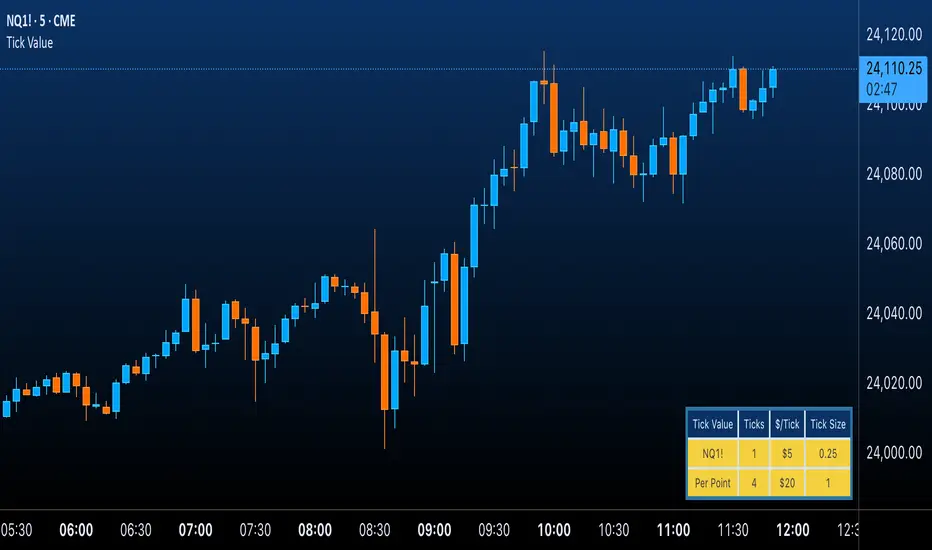
Futures Tick & Point Value [BoredYeti]Futures Tick & Point Value
This utility displays tick size, dollars per tick, and (optionally) a per-point row for the current futures contract.
Features
• Hardcoded $/tick map for common CME/NYMEX/CBOT/COMEX contracts
• Automatic fallback using pointvalue * mintick for any other symbol
• Table settings: adjustable position, text size, customizable colors
• Optional “Per Point” row showing ticks and $/point
Notes
• Contract specs can vary by broker/exchange and may change over time. Always confirm with official specifications.
• Educational tool only; not financial advice.
BTC CME Futures Gaps (BTCGapHunt_CME)BTC CME Futures Gaps Indicator
Overview
This indicator visualises price gaps between the daily close and open of Bitcoin CME futures (CME:BTC1!). These gaps are often revisited ("filled") by market price action and may serve as technical targets.
Thanks
... to Maven and the Blockchain Masons (x.com/Masons_DAO) to push me on this topic.
What Is a CME Gap?
CME Bitcoin Futures do not trade 24/7. Gaps form when the market reopens at a different price than where it last closed.
Gaps are often used as support/resistance or liquidity targets.
This indicator tracks, visualises, and alerts on these gaps.
Key Features
Automatic gap detection using daily open/close on CME:BTC1!
Dynamic gap size threshold based on ATR (Average True Range)
Highlight unfilled gaps and track partial fills visually
Alerts for gap formation and fill events
Parameter overlay showing real-time settings
Supported and Overrideable Parameters
ATR Length: Defines the lookback period for ATR calculation (default: 14)
Gap Size Multiplier: Multiplies the ATR to set the dynamic gap threshold (default: 1.0)
Proximity Threshold: Price distance from gap edge to consider it filled (default: 100 USD)
Max Gaps Tracked: Maximum number of concurrent gaps shown (default: 50)
Alerts Enabled: Toggle alerts for gap formation and gap fill events
How the Gap Size Is Calculated
Minimum Gap Size = ATR(14) * Gap Size Multiplier
ATR Length and Gap Size Multiplier are configurable.
Gap threshold adjusts dynamically with market volatility.
Visual Guide
Red Box: Fully unfilled gap
Lemon Yellow Box: Partially filled gap
Right Margin Boxes: Snapshot of unfilled gaps for quick access
Top-Right Panel: Current ATR, Gap Size, Thresholds, etc.
Alerts
Gap Formed: A new gap is detected.
Gap Filled: The gap is either partially or fully filled.
Recommended Timeframes
1H, 4H, 1D (best resolution)
Designed for BTC spot/perpetual charts (e.g., BTCUSD, BTCUSDT)
How To Use
Add the script to your BTC chart.
Monitor red/yellow boxes for unfilled gaps.
Check config panel for current threshold and settings.
Enable alerts via TradingView for real-time updates.
Notes
Up to 50 gaps are tracked (adjustable).
Data source: CME futures via request.security.
All visuals and alerts are time-synced with your chart.
Disclaimer
This script is for educational purposes only. Trade at your own risk.

52SIGNAL RECIPE Smart Money Detector : CME + Exchanges=================52SIGNAL RECIPE CME-Exchange Smart Money Detector=================
◆ Overview
The 52SIGNAL RECIPE CME-Exchange Smart Money Detector is an advanced technical indicator designed to identify institutional and smart money movements by analyzing and comparing futures markets across both CME and cryptocurrency exchanges. This powerful tool detects coordinated buying and selling patterns that often precede significant price movements, giving traders an edge in anticipating market direction.
What makes this indicator unique is its cross-market verification approach. By requiring confirmation from both CME Bitcoin futures (dominated by institutional players) and crypto exchange futures (with broader market participation), it significantly reduces false signals and identifies high-probability smart money footprints that typically lead market movements.
─────────────────────────────────────
◆ Key Features
• Dual Market Confirmation: Simultaneously analyzes both CME Bitcoin futures and exchange futures charts to identify synchronized smart money activity
• Smart Volume Analysis: Uses advanced algorithms to separate buying and selling volume based on candle structure and price action
• Energy Wave Visualization: Displays smart money signals as intuitive energy waves with varying sizes reflecting signal strength
• Strength Rating System: Quantifies signal strength on a 0-100% scale, with multiple visualization levels (10%+, 40%+, 60%+, 80%+)
• Candlestick Pattern Integration: Incorporates bullish/bearish candle formations to enhance signal reliability
• Volume Spike Detection: Identifies abnormal volume increases that often accompany smart money positioning
• Trend Context Analysis: Evaluates signals in relation to current market trend for higher probability setups
• Dynamic Strength Calculation: Uses a multi-factor model considering volume ratio, buying/selling imbalance, candle structure, and trend alignment
• Transparent Signal Labeling: Displays precise strength percentage values with each signal for clear decision-making
• Real-time Institutional Flow Monitor: Tracks the footprints of large players across both regulated (CME) and crypto exchange markets
─────────────────────────────────────
◆ Understanding Signal Types
■ Buy Signal Energy Waves (Green)
• Definition: Detected when significant buying pressure appears simultaneously on both CME and exchange futures, typically on bearish candles
• Visual Appearance: Green circular waves below price bars, with size/opacity increasing with signal strength
• Market Interpretation: Indicates institutional buying interest even as price is declining, often preceding bullish reversals
• Signal Strength Factors:
▶ Higher buying volume relative to selling volume
▶ Above-average total volume
▶ Lower wicks on bearish candles
▶ Appearance at key support levels
▶ Coinciding with oversold conditions
■ Sell Signal Energy Waves (Red)
• Definition: Detected when significant selling pressure appears simultaneously on both CME and exchange futures, typically on bullish candles
• Visual Appearance: Red circular waves above price bars, with size/opacity increasing with signal strength
• Market Interpretation: Indicates institutional selling interest even as price is rising, often preceding bearish reversals
• Signal Strength Factors:
▶ Higher selling volume relative to buying volume
▶ Above-average total volume
▶ Upper wicks on bullish candles
▶ Appearance at key resistance levels
▶ Coinciding with overbought conditions
─────────────────────────────────────
◆ Signal Strength Understanding
■ The Four Strength Levels
• Level 1 (10-39%): Initial Detection
▶ Visual: Smallest energy wave
▶ Meaning: Early smart money positioning detected
▶ Usage: Early warning, prepare for possible setup
• Level 2 (40-59%): Moderate Strength
▶ Visual: Medium-small energy wave
▶ Meaning: Clearer institutional positioning
▶ Usage: Begin position planning, watch for confirmation
• Level 3 (60-79%): Strong Signal
▶ Visual: Medium-large energy wave
▶ Meaning: Significant smart money footprint
▶ Usage: High-probability setup forming, consider entry
• Level 4 (80-100%): Exceptional Strength
▶ Visual: Largest energy wave
▶ Meaning: Powerful institutional movement confirmed
▶ Usage: Highest probability setup, strong conviction entry point
■ Understanding Signal Strength Calculation
• Volume Component (0-50 points):
▶ Measures how current volume compares to recent average
▶ Maximum points when volume is 2x or higher than average
• Buy/Sell Ratio Component (0-50 points):
▶ Measures imbalance between buying and selling pressure
▶ Maximum points when ratio exceeds predefined multiplier threshold
• Advanced Weighting Factors:
▶ Candle Structure: Body size, wick length, and orientation
▶ Trend Alignment: Signal relationship to current trend
▶ Volume Spike: Abnormal volume increase detection
▶ Cross-Market Confirmation: Strength of signal alignment between CME and exchange
─────────────────────────────────────
◆ Practical Trading Applications
■ Reversal Trading Strategy
• Buy Signal Application:
▶ Setup: Strong buy energy wave (60%+) on a bearish candle
▶ Entry: After confirmation candle following the signal
▶ Stop Loss: Below recent low or 1 ATR below entry
▶ Take Profit: Previous resistance or 1:2 risk-reward minimum
▶ Enhancers: Signal occurring at support zone, oversold conditions, or trend line tests
• Sell Signal Application:
▶ Setup: Strong sell energy wave (60%+) on a bullish candle
▶ Entry: After confirmation candle following the signal
▶ Stop Loss: Above recent high or 1 ATR above entry
▶ Take Profit: Previous support or 1:2 risk-reward minimum
▶ Enhancers: Signal occurring at resistance zone, overbought conditions, or trend line tests
■ Trend Continuation Strategy
• During Uptrends:
▶ Focus on buy signals that appear during pullbacks
▶ Higher probability when signals occur at key moving averages or support levels
▶ Enter on strength when price shows signs of resuming the uptrend
• During Downtrends:
▶ Focus on sell signals that appear during relief rallies
▶ Higher probability when signals occur at key moving averages or resistance levels
▶ Enter on strength when price shows signs of resuming the downtrend
■ Multiple Timeframe Approach
• Signal Confirmation Across Timeframes:
▶ Major signals on higher timeframes (4H, daily) provide strategic direction
▶ Signals on lower timeframes (15m, 1H) offer tactical entry points
▶ Highest probability setups occur when signals align across multiple timeframes
• Signal Clustering:
▶ Multiple signals in the same price area significantly increase probability
▶ Look for areas where both buy and sell signals have appeared, indicating battleground zones
▶ The most recent signal direction often wins these battles
─────────────────────────────────────
◆ Technical Foundation
■ Why Cross-Market Confirmation Matters
• Institutional Participation:
▶ CME Bitcoin futures are dominated by regulated institutional investors
▶ Crypto exchange futures include both retail and institutional players
▶ When both markets show the same smart money pattern, the signal reliability increases dramatically
• Market Inefficiency Exploitation:
▶ Large players often position across multiple venues to minimize market impact
▶ This coordinated activity creates detectable footprints when analyzed correctly
▶ Cross-market confirmation helps filter out market noise and isolate true smart money movements
■ Smart Volume Calculation Methodology
• Price-Volume Relationship Analysis:
▶ Uses candle structure to estimate buying vs. selling volume
▶ Buying volume = Total volume × (Close - Low) / (High - Low)
▶ Selling volume = Total volume × (High - Close) / (High - Low)
• Signal Triggering Logic:
▶ Buy signal: When buying volume exceeds selling volume by multiplier factor
▶ Sell signal: When selling volume exceeds buying volume by multiplier factor
▶ Both conditions must be met simultaneously on CME and exchange futures
• Advanced Pattern Recognition:
▶ Evaluates candle body-to-range ratio for signal quality
▶ Analyzes wick length and position for additional confirmation
▶ Considers recent highs/lows to detect potential turning points
─────────────────────────────────────
◆ Indicator Settings Guide
■ Main Settings
• CME Bitcoin Futures Symbol:
▶ Default: CME:BTC1!
▶ Purpose: Sets the CME futures contract to analyze alongside current chart
• Buy/Sell Volume Multiplier:
▶ Default: 3.0
▶ Range: 1.0-10.0
▶ Purpose: Determines how much buying volume must exceed selling volume (or vice versa) to trigger a signal
▶ Higher values = fewer but stronger signals
▶ Lower values = more signals but potentially lower reliability
■ Volume Filter Settings
• Enable Volume Filter:
▶ Default: Enabled
▶ Purpose: When enabled, only considers candles with above-threshold volume
• Volume Average Period:
▶ Default: 20 candles
▶ Range: 5-200 candles
▶ Purpose: Sets the lookback period for calculating average volume
• Volume Threshold:
▶ Default: 150%
▶ Range: 10%-500%
▶ Purpose: Minimum volume percentage (of average) required for signal consideration
▶ Higher values focus on only the most significant volume spikes
■ Signal Visualization
• Show Signal Strength Value:
▶ Default: Enabled
▶ Purpose: Displays the exact percentage strength value with each signal
• Energy Wave Colors:
▶ Buy Energy Wave: Green (#00ff80)
▶ Sell Energy Wave: Red (#ff4040)
▶ Purpose: Customize the appearance of energy waves for visual preference
■ Advanced Settings
• Use Advanced Strength Calculation:
▶ Default: Enabled
▶ Purpose: When enabled, uses the full multi-factor model for signal strength
▶ When disabled, uses only basic volume and ratio factors
─────────────────────────────────────
◆ Synergy with Other Indicators
• Support/Resistance Levels:
▶ Smart money signals occurring at key support/resistance significantly increase reliability
▶ Particularly powerful when signals appear at tested price levels
• Moving Averages:
▶ Signals near key moving averages (50MA, 200MA) often indicate institutional interest
▶ Moving average crosses combined with smart money signals create high-probability setups
• RSI/Momentum Indicators:
▶ Buy signals in oversold conditions increase probability of successful reversal
▶ Sell signals in overbought conditions increase probability of successful reversal
• Volume Profile:
▶ Signals occurring at high volume nodes often indicate significant turning points
▶ Low volume nodes between high volume areas can act as acceleration zones after signal triggers
• Market Structure:
▶ Smart money signals that break key market structure levels (higher highs/lows or lower highs/lows) are particularly significant
▶ Can signal the early stages of trend changes when aligned with structure breaks
─────────────────────────────────────
◆ Conclusion
The 52SIGNAL RECIPE CME-Exchange Smart Money Detector provides traders with a powerful edge by revealing institutional positioning across both regulated futures and crypto exchange markets. By requiring synchronized signals from both venues, it cuts through market noise to identify the most reliable smart money footprints.
What sets this indicator apart is its sophisticated cross-market verification system. Rather than relying on signals from a single market, it only triggers when both CME and exchange futures display the same smart money pattern simultaneously. This approach dramatically reduces false signals and highlights truly significant institutional activity.
The intuitive energy wave visualization system makes it easy to spot signals of varying strength, while the transparent percentage rating allows for objective assessment of each opportunity. By focusing on these dual-confirmed smart money movements, traders can position themselves alongside institutional players rather than against them.
Remember that the most powerful signals typically appear at key market junctures, often before significant price movements. By incorporating this indicator into your trading approach, you gain insight into institutional positioning that can help anticipate market direction with greater confidence.
─────────────────────────────────────
※ Disclaimer: Like all trading tools, the CME-Exchange Smart Money Detector should be used as a supplementary indicator and not relied upon exclusively for trading decisions. Past patterns of institutional behavior may not guarantee future market movements. Always employ appropriate risk management strategies in your trading.
================52SIGNAL RECIPE CME-Exchange Smart Money Detector==================
◆ 개요
52SIGNAL RECIPE CME-Exchange Smart Money Detector는 CME와 암호화폐 거래소의 선물 시장을 동시에 분석하여 기관 및 스마트 머니의 움직임을 포착하는 고급 기술적 지표입니다. 이 강력한 도구는 주요 가격 움직임에 선행하는 조직적인 매수 및 매도 패턴을 감지하여 트레이더들에게 시장 방향 예측에 유리한 정보를 제공합니다.
이 지표의 독보적인 특징은 교차 시장 검증 접근법에 있습니다. CME 비트코인 선물(기관 투자자 중심)과 암호화폐 거래소 선물(광범위한 시장 참여자) 모두에서 확인을 요구함으로써, 허위 신호를 크게 줄이고 일반적으로 시장 움직임을 선도하는 고확률 스마트 머니 흔적을 식별합니다.
─────────────────────────────────────
◆ 주요 특징
• 듀얼 마켓 확인: CME 비트코인 선물과 거래소 선물 차트를 동시에 분석하여 동기화된 스마트 머니 활동 식별
• 스마트 볼륨 분석: 캔들 구조와 가격 행동을 기반으로 매수 및 매도 볼륨을 분리하는 고급 알고리즘 사용
• 에너지 파동 시각화: 스마트 머니 신호를 신호 강도를 반영하는 다양한 크기의 직관적인 에너지 파동으로 표시
• 강도 평가 시스템: 신호 강도를 0-100% 척도로 수치화하고 여러 시각화 레벨(10%+, 40%+, 60%+, 80%+) 제공
• 캔들스틱 패턴 통합: 신호 신뢰성을 높이기 위해 상승/하락 캔들 형성을 분석에 통합
• 볼륨 스파이크 감지: 스마트 머니 포지셔닝을 동반하는 비정상적인 볼륨 증가 식별
• 추세 맥락 분석: 현재 시장 추세와 관련하여 신호를 평가하여 높은 확률의 설정 제공
• 동적 강도 계산: 볼륨 비율, 매수/매도 불균형, 캔들 구조 및 추세 일치도를 고려하는 다중 요소 모델 사용
• 투명한 신호 라벨링: 명확한 의사 결정을 위해 각 신호와 함께 정확한 강도 백분율 값 표시
• 실시간 기관 자금 흐름 모니터: 규제된(CME) 시장과 암호화폐 거래소 시장 모두에서 대형 플레이어의 흔적 추적
─────────────────────────────────────
◆ 신호 유형 이해하기
■ 매수 신호 에너지 파동 (녹색)
• 정의: 일반적으로 하락 캔들에서 CME와 거래소 선물 모두에서 동시에 상당한 매수 압력이 감지될 때 발생
• 시각적 모습: 가격 바 아래에 녹색 원형 파동으로 표시되며, 신호 강도에 따라 크기/불투명도 증가
• 시장 해석: 가격이 하락하는 동안에도 기관의 매수 관심이 있음을 나타내며, 종종 상승 반전에 선행
• 신호 강도 요소:
▶ 매도 볼륨 대비 높은 매수 볼륨
▶ 평균 이상의 총 거래량
▶ 하락 캔들의 아래 꼬리
▶ 주요 지지 수준에서의 출현
▶ 과매도 조건과 일치
■ 매도 신호 에너지 파동 (적색)
• 정의: 일반적으로 상승 캔들에서 CME와 거래소 선물 모두에서 동시에 상당한 매도 압력이 감지될 때 발생
• 시각적 모습: 가격 바 위에 적색 원형 파동으로 표시되며, 신호 강도에 따라 크기/불투명도 증가
• 시장 해석: 가격이 상승하는 동안에도 기관의 매도 관심이 있음을 나타내며, 종종 하락 반전에 선행
• 신호 강도 요소:
▶ 매수 볼륨 대비 높은 매도 볼륨
▶ 평균 이상의 총 거래량
▶ 상승 캔들의 위 꼬리
▶ 주요 저항 수준에서의 출현
▶ 과매수 조건과 일치
─────────────────────────────────────
◆ 신호 강도 이해하기
■ 네 가지 강도 레벨
• 레벨 1 (10-39%): 초기 감지
▶ 시각적: 가장 작은 에너지 파동
▶ 의미: 초기 스마트 머니 포지셔닝 감지
▶ 활용: 초기 경고, 가능한 설정 준비
• 레벨 2 (40-59%): 중간 강도
▶ 시각적: 중간-작은 에너지 파동
▶ 의미: 더 명확한 기관 포지셔닝
▶ 활용: 포지션 계획 시작, 확인 대기
• 레벨 3 (60-79%): 강한 신호
▶ 시각적: 중간-큰 에너지 파동
▶ 의미: 중요한 스마트 머니 흔적
▶ 활용: 고확률 설정 형성, 진입 고려
• 레벨 4 (80-100%): 예외적 강도
▶ 시각적: 가장 큰 에너지 파동
▶ 의미: 강력한 기관 움직임 확인
▶ 활용: 최고 확률 설정, 강한 확신의 진입 지점
■ 신호 강도 계산 이해하기
• 볼륨 구성 요소 (0-50 포인트):
▶ 현재 볼륨이 최근 평균과 비교하여 얼마나 높은지 측정
▶ 볼륨이 평균보다 2배 이상 높을 때 최대 포인트 부여
• 매수/매도 비율 구성 요소 (0-50 포인트):
▶ 매수와 매도 압력 간의 불균형 측정
▶ 비율이 미리 정의된 배율 임계값을 초과할 때 최대 포인트 부여
• 고급 가중치 요소:
▶ 캔들 구조: 몸통 크기, 꼬리 길이 및 방향
▶ 추세 일치: 현재 추세와의 신호 관계
▶ 볼륨 스파이크: 비정상적인 볼륨 증가 감지
▶ 교차 시장 확인: CME와 거래소 간 신호 일치 강도
─────────────────────────────────────
◆ 실전 트레이딩 응용
■ 반전 트레이딩 전략
• 매수 신호 응용:
▶ 설정: 하락 캔들에서 강한 매수 에너지 파동(60%+)
▶ 진입: 신호 이후 확인 캔들 이후
▶ 손절: 최근 저점 아래 또는 진입점 아래 1 ATR
▶ 이익실현: 이전 저항 또는 최소 1:2 리스크-리워드
▶ 강화 요소: 지지 구역, 과매도 조건 또는 추세선 테스트에서 발생하는 신호
• 매도 신호 응용:
▶ 설정: 상승 캔들에서 강한 매도 에너지 파동(60%+)
▶ 진입: 신호 이후 확인 캔들 이후
▶ 손절: 최근 고점 위 또는 진입점 위 1 ATR
▶ 이익실현: 이전 지지 또는 최소 1:2 리스크-리워드
▶ 강화 요소: 저항 구역, 과매수 조건 또는 추세선 테스트에서 발생하는 신호
■ 추세 지속 전략
• 상승 추세 중:
▶ 조정 중에 나타나는 매수 신호에 집중
▶ 주요 이동평균선이나 지지 수준에서 신호가 발생할 때 확률이 높음
▶ 가격이 상승 추세를 재개할 징후를 보일 때 강도에 맞춰 진입
• 하락 추세 중:
▶ 일시적 반등 중에 나타나는 매도 신호에 집중
▶ 주요 이동평균선이나 저항 수준에서 신호가 발생할 때 확률이 높음
▶ 가격이 하락 추세를 재개할 징후를 보일 때 강도에 맞춰 진입
■ 다중 시간프레임 접근법
• 다양한 시간프레임에서의 신호 확인:
▶ 상위 시간프레임(4시간, 일봉)의 주요 신호는 전략적 방향 제공
▶ 하위 시간프레임(15분, 1시간)의 신호는 전술적 진입 지점 제공
▶ 여러 시간프레임에서 신호가 일치할 때 가장 높은 확률의 설정 발생
• 신호 클러스터링:
▶ 동일한 가격 영역에서 여러 신호가 발생하면 확률이 크게 증가
▶ 매수와 매도 신호가 모두 나타난 영역을 찾아 전투 구역 식별
▶ 이러한 전투에서는 대개 가장 최근의 신호 방향이 우세
─────────────────────────────────────
◆ 기술적 기반
■ 교차 시장 확인이 중요한 이유
• 기관 참여:
▶ CME 비트코인 선물은 규제된 기관 투자자가 주도
▶ 암호화폐 거래소 선물은 소매 및 기관 플레이어 모두 포함
▶ 두 시장이 동일한 스마트 머니 패턴을 보일 때 신호 신뢰성이 크게 증가
• 시장 비효율성 활용:
▶ 대형 플레이어들은 시장 영향을 최소화하기 위해 여러 거래소에 걸쳐 포지션을 취하는 경우가 많음
▶ 이러한 조직적인 활동은 올바르게 분석할 때 감지 가능한 흔적을 남김
▶ 교차 시장 확인은 시장 노이즈를 필터링하고 진정한 스마트 머니 움직임을 분리하는 데 도움
■ 스마트 볼륨 계산 방법론
• 가격-볼륨 관계 분석:
▶ 캔들 구조를 사용하여 매수 대 매도 볼륨 추정
▶ 매수 볼륨 = 총 볼륨 × (종가 - 저가) / (고가 - 저가)
▶ 매도 볼륨 = 총 볼륨 × (고가 - 종가) / (고가 - 저가)
• 신호 트리거 로직:
▶ 매수 신호: 매수 볼륨이 매도 볼륨을 배율 요소만큼 초과할 때
▶ 매도 신호: 매도 볼륨이 매수 볼륨을 배율 요소만큼 초과할 때
▶ 두 조건 모두 CME와 거래소 선물에서 동시에 충족되어야 함
• 고급 패턴 인식:
▶ 신호 품질을 위한 캔들 몸통-범위 비율 평가
▶ 추가 확인을 위한 꼬리 길이 및 위치 분석
▶ 잠재적 전환점을 감지하기 위해 최근 고점/저점 고려
─────────────────────────────────────
◆ 지표 설정 가이드
■ 주요 설정
• CME 비트코인 선물 심볼:
▶ 기본값: CME:BTC1!
▶ 목적: 현재 차트와 함께 분석할 CME 선물 계약 설정
• 매수/매도 볼륨 배율:
▶ 기본값: 3.0
▶ 범위: 1.0-10.0
▶ 목적: 신호를 트리거하기 위해 매수 볼륨이 매도 볼륨을 얼마나 초과해야 하는지(또는 그 반대) 결정
▶ 높은 값 = 적지만 더 강한 신호
▶ 낮은 값 = 더 많은 신호지만 잠재적으로 낮은 신뢰성
■ 볼륨 필터 설정
• 볼륨 필터 활성화:
▶ 기본값: 활성화됨
▶ 목적: 활성화되면 임계값 이상의 볼륨을 가진 캔들만 고려
• 볼륨 평균 기간:
▶ 기본값: 20 캔들
▶ 범위: 5-200 캔들
▶ 목적: 평균 볼륨 계산을 위한 룩백 기간 설정
• 볼륨 임계값:
▶ 기본값: 150%
▶ 범위: 10%-500%
▶ 목적: 신호 고려에 필요한 최소 볼륨 백분율(평균 대비)
▶ 높은 값은 가장 중요한 볼륨 스파이크에만 집중
■ 신호 시각화
• 신호 강도 값 표시:
▶ 기본값: 활성화됨
▶ 목적: 각 신호와 함께 정확한 백분율 강도 값 표시
• 에너지 파동 색상:
▶ 매수 에너지 파동: 녹색(#00ff80)
▶ 매도 에너지 파동: 적색(#ff4040)
▶ 목적: 시각적 선호도에 맞게 에너지 파동의 모양 사용자 정의
■ 고급 설정
• 고급 강도 계산 사용:
▶ 기본값: 활성화됨
▶ 목적: 활성화되면 신호 강도에 전체 다중 요소 모델 사용
▶ 비활성화되면 기본 볼륨 및 비율 요소만 사용
─────────────────────────────────────
◆ 다른 지표와의 시너지
• 지지/저항 레벨:
▶ 주요 지지/저항에서 발생하는 스마트 머니 신호는 신뢰성을 크게 높임
▶ 특히 테스트된 가격 레벨에서 신호가 나타날 때 강력함
• 이동평균선:
▶ 주요 이동평균선(50MA, 200MA) 근처의 신호는 종종 기관의 관심을 나타냄
▶ 이동평균선 교차와 스마트 머니 신호의 조합은 고확률 설정 생성
• RSI/모멘텀 지표:
▶ 과매도 조건에서의 매수 신호는 성공적인 반전 확률 증가
▶ 과매수 조건에서의 매도 신호는 성공적인 반전 확률 증가
• 볼륨 프로파일:
▶ 높은 볼륨 노드에서 발생하는 신호는 종종 중요한 전환점을 나타냄
▶ 높은 볼륨 영역 사이의 낮은 볼륨 노드는 신호 트리거 후 가속 구간으로 작용할 수 있음
• 시장 구조:
▶ 주요 시장 구조 레벨(높은 고점/저점 또는 낮은 고점/저점)을 깨는 스마트 머니 신호는 특히 중요
▶ 구조 깨짐과 일치할 때 추세 변화의 초기 단계를 알릴 수 있음
─────────────────────────────────────
◆ 결론
52SIGNAL RECIPE CME-Exchange Smart Money Detector는 규제된 선물 시장과 암호화폐 거래소 시장 모두에서 기관의 포지셔닝을 드러냄으로써 트레이더에게 강력한 우위를 제공합니다. 두 거래소에서 동기화된 신호를 요구함으로써, 시장 노이즈를 제거하고 가장 신뢰할 수 있는 스마트 머니 흔적을 식별합니다.
이 지표를 차별화하는 것은 정교한 교차 시장 검증 시스템입니다. 단일 시장의 신호에 의존하는 대신, CME와 거래소 선물 모두가 동시에 동일한 스마트 머니 패턴을 표시할 때만 트리거됩니다. 이 접근 방식은 허위 신호를 크게 줄이고 진정으로 중요한 기관 활동을 강조합니다.
직관적인 에너지 파동 시각화 시스템을 통해 다양한 강도의 신호를 쉽게 발견할 수 있으며, 투명한 백분율 평가를 통해 각 기회를 객관적으로 평가할 수 있습니다. 이러한 이중 확인된 스마트 머니 움직임에 집중함으로써, 트레이더는 기관 참가자들에 대항하기보다는 그들과 함께 포지션을 취할 수 있습니다.
가장 강력한 신호는 일반적으로 주요 시장 변곡점에서, 종종 중요한 가격 움직임 이전에 나타난다는 점을 기억하세요. 이 지표를 트레이딩 접근법에 통합함으로써, 시장 방향을 더 높은 확신으로 예측하는 데 도움이 되는 기관 포지셔닝에 대한 통찰력을 얻을 수 있습니다.
─────────────────────────────────────
※ 면책 조항: 모든 트레이딩 도구와 마찬가지로, CME-Exchange Smart Money Detector는 보조 지표로 사용되어야 하며 트레이딩 결정을 전적으로 의존해서는 안 됩니다. 과거의 기관 행동 패턴이 미래 시장 움직임을 보장하지는 않습니다. 항상 적절한 리스크 관리 전략을 트레이딩에 사용하세요.

52SIGNAL RECIPE CME Gap Support & Resistance Detector═══ 52SIGNAL RECIPE CME Gap Support & Resistance Detector ═══
◆ Overview
The 52SIGNAL RECIPE CME Gap Support & Resistance Detector is an advanced technical indicator that automatically detects and visualizes all types of price gaps occurring in the CME Bitcoin futures market on trading charts. It captures not only gaps formed during weekend and holiday closures, but also those created during the daily 1-hour maintenance period on weekdays, and sudden price gaps resulting from economic indicator releases or news events.
The core value of this indicator lies beyond simply displaying gaps; it visualizes how these price discontinuities act as powerful support and resistance zones that influence future price movements. In real markets, these CME gaps have a high probability of either being "filled" or functioning as important reaction zones, providing traders with valuable entry and exit signals.
─────────────────────────────────────
◆ Key Features
• Comprehensive Gap Detection: Detects gaps in all market conditions
- Weekend/holiday closure gaps
- Weekday 1-hour maintenance period gaps
- Gaps from economic indicators/news events causing rapid price changes
• Intuitive Color Coding:
- Blue: When gaps act as support (price is above the gap)
- Red: When gaps act as resistance (price is below the gap)
- Gray: Filled gaps (price has completely passed through the gap area)
• Real-time Role Switching: Automatically changes colors as price moves above/below gaps, visualizing support↔resistance role transitions
• Status Tracking System: Automatically tracks whether gaps are "Filled" or "Unfilled"
• Dynamic Boxes: Clearly marks gap areas with boxes and dynamically changes colors based on price movement
• Precise Labeling: Accurately displays the price range of each gap to support trader decision-making
• Smart Filtering: Improved algorithm that solves consecutive gap detection issues for complete gap tracking
• Key Usage Points:
- Pay special attention when price approaches gap areas
- Color changes in gaps signal important market sentiment shifts
- Areas with multiple clustered gaps are particularly strong reaction zones
─────────────────────────────────────
◆ User Guide: Understanding Gap Roles Through Colors
■ Color System Interpretation
• Blue Gaps (Support Role):
▶ Meaning: Current price is above the gap, making the gap act as support
▶ Trading Application: Consider buying opportunities when price approaches blue gap areas
▶ Psychological Meaning: Buying pressure likely to increase at this price level
• Red Gaps (Resistance Role):
▶ Meaning: Current price is below the gap, making the gap act as resistance
▶ Trading Application: Consider selling opportunities when price approaches red gap areas
▶ Psychological Meaning: Selling pressure likely to increase at this price level
• Gray Gaps (Filled Gaps):
▶ Meaning: Price has completely passed through the gap area, filling the gap
▶ Reference Value: Still valuable as reference for past important reaction zones
▶ Trading Application: Used to confirm trend strength and identify key psychological levels
■ Understanding Color Transitions
• Blue → Red Transition:
▶ Meaning: Price has fallen below the gap, changing its role from support to resistance
▶ Market Interpretation: Breakdown of previous support strengthens bearish signals
▶ Trading Application: Consider potential further decline; check gap bottom as resistance during bounces
• Red → Blue Transition:
▶ Meaning: Price has risen above the gap, changing its role from resistance to support
▶ Market Interpretation: Breakout above previous resistance strengthens bullish signals
▶ Trading Application: Consider potential further rise; check gap top as support during pullbacks
─────────────────────────────────────
◆ Practical Application Guide
■ Basic Trading Scenarios
• Blue Gap Support Strategy:
▶ Entry Point: When price approaches the top of a blue gap and forms a bounce candle
▶ Stop Loss: Below the gap bottom (if price completely breaks down through the gap)
▶ Take Profit: Previous swing high or next resistance level above
▶ Probability Enhancers: Gap aligned with major moving averages, oversold RSI, strong bounce candle pattern
• Red Gap Resistance Strategy:
▶ Entry Point: When price approaches the bottom of a red gap and forms a rejection candle
▶ Stop Loss: Above the gap top (if price completely breaks up through the gap)
▶ Take Profit: Previous swing low or next support level below
▶ Probability Enhancers: Gap aligned with major moving averages, overbought RSI, strong rejection candle pattern
■ Advanced Pattern Applications
• Multiple Gap Cluster Identification:
▶ Several gaps in close price proximity form extremely powerful support/resistance zones
▶ Same-color gap clusters: Very strong single-direction reaction zones
▶ Mixed-color gap clusters: High volatility zones with bidirectional reactions expected
• Gap Sequence Analysis:
▶ Consecutive same-direction gaps: Strong trend confirmation signal
▶ Increasing gap size pattern: Trend acceleration signal
▶ Decreasing gap size pattern: Trend weakening signal
• News/Indicator Release Gap Utilization:
▶ Gaps formed immediately after economic indicators: Measure market shock intensity
▶ Gap color change observation: Track market reinterpretation of news
▶ Gap filling speed analysis: Evaluate news impact duration
• Key Attention Points:
▶ Pay special attention to the chart whenever price approaches gap areas
▶ Gap color changes signal important market sentiment shifts
▶ Areas with multiple concentrated gaps are likely to show strong price reactions
─────────────────────────────────────
◆ Technical Foundation
■ CME Gap Formation Principles
• Key Gap Formation Scenarios:
▶ Weekend Closures (Friday close → Monday open): Most common CME gap formation point
▶ Holiday Closures: Gaps occurring due to CME closures on US holidays
▶ Weekday 1-hour Maintenance: Gaps during daily CME maintenance period (16:00-17:00 CT)
▶ Major Economic Indicator Releases: Gaps from rapid price changes during US employment reports, FOMC decisions, CPI releases, etc.
▶ Significant News Events: Gaps from regulatory announcements, geopolitical events, market shocks, etc.
• Psychological Importance of Gaps:
▶ Zones where price formation did not occur, representing imbalance between buying/selling forces
▶ Gap areas have no actual trading, resulting in accumulated potential orders
▶ Reflect institutional investor positions and liquidity distribution in the CME futures market
■ Support/Resistance Mechanism
• Psychological Level Formation Mechanism:
▶ Unexecuted order accumulation in gap areas: Loss of ordering opportunity at those price levels
▶ Liquidity imbalance: No trading occurred in gap areas, creating liquidity voids
▶ Institutional activity: Institutional participants in CME futures markets pay attention to these gap areas
• Evidence of Support/Resistance Function:
▶ Statistical gap fill phenomenon: Most gaps eventually "fill" (price returns to gap area)
▶ Gap-based reactions: Increased frequency of price reactions (bounces/rejections) when reaching gap areas
▶ Market psychology impact: Influences traders' perceived value and fair price assessment
─────────────────────────────────────
◆ Advanced Configuration Options
■ Visualization Settings
• Show Gap Labels (Default: On)
▶ On: Displays price ranges of each gap numerically for precise support/resistance level identification
▶ Off: Hides labels for visual cleanliness
• Color Settings
▶ Filled Gap Color: Gray tones, shows gaps already traversed by price
▶ Unfilled Gap Color - Support: Blue, shows gaps currently acting as support
▶ Unfilled Gap Color - Resistance: Red, shows gaps currently acting as resistance
■ Data Management Settings
• Filled Gap Storage Limit (Default: 10)
▶ Sets maximum number of filled gaps to retain on chart
▶ Recommended settings: Short-term traders (5-8), Swing traders (8-12), Position traders (10-15)
• Maximum Gap Retention Period (Default: 12 months)
▶ Sets period after which old unfilled gaps are automatically removed
▶ Recommended settings: Short-term analysis (3-6 months), Medium-term analysis (6-12 months), Long-term analysis (12-24 months)
─────────────────────────────────────
◆ Synergy with Other Indicators
• Volume Profile: Greatly increased reaction probability when CME gaps align with Volume Profile value areas
• Fibonacci Retracements: Formation of powerful reaction zones when major Fibonacci levels coincide with gap areas
• Moving Averages: Areas where major moving averages overlap with CME gaps act as "composite support/resistance"
• Horizontal Support/Resistance: Very strong price reactions expected when historical key price levels align with CME gaps
• Market Sentiment Indicators (RSI/MACD): Assess reaction probability by checking oversold/overbought conditions when price approaches gap areas
─────────────────────────────────────
◆ Conclusion
The 52SIGNAL RECIPE CME Gap Support & Resistance Detector is not merely a gap display tool, but an advanced analytical tool that visualizes important support/resistance areas where price may strongly react, using intuitive color codes (blue=support, red=resistance). It detects all types of gaps without omission, whether from weekend and holiday closures, weekday 1-hour maintenance periods, important economic indicator releases, or market shock situations.
The core value of this indicator lies in clearly expressing through intuitive color coding that gaps are not simple price discontinuities, but psychological support/resistance areas that significantly influence future price action. Traders can instantly identify areas where blue gaps act as support and red gaps act as resistance, enabling quick and effective decision-making.
By referencing the color codes when price approaches gap areas to predict possible price reactions, and especially interpreting color transition moments (blue→red or red→blue) as signals of important market sentiment changes and integrating them into trading strategies, traders can capture higher-probability trading opportunities.
─────────────────────────────────────
※ Disclaimer: Like all trading tools, the CME Gap Detector should be used as a supplementary indicator and not relied upon alone for trading decisions. Past gap reaction patterns cannot guarantee the same behavior in the future. Always use appropriate risk management strategies.
═══ 52SIGNAL RECIPE CME Gap Support & Resistance Detector ═══
◆ 개요
52SIGNAL RECIPE CME Gap Support & Resistance Detector는 CME 비트코인 선물 시장에서 발생하는 모든 유형의 가격 갭(Gap)을 자동으로 감지하여 트레이딩 차트에 시각화하는 고급 기술적 지표입니다. 주말과 공휴일 휴장은 물론, 평일 1시간 휴장 시간, 그리고 중요 경제지표 발표나 뉴스 이벤트 시 발생하는 급격한 가격 갭까지 누락 없이 포착합니다.
이 인디케이터의 핵심 가치는 단순히 갭을 표시하는 것을 넘어, 이러한 가격 불연속성이 미래 가격 움직임에 영향을 미치는 강력한 지지(Support)와 저항(Resistance) 영역으로 작용한다는 원리를 시각화하는 데 있습니다. 실제 시장에서 이러한 CME 갭은 높은 확률로 미래에 "매꿔지거나" 중요한 반응 구간으로 기능하여 트레이더에게 귀중한 진입/퇴출 신호를 제공합니다.
─────────────────────────────────────
◆ 주요 특징
• 전방위 갭 감지: 모든 시장 조건에서 발생하는 갭을 감지
- 주말/공휴일 휴장 갭
- 평일 1시간 휴장 시간 갭
- 경제지표/뉴스 이벤트 시 급격한 가격 변동 갭
• 직관적 색상 구분:
- 파란색: 갭이 지지 역할을 할 때(가격이 갭 위에 있을 때)
- 빨간색: 갭이 저항 역할을 할 때(가격이 갭 아래에 있을 때)
- 회색: 이미 매꿔진 갭(가격이 갭 영역을 완전히 통과)
• 실시간 역할 전환: 가격이 갭 위/아래로 이동함에 따라 지지↔저항 역할 전환을 자동으로 색상 변경으로 시각화
• 상태 추적 시스템: 갭이 "매꿔짐(Filled)" 또는 "매꿔지지 않음(Unfilled)" 상태를 자동 추적
• 다이나믹 박스: 갭 영역을 명확한 박스로 표시하고 가격 움직임에 따라 동적으로 색상 변경
• 정밀 레이블링: 각 갭의 가격 범위를 정확히 표시하여 트레이더의 의사결정 지원
• 스마트 필터링: 연속적 갭 감지 문제를 해결하는 개선된 알고리즘으로 누락 없는 갭 추적
• 핵심 활용 포인트:
- 가격이 갭 영역에 접근할 때 특별히 주목하세요
- 갭 색상 변경 시점은 중요한 시장 심리 변화 신호입니다
- 여러 갭이 밀집된 영역은 특히 강한 반응이 예상되는 구간입니다
─────────────────────────────────────
◆ 사용 가이드: 색상으로 이해하는 갭 역할
■ 색상 시스템 해석법
• 파란색 갭 (지지 역할):
▶ 의미: 현재 가격이 갭 위에 있어 갭이 지지선으로 작용
▶ 트레이딩 응용: 가격이 파란색 갭 영역으로 하락 접근 시 매수 기회 고려
▶ 심리적 의미: 매수세력이 이 가격대에서 수요 증가 가능성
• 빨간색 갭 (저항 역할):
▶ 의미: 현재 가격이 갭 아래에 있어 갭이 저항선으로 작용
▶ 트레이딩 응용: 가격이 빨간색 갭 영역으로 상승 접근 시 매도 기회 고려
▶ 심리적 의미: 매도세력이 이 가격대에서 공급 증가 가능성
• 회색 갭 (매꿔진 갭):
▶ 의미: 가격이 갭 영역을 완전히 통과하여 갭이 매꿔진 상태
▶ 참조 가치: 과거 중요 반응 구간으로 여전히 참고 가치 있음
▶ 트레이딩 응용: 추세 강도 확인 및 주요 심리적 레벨 식별에 활용
■ 색상 전환 이해하기
• 파란색 → 빨간색 전환:
▶ 의미: 가격이 갭 아래로 하락하여 갭이 지지에서 저항으로 역할 변경
▶ 시장 해석: 이전 지지선 붕괴로 약세 신호 강화
▶ 트레이딩 응용: 추가 하락 가능성 고려, 반등 시 갭 하단 저항 확인
• 빨간색 → 파란색 전환:
▶ 의미: 가격이 갭 위로 상승하여 갭이 저항에서 지지로 역할 변경
▶ 시장 해석: 이전 저항선 돌파로 강세 신호 강화
▶ 트레이딩 응용: 추가 상승 가능성 고려, 조정 시 갭 상단 지지 확인
─────────────────────────────────────
◆ 실전 활용 가이드
■ 기본 트레이딩 시나리오
• 파란색 갭 지지 전략:
▶ 진입 시점: 가격이 파란색 갭 상단에 접근하여 반등 캔들 형성 시
▶ 손절 위치: 갭 하단 아래(갭 완전히 하향 돌파 시)
▶ 이익실현: 이전 스윙 고점 또는 상방 다음 저항선
▶ 확률 증가 조건: 갭과 주요 이동평균선 일치, 과매도 RSI, 강한 반등 캔들
• 빨간색 갭 저항 전략:
▶ 진입 시점: 가격이 빨간색 갭 하단에 접근하여 거부 캔들 형성 시
▶ 손절 위치: 갭 상단 위(갭 완전히 상향 돌파 시)
▶ 이익실현: 이전 스윙 저점 또는 하방 다음 지지선
▶ 확률 증가 조건: 갭과 주요 이동평균선 일치, 과매수 RSI, 강한 거부 캔들
■ 고급 패턴 활용법
• 다중 갭 클러스터 식별:
▶ 여러 갭이 근접한 가격대에 있다면 더욱 강력한 지지/저항 존
▶ 동일 색상 갭 클러스터: 매우 강력한 단일 방향 반응 구간
▶ 색상 혼합 갭 클러스터: 심한 변동성과 양방향 반응 예상 구간
• 갭 시퀀스 분석:
▶ 연속적인 동일 방향 갭: 강한 추세 확인 신호
▶ 갭 크기 증가 패턴: 추세 가속화 신호
▶ 갭 크기 감소 패턴: 추세 약화 신호
• 뉴스/지표 발표 후 갭 활용:
▶ 경제지표 발표 직후 형성된 갭: 시장 충격 강도 측정
▶ 갭 색상 변화 관찰: 시장의 뉴스 재해석 과정 파악
▶ 갭 매꿈 속도 분석: 뉴스 임팩트의 지속성 평가
• 핵심 주목 포인트:
▶ 가격이 갭 영역에 접근할 때마다 차트를 특별히 주목하세요
▶ 갭 색상이 변경되는 시점은 중요한 시장 심리 변화를 의미합니다
▶ 여러 갭이 밀집된 영역은 가격이 강하게 반응할 가능성이 높습니다
─────────────────────────────────────
◆ 기술적 기반
■ CME 갭의 발생 원리
• 주요 갭 발생 상황:
▶ 주말 휴장 (금요일 종가 → 월요일 시가): 가장 일반적인 CME 갭 형성 시점
▶ 공휴일 휴장: 미국 공휴일에 따른 CME 휴장 시 발생
▶ 평일 1시간 휴장: CME 시장의 일일 정비 시간(16:00~17:00 CT) 동안 발생
▶ 주요 경제지표 발표: 미 고용지표, FOMC 결정, CPI 등 발표 시 급격한 가격 변동으로 인한 갭
▶ 중요 뉴스 이벤트: 규제 발표, 지정학적 이벤트, 시장 충격 등으로 인한 급격한 가격 변화
• 갭의 심리적 중요성:
▶ 가격 형성이 이루어지지 않은 구간으로, 매수/매도 세력의 불균형 영역
▶ 갭 구간에는 실제 거래가 없었기 때문에 잠재적 주문이 누적되는 영역
▶ 기관 투자자들의 선물 포지션과 유동성 분포가 반영된 중요한 가격 레벨
■ 지지/저항으로 작용하는 원리
• 심리적 레벨 형성 메커니즘:
▶ 갭 구간의 미실행 주문 축적: 갭 발생 시 해당 가격대에 대한 주문 기회 상실
▶ 유동성 불균형: 갭 구간에는 거래가 없었으므로 유동성 공백 발생
▶ 기관 투자자 활동: CME 선물 시장의 기관 참여자들은 이러한 갭 영역에 관심
• 지지/저항 작용 증거:
▶ 통계적 갭 필 현상: 대부분의 갭은 미래에 "매꿔짐"(가격이 갭 구간으로 회귀)
▶ 갭 기반 반응: 갭 영역에 도달 시 가격 반응(반등/거부) 발생 빈도 증가
▶ 시장 심리 영향: 트레이더들의 인지된 가치와 공정가격 평가에 영향
─────────────────────────────────────
◆ 고급 설정 옵션
■ 시각화 설정
• 라벨 표시 설정 (Show Gap Labels) (기본값: 켜짐)
▶ 켜짐: 각 갭의 가격 범위를 숫자로 표시하여 정확한 지지/저항 레벨 확인
▶ 꺼짐: 시각적 깔끔함을 위해 라벨 숨김
• 색상 설정
▶ 매꿔진 갭 색상(Filled Gap Color): 회색 계열, 이미 가격이 통과한 갭 표시
▶ 미매꿔진 갭 색상 - 지지(Support): 파란색, 현재 지지 역할을 하는 갭
▶ 미매꿔진 갭 색상 - 저항(Resistance): 빨간색, 현재 저항 역할을 하는 갭
■ 데이터 관리 설정
• 매꿔진 갭 저장 한도 (Filled Gap Storage Limit) (기본값: 10)
▶ 이미 매꿔진 갭을 최대 몇 개까지 차트에 유지할지 설정
▶ 권장 설정: 단기 트레이더(5-8), 스윙 트레이더(8-12), 포지션 트레이더(10-15)
• 최대 갭 보관 기간 (Maximum Gap Retention Period) (기본값: 12개월)
▶ 오래된 미매꿔진 갭을 자동으로 제거하는 기간 설정
▶ 권장 설정: 단기 분석(3-6개월), 중기 분석(6-12개월), 장기 분석(12-24개월)
─────────────────────────────────────
◆ 다른 지표와의 시너지
• 볼륨 프로파일: CME 갭과 볼륨 프로파일의 밸류 영역 일치 시 반응 확률 크게 증가
• 피보나치 리트레이스먼트: 주요 피보나치 레벨과 갭 영역 일치 시 강력한 반응 존 형성
• 이동평균선: 주요 이동평균선과 CME 갭이 겹치는 영역은 "복합 지지/저항"으로 작용
• 수평 지지/저항: 과거 중요 가격대와 CME 갭 일치 시 매우 강력한 가격 반응 예상 가능
• 시장 심리 지표(RSI/MACD): 갭 영역 접근 시 과매수/과매도 확인으로 반응 가능성 판단
─────────────────────────────────────
◆ 결론
52SIGNAL RECIPE CME Gap Support & Resistance Detector는 단순한 갭 표시 도구가 아닌, 가격이 강하게 반응할 수 있는 중요한 지지/저항 영역을 직관적인 색상 코드(파란색=지지, 빨간색=저항)로 시각화하는 고급 분석 도구입니다. 주말과 공휴일 휴장 시간뿐만 아니라, 평일 1시간 휴장 시간, 중요 경제지표 발표, 그리고 시장 충격 상황에서 발생하는 모든 유형의 갭을 누락 없이 감지합니다.
인디케이터의 핵심 가치는 갭이 단순한 가격 불연속성이 아닌, 미래 가격 행동에 중요한 영향을 미치는 심리적 지지/저항 영역임을 직관적인 색상 코드로 명확히 표현하는 데 있습니다. 파란색 갭은 지지 역할을, 빨간색 갭은 저항 역할을 하는 영역을 즉각적으로 식별할 수 있어 트레이더가 빠르고 효과적인 의사결정을 내릴 수 있도록 도와줍니다.
갭 영역에 접근할 때마다 색상 코드를 참고하여 가능한 가격 반응을 예측하고, 특히 색상 전환이 일어나는 순간(파란색→빨간색 또는 빨간색→파란색)은 중요한 시장 심리 변화 신호로 해석하여 트레이딩 전략에 통합한다면, 더 높은 확률의 거래 기회를 포착할 수 있을 것입니다.
─────────────────────────────────────
※ 면책 조항: 모든 트레이딩 도구와 마찬가지로, CME Gap Detector는 보조 지표로 사용되어야 하며 단독으로 거래 결정을 내리는 데 사용해서는 안 됩니다. 과거의 갭 반응 패턴이 미래에도 동일하게 작용한다고 보장할 수 없습니다. 항상 적절한 리스크 관리 전략을 사용하세요.

DB - CME Gap [Multi Asset Auto Detection: BTC,SOL, etc]DB - CME Gap is a pro-grade, zero-maintenance CME gap tracker designed for serious traders.
This script automatically detects unfilled CME futures gaps across a wide range of assets—crypto, equities, bonds, commodities, FX, and agriculture—by pulling the official Friday close from CME’s daily futures data. It visually highlights unfilled weekend gaps and keeps them active on the chart until the price fully crosses through the gap level, offering a reliable view of market inefficiencies that often attract future liquidity.
Whether you're trading BTC, ES, CL, ZN, 6E, or ZC... this tool auto-detects and adjusts to the asset you're charting, so you don’t need to change any settings.
🧠 Key Benefits
Fully Automated – No symbol selection required; works instantly across asset classes
Professional Grade – Clean, minimal visuals with dynamic gap tracking
Always Accurate – Uses CME official daily closes to identify true weekend gaps
Cross-Market Versatility – Supports a broad range of assets without editing code
✅ Features
🔍 Auto Symbol Detection
Automatically identifies whether you're viewing BTC, ETH, SOL, ES, NQ, CL, ZN, 6E, GC, ZC, and more—no input required.
📅 CME Friday Close Logic
Pulls the actual Friday close from CME's daily data to detect accurate gap reference points.
🚨 Weekend Gap Detection
Monitors Friday after-hours, Saturday, and Sunday to detect gaps between CME close and weekend price action.
🧠 Persistent Gap Tracking
Gaps remain active until price fully crosses the gap level—no false closures.
📈 Dynamic Line Drawing
Draws a horizontal line at the gap price and extends it to the point of fill.
🌈 Custom Gradient Shading
Fills the area between the current price and the CME gap with directional color gradients based on price movement.
🎨 User-Configurable Colors
Adjust bull and bear fill color themes to suit your personal style.
🧩 Compatible with All Major Asset Classes
Works with:
Crypto: BTC, ETH, SOL
Equities: ES, NQ, YM, MES, MNQ
Bonds & Rates: ZN, ZB, ZF, ZT, GE
Commodities: CL, GC, NG, BZ, SI
FX: 6E, 6J, 6B
Ags: ZC (Corn), ZS (Soybeans)

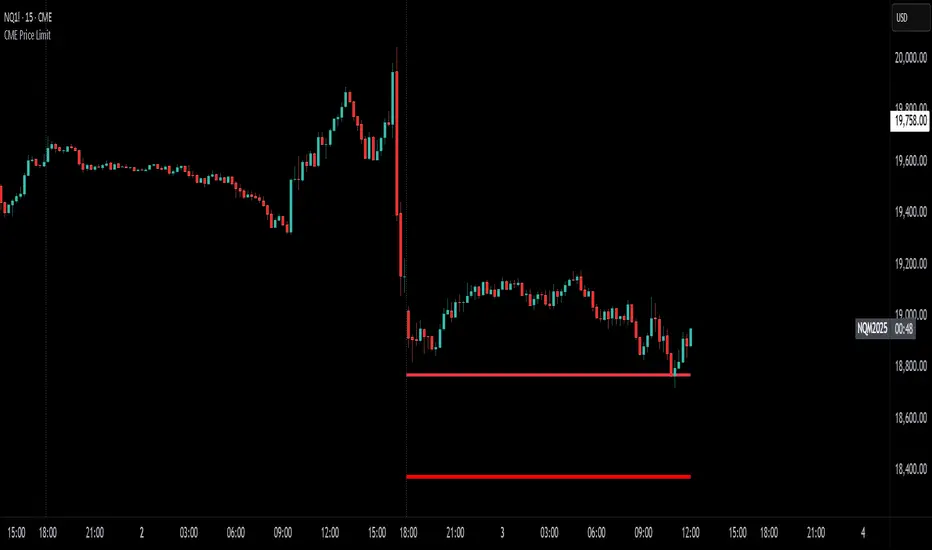
CME Price LimitCalculates the CME Price Limit
The reference price is obtained from the previous day's closing settlement price
(data pulled from the asset's daily chart with settlement enabled)
Percentage limit can be modified in settings
Buffer can be enabled (for example, 2% buffer on a 7% limit, so a line gets drawn at 5% too)
Alert can be enabled for price crossing a certain percentage from reference on the day
You can choose to plot the historical lines on every day, or the current day only
The reference price output can be found in the data window, or in the indicator status line if enabled in the settings.
Before placing real trades with this, you should compare the indicator's reference price to what's shown on CME's website, to double check that TradingView's data matches for your contract.
www.cmegroup.com
Combined Bitcoin CME Gaps and Weekend DaysScript Description: Combined Bitcoin CME Gaps and Weekend Days
Author: NeoButane (Bitcoin CME Gaps), JohnIsTrading (Day of Week),
Contributor : MikeTheRuleTA (Combined and optimizations)
This Pine Script indicator provides a combined view of Bitcoin CME gaps and customizable weekend day backgrounds on your chart. It’s designed to help traders visualize CME gaps along with customizable weekend day highlights.
Features:
CME Gaps Visualization:
Enable CME Gaps: Toggle the display of CME gaps on your chart.
Show Real vs. CME Price: Choose whether to display chart prices or CME prices for gap analysis.
Weekend Gaps Only: Filter to show only weekend gaps for a cleaner view (note: this may miss holidays).
CME Gaps Styling:
Weekend Background Highlighting:
Enable Weekend Background: Toggle the weekend day background highlight on or off.
Timezone Selection: Choose the relevant timezone for accurate weekend highlighting.
Customizable Weekend Colors: Define colors for Saturday and Sunday backgrounds.
How It Works:
CME Gaps: The script identifies gaps between CME and chart prices when the CME session is closed. It plots these gaps with customizable colors and line widths.
You can choose to see gaps based on CME prices or chart prices and decide whether to include only weekends.
Weekend Backgrounds: The script allows for background highlighting of weekends (Saturday and Sunday) on your chart. This can be enabled or disabled and customized with specific colors.
The timezone setting ensures that the background highlights match your local time settings.
Inputs:
CME Gaps Settings:
Enable CME Gaps
Show Real vs. CME Price
Only Show Weekend Gaps
CME Gaps Style:
Gap Fill Color Up
Gap Fill Color Down
Gap Fill Transparency
Weekend Settings:
Enable Weekend Background
Timezone
Enable Saturday
Saturday Color
Enable Sunday
Sunday Color
Usage:
Add this script to your TradingView chart to overlay CME gaps and weekend highlights.
Adjust the settings according to your preferences for a clearer view of gaps and customized weekend backgrounds.
This indicator provides a comprehensive tool for tracking CME gaps and understanding weekend market behaviors through visual enhancements on your trading charts.
Futures Settlement [NeoButane]Traders use settlement prices as both support/resistance and as a target for price to trend towards. The intention of this script is to provide possible entry and exit levels for swing and scalp trades by drawing horizontal lines of true settlement prices provided by TradingView.
The settlement price, which is calculated daily, is used to determine the profit/loss of a trader's futures position. Prior to the daily close, price settlement of futures contracts is performed by taking the average of its traded price during a specified period of time.
Usage
The settlement prices, shown as horizontal lines, serve as support or resistance for entry or exit. There are hundreds of ways to combine this with favorite indicators, or it can be used as levels for pure price action traders.
See how settlement price levels can be used in confluence with oscillators.
Configuration
Toggles to show each settlement. Reprint shows prior weeks or months after they've ended. Back-adjusted futures, which affect expired futures price history on continuous futures charts, should only be enabled on non-standard charts to match the user's chart settings.
What this script does
This script plots the daily, weekly, and monthly settlements for futures, including an average for the two most recent weekly or monthly settlements. The weekly settlement uses the last day of the week's daily settlement and the monthly settlement uses the last day of the month's daily settlement. For symbols that do not have settlement prices, which will be almost if not all symbols that are not futures, the settlement price instead becomes price at the last second before the daily/weekly/monthly close. In those cases, this script becomes a tool for automatically plotting daily/weekly/monthly closes.
See below for two different bitcoin charts. The chart on top is a non-futures chart and a futures chart is at the bottom. Note that CME bitcoin futures settle 4 hours (1500 CST) before bitcoin's daily close (UTC).
How this script works
TradingView has a built-in ability to display daily settlements instead of the actual daily close. This can be enabled in chart settings for futures on the daily timeframe and there is an argument for Pine Script to do so as well. Because settlement times are different for multiple products during the day, the script uses the settlement price from daily timeframe, which is guaranteed to be correct because TradingView is wonderful. I accidentally found the undocumented backadjustment and settlement_at_close when I was trying to use ticker.inherit() to create a symbol with its daily close time changed to another symbol's, which I still haven't figured out. TradingView has since added documentation for both of them, but there's still an ambiguous 'etc.' in the description of ticker.inherit() so maybe there's more secret arguments...
The script is able to be used on non-standard charts by using ticker.standard(), but back-adjustment will need to be changed by input to match chart settings.
References
Investopedia explanation of settlement price.
www.investopedia.com
Settlement prices for ES.
www.cmegroup.com
CME summary of settlement price.
www.cmegroup.com
How to enable settlement price as close for daily intervals in TradingView. This does not affect the use of this script.
www.tradingview.com
About back-adjustment for continuous futures charts in TradingView.
www.tradingview.com

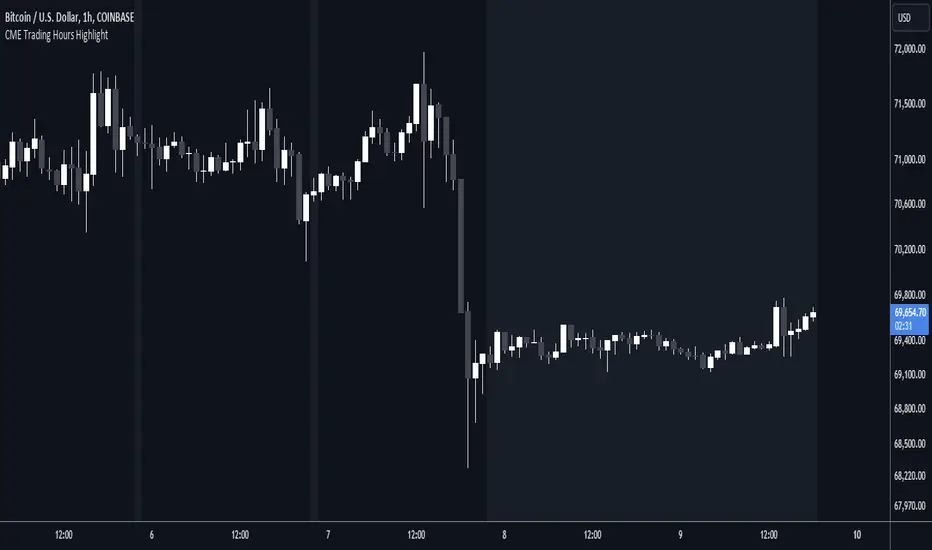
CME Trading Hours HighlightDisplay the times when the CME is or isn't trading, on a non-CME symbol.
The Chicago Mercantile Exchange hours are usually from 17:00 one day to 16:00 the next, with an hour's break. Trading halts from Friday evening to Sunday evening. The exchange is in Chicago.
You might want to display these hours if you trade the same asset on a different exchange. For example, you might want to overlay the CME BTC1! hours on a Coinbase BTC chart to see how trading in these futures contracts affects the market.
Inputs:
Shade Outside Trading Hours - If selected (the default), then the chart background is shaded when the CME is closed. If unselected, the background is shaded when it's open.
Highlight Color - The colour to use for the background shade.
Just for fun, I wanted to publish a useful script that only took up one line 😁
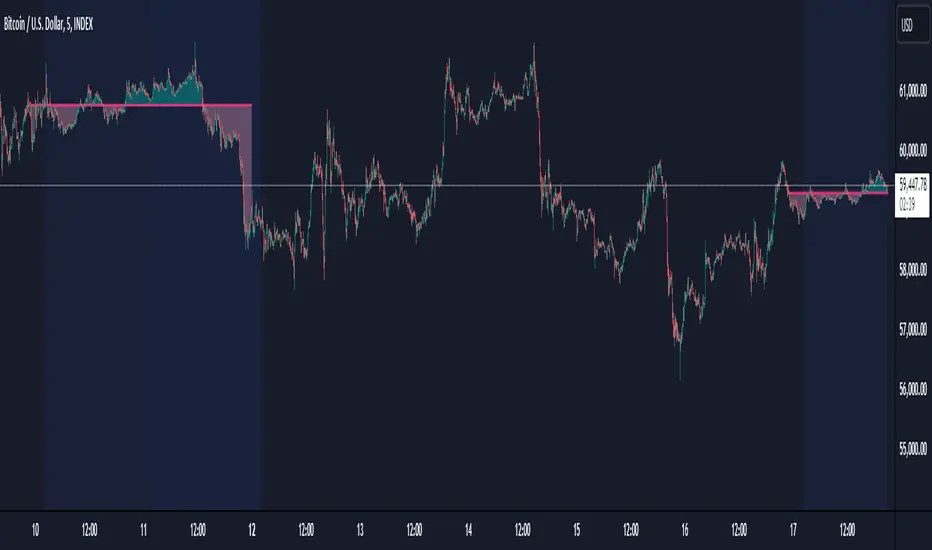
CME Gap Oscillator [CryptoSea]Introducing the CME Gap Oscillator , a pioneering tool designed to illuminate the significance of market gaps through the lens of the Chicago Mercantile Exchange (CME). By leveraging gap sizes in relation to the Average True Range (ATR), this indicator offers a unique perspective on market dynamics, particularly around the critical weekly close periods.
Key Features
Gap Measurement : At its core, the CME Oscillator quantifies the size of weekend gaps in the context of the market's volatility, using the ATR to standardize this measurement.
Dynamic Levels : Incorporating a dynamic extreme level calculation, the tool adapts to current market conditions, providing real-time insights into significant gap sizes and their implications.
Band Analysis : Through the introduction of upper and lower bands, based on standard deviations, traders can visually assess the oscillator's position relative to typical market ranges.
Enhanced Insights : A built-in table tracks the frequency of the oscillator's breaches beyond these bands within the latest CME week, offering a snapshot of recent market extremities.
Settings & Customisation
ATR-Based Measurement : Choose to measure gap sizes directly or in terms of ATR for a volatility-adjusted view.
Band Period Adjustability : Tailor the oscillator's sensitivity by modifying the band calculation period.
Dynamic Level Multipliers : Adjust the multiplier for dynamic levels to suit your analysis needs.
Visual Preferences : Customise the oscillator, bands, and table visuals, including color schemes and line styles.
In the example below, it demonstrates that the CME will want to return to the 0 value, this would be considered a reset or gap fill.
Application & Strategy
Deploy the CME Oscillator to enhance your market analysis
Market Sentiment : Gauge weekend market sentiment shifts through gap analysis, refining your strategy for the week ahead.
Volatility Insights : Use the oscillator's ATR-based measurements to understand the volatility context of gaps, aiding in risk management.
Trend Identification : Identify potential trend continuations or reversals based on the frequency and magnitude of gaps exceeding dynamic levels.
The CME Oscillator stands out as a strategic tool for traders focusing on gap analysis and volatility assessment. By offering a detailed breakdown of market gaps in relation to volatility, it empowers users with actionable insights, enabling more informed trading decisions across a range of markets and timeframes.

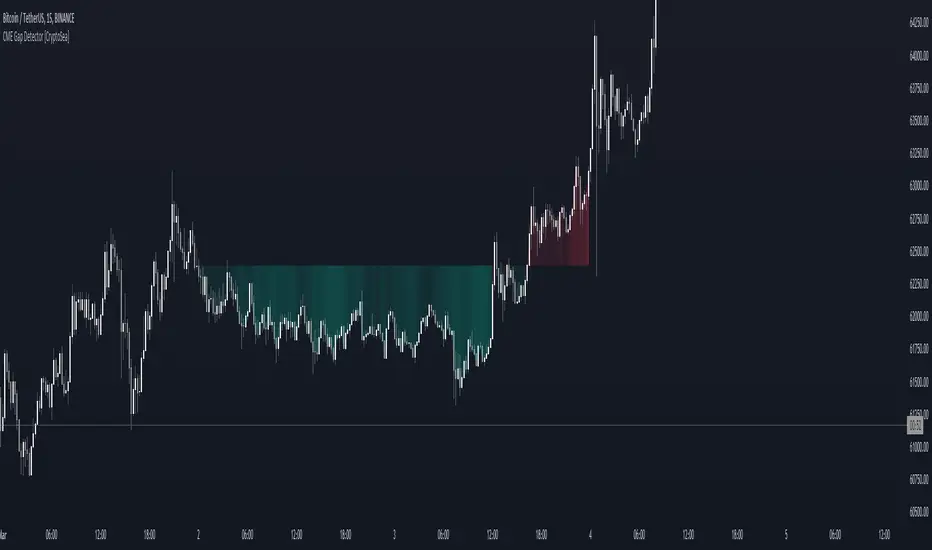
CME Gap Detector [CryptoSea]The CME Gap Indicator , is a tool designed to identify and visualize potential price gaps in the cryptocurrency market, particularly focusing on gaps that occur during the weekend trading sessions. By highlighting these gaps, traders can gain insights into potential market movements and anticipate price behavior.
Key Features
Gap Identification: The indicator identifies gaps in price between the Friday close and the subsequent opening price on Monday. It plots these gaps on the chart, allowing traders to easily visualize and analyze their significance.
Weekend Price Comparison: It compares the closing price on Friday with the opening price on Monday to determine whether a gap exists and its magnitude.
Customizable Visualization: Traders have the option to customize the visualization of the gaps, including the color scheme for better clarity and visibility on the chart.
Neutral Candle Color Option: Users can choose to display neutral candle colors, enhancing the readability of the chart and reducing visual clutter.
How it Works
Data Fetching and Calculation: The indicator fetches the daily close price and calculates whether a gap exists between the Friday close and the subsequent Monday opening price.
Plotting: It plots the current price and the previous Friday's close on the chart, making it easy for traders to compare and analyze.
Gradient Fill: The indicator incorporates a gradient fill feature to visually represent the magnitude of the gap, providing additional insights into market sentiment.
Weekend Line Logic: It includes logic to identify Sunday bars and mark them on the chart, aiding traders in distinguishing weekend trading sessions.
Application
Gap Trading Strategy: Traders can use the identified gaps as potential entry or exit points in their trading strategies, considering the tendency of price to fill gaps over time.
Market Sentiment Analysis: Analyzing the presence and size of weekend gaps can provide valuable insights into market sentiment and participant behavior.
Risk Management: Understanding the existence and significance of gaps can help traders manage their risk exposure and make informed decisions.
The CME Gap indicator offers traders a valuable tool for analyzing weekend price gaps in the cryptocurrency market, empowering them to make informed trading decisions and capitalize on market opportunities.
ILM CFTC COT Disaggregated PlotUse this indicator on Daily Timeframe
Please refer to the below link for CFTC Disaggregated COT
www.cftc.gov
This script is very similar to COT Financial Plot indicator except that it plots the data for Disaggregated Futures

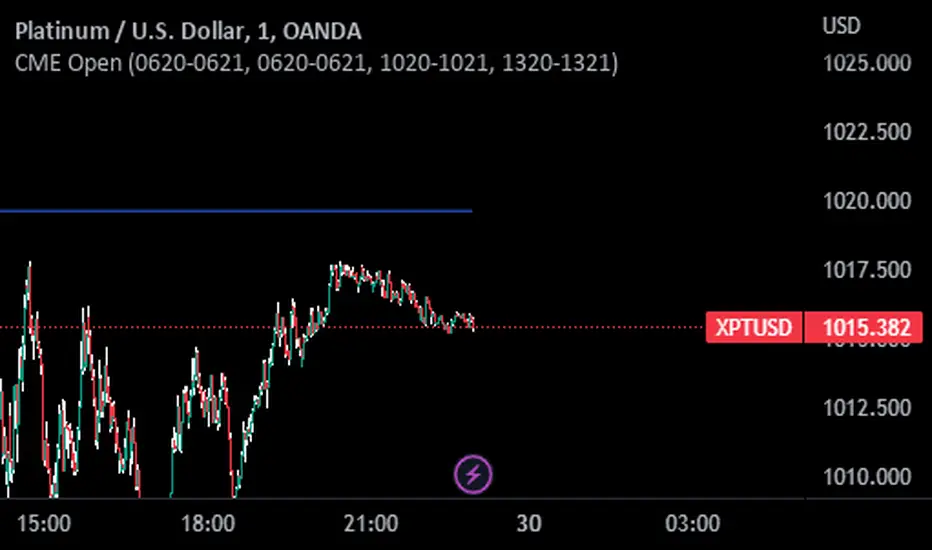
CME OpenThis indicator prints CME open line price on chart.
Please choose the right time to input depending on the broker you are using in Tradingview.
List of brokers:
OANDA 0620-0621
FOREX.COM 0620-0621
SAXO 0620-0621
GLOBALPRIME 0620-0621 (Working only on 1 minute chart)
VANTAGE 0620-0621
EASYMARKETS 0620-0621
PHILLIPNOVA 0620-0621
FXCM (FX) 0620-0621
CURRENCYCOM 0620-0621
CAPITALCOM 0620-0621
FXOPEN 1220-1221
PEPPERSTONE 1020-1021
SKILLING 1020-1021
EIGHTCAP 1320-1321
BLACKBULL 1320-1321
[BUBBLENUKE] BOB The Reversal Trader Indicator=============================================================: BOB The Reversal Trader :=============================================================
COMPONENTS:
- VWAP Anchored at Friday CME close
- Bitcoin CME close
- Volume bars
DESCRIPTION:
BOB is a mean-reversion trading system focused in BTCUSDT asset in the 30M time frame. The system is divided into 2 types of entries:
WEEKENDS:
BOB will trigger his entry when the price of Bitcoin is at one of the two deviations from the VWAP anchored at Friday CME close
INTRA-WEEK:
BOB will trigger its entry when the price of Bitcoin is at one of the two deviations from the VWAP anchored at the Friday CME close or when a volume candle indicates a reversal

COT Report Crypto█ OVERVIEW
Showing the Commitments of Traders (COT) report(*) for Crypto contract Open Interest and Traders - CHICAGO MERCANTILE EXCHANGE (futures only) with COT charts on TradingView data.
* COT reports are released each Friday (except for U.S. holidays) by the CFTC.
* Each COT report release includes data from the previous Tuesday.
* Original data is www.cftc.gov
Data currently displayed are through April 12, 2022
█ FEATURES
You can switch the display for each of the following CFTC Ticker :
BITCOIN www.cmegroup.com
MICRO BITCOIN www.cmegroup.com
ETHER CASH SETTLED www.cmegroup.com
*MICRO ETHER www.cmegroup.com is currently not supported by TradingView at April 2022
You can switch the display for each of the following Positions :
Long
Short
Net
*Net Position limits the Chart Format that can be displayed
You can switch the display for each of the following Target :
Open Interest
Traders
You can switch the display for each of the following Categories :
Dealer
Asset manager
Leverage funds
Other reportable
Non reportable
*Non reportable has no Traders data
You can switch the display for each of the following Chart Format :
Normal Line
Stacked Column
Indexed Column
Difference StepLine
*Net Position can be displayed only for Normal Line
And, convert contract unit to coin unit is available.
BITCOIN/MICRO BITCOIN is converted to BTC and ETHER CASH SETTLED/MICRO ETHER is converted to ETH.
Then, percent by ALL data is available.
This Option use Open Interest(ALL) or Traders Total(ALL) by Target.
Info Display shows coin unit converts info and reason that cannot display a chart.
Of course, this display position and size are changeable.
█ HOW TO USE IT
This indicator allows you to see changes in each category within TradingView without having to refer directly to each report.
In addition, it provides a detailed means of analysis by offering Traders as well as Open Interest and a variety of visualization methods.

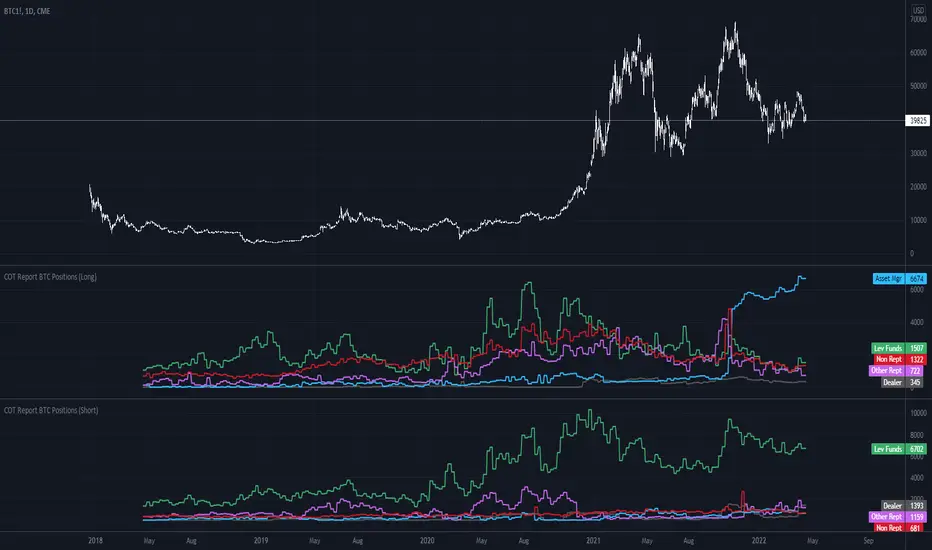
COT Report BTC Positions█ OVERVIEW
Showing the Commitments of Traders (COT) report(*) for BITCOIN Positions - CHICAGO MERCANTILE EXCHANGE (futures only) with COT charts on TradingView data.
* COT reports are released each Friday (except for U.S. holidays) by the CFTC.
* Each COT report release includes data from the previous Tuesday.
* Original data is www.cftc.gov
Data currently displayed are through April 12, 2022
█ FEATURES
You can switch the display for each of the following Positions :
Long
Short
You can switch the display for each of the following Categories :
Dealer
Asset manager
Leverage funds
Other reportable
Non reportable
█ HOW TO USE IT
This indicator allows you to see changes for each category within TradingView without having to refer directly to each report.
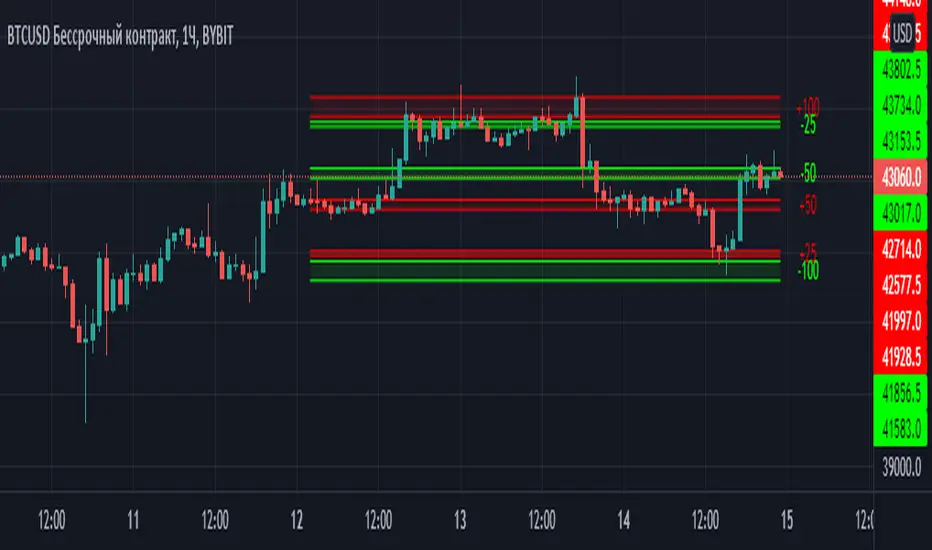
Margin Zones[kryptodude]This indicator is based on the margin requirements of the CME exchange.
Zones act as support and resistance levels, which are more likely to have a price reaction.
The recommended zones for entering a position, as well as taking profits, are zones 50 and 100.
For example, you decide to open a short position on the +100 zone,
in which case it is recommended to place a stop-loss behind the zone.
Take-profit part at -50 and -100, based on the zones from the formed maximum at the +100 zone.
Settings:
Select the currency pair and the exchange on which the indicator will work, For example BINANCE:BTCUSD
"Margin" (for example,now 68280, the next day the margin will be different)
"Tick cost" for BTC = 25 or 12.5
taken from the CME exchange.
"Price max"- High yesterday (for example 44451).
"Price min"- Low yesterday (for example 41280).
Please note, with strong volatility,
it is recommended to change the Tick cost instead of 25 to put 12.5
And also, only dots " . " not commas ", " work in the indicator.
(D7R) CME Bitcoin FuturesCME Bitcoin Quarterly Contract Futures Price with 3 different display modes: (Percentage, Delta, Absolute).
This information can be used to understand when futures are trading at relative strong/weak premium or discount against each other.
This information can either be used for cash-n-carry arbitrage, inter-exchange arbitrage, hedging or directional price speculation.

CME Gap BTCThis script highlights the CME gap. It takes the daily close from Friday from CME Futures Bitcoin security (can be switched) and plots the difference from current close.
With the premise that CME gaps will be filled next week; when the current close is higher than Friday close, it plots a bear color, when the current close is lower, it plots a bull color. Colors can be changed
BTC COT Delta BBitcoin CME COT Delta Strategy
---------------------------------------
Reading 4 largest long positions and 4 largest short positions, this script uses (shorts - longs) to produce a long/short signal.
• When delta <= buy threshold, a "long" signal will appear on the chart.
• When shorts >= sell threshold, a "short" signal will appear on the chart.
To see the indicator below, since it's not possible to mix the two, use this script:
** This is not a trading advice, it's for research purposes only. Do not trade based upon these signals.

MicroStrategy Software Business Share PriceSimilar to the MicroStrategy Premium script. This indicator derives MSTR's core software business value by calculating its Bitcoin holdings as a percentage of market cap. Thus you can do, (1 - Bitcoin holdings as a % of market cap) * current share price = Core business share price
