Maximus imbalance
Maximus imbalance – Indicator Description
Maximus Precision Arrows is an advanced directional signal tool designed for high-accuracy intraday trading.
It detects early BUY and SELL shifts by combining:
• Delta Imbalance Analysis
• Volume-Normalized Pressure (Buy vs Sell Power)
• Trend Confirmation (MA20 / MA50)
• Signal Strength Ratio Filtering
• Smart Gap Control to avoid over-signaling
How it works
The indicator measures real-time buying and selling pressure (Delta), normalizes it by volume, and filters it through trend direction and strength-ratio logic.
Signals only appear when there is:
• A strong directional imbalance
• Confirmed trend alignment
• Valid momentum breakout
• Enough distance from the previous signal (noise reduction)
What the arrows mean
• Green Triangle (BUY):
Strong positive delta shift + bullish imbalance + price aligned with trend.
• Red Triangle (SELL):
Strong negative delta shift + bearish imbalance + price aligned with downtrend.
Best use
• Intraday scalping (1m–15m)
• Options trading (SPX, QQQ, NVDA, AAPL, futures)
• Identifying early reversals & continuation spots
• Filtering noise during consolidation
Important notes
• Signals are filtered to avoid choppy conditions.
• Works on any market, including equities, indices, futures, and CFDs.
• Not a repainting indicator.
Concept

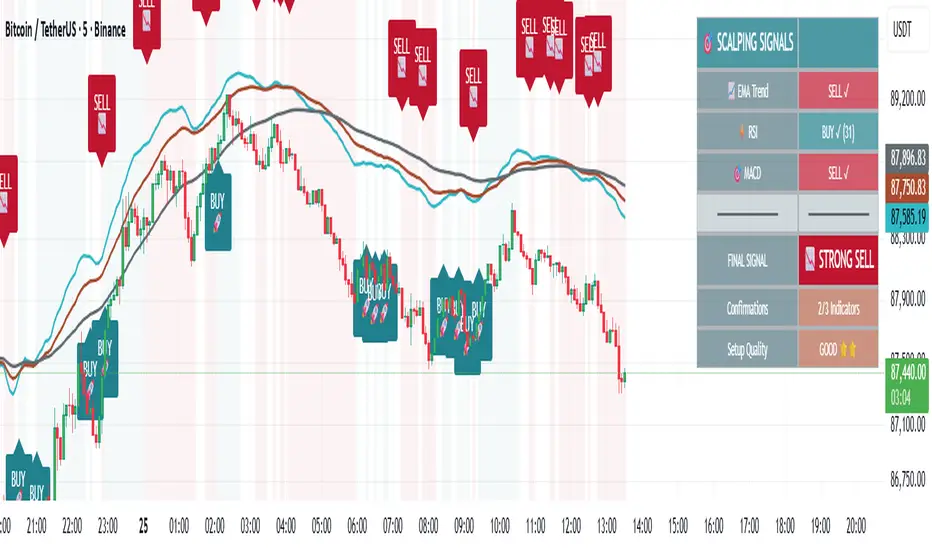
🎯 Advanced Scalping Indicator - Triple ConfirmationThis is the High Probability Scalping Indicator
Risk Reward: 1:2/3/4 or keep trailing SL
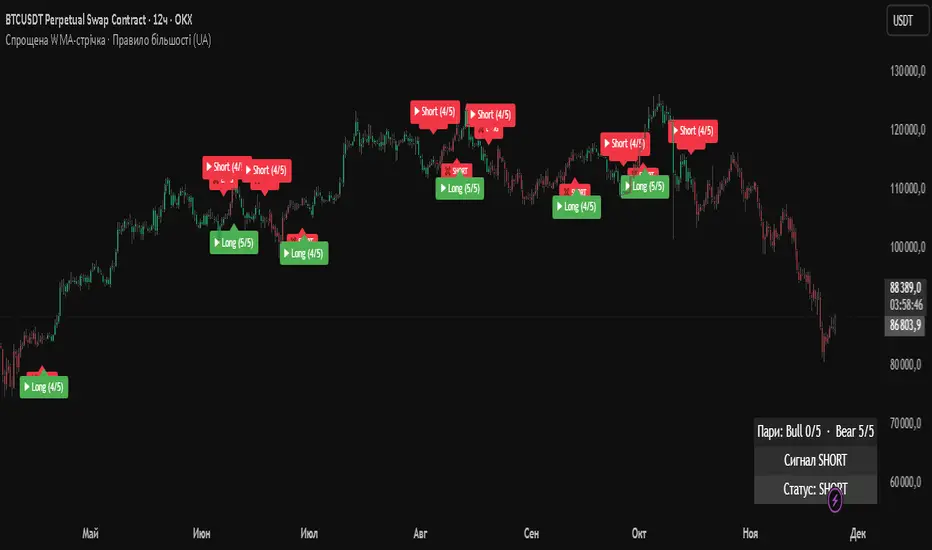
Simplified WMA Ribbon · Majority Rule StrategyThis strategy is a simplified WMA-ribbon “majority rule” system. It compares five fast WMAs (10–30) with five slow WMAs (70–90) and counts how many bullish or bearish pairs are strongly separated by a small ε-buffer. A long (short) position is opened only when a bullish (bearish) majority is reached and closed when that majority weakens or an opposite majority appears. Position size is calculated from a fixed USD amount and leverage, candles are colored by current position, and a mini dashboard shows the number of bullish/bearish pairs and the current status (LONG / SHORT / FLAT).
GraalSTRATEGY DESCRIPTION — “GRAAL”
GRAAL is an advanced algorithmic crypto-trading strategy designed for trend and semi-trend market conditions. It combines ATR-based trend/flat detection, dynamic Stop-Loss and multi-level Take-Profit, break-even (BE) logic, an optional trailing stop, and a “lock-on-trend” mechanism to hold positions until the market structure truly reverses.
The strategy is optimized for Binance, OKX and Bybit (USDT-M and USDC-M futures), but can also be used on spot as an indicator.
Core Logic
Trend Detection — dynamic trend zones built using ATR and local high/low structure.
Entry Logic — positions are opened only after trend confirmation and a momentum-based local trigger.
Exit Logic:
fixed TP levels (TP1/TP2/TP3),
dynamic ATR-based SL,
break-even move after TP1 or TP2,
optional trailing stop.
Lock-on-Trend — positions remain open until an opposite trend signal appears.
Noise Protection — flat filter disables entries during low-volatility conditions.
Key Advantages
Sophisticated and reliable risk-management system.
Minimal false entries due to robust trend filtering.
Optional trailing logic to maximize profit during strong directional moves.
Works well on BTC, ETH and major altcoins.
Easily adaptable for various timeframes (1m–4h).
Supports full automation via OKX / WunderTrading / 3Commas JSON alerts.
Recommended Use Cases
Crypto futures (USDT-M / USDC-M).
Intraday trading (5m–15m–1h).
Swing trading (4h–1D).
Fully automated signal-bot execution.
Important Notes
This is an algorithmic strategy, not financial advice.
Strategy Tester performance may differ from real execution due to liquidity, slippage and fees.
Always backtest and optimize parameters for your specific market and asset.
Recommended Settings: LONG only, no TP, no SL, Flat Policy: Hold, TP3 Mode: Trend, Trailing Stop 1.2%, Fixed size 100 USD, Leverage 10×, ATR=14, HH/LL=36.

Hamaada RangeThis indicator plots the Daily DR/IDR range (19:30–23:00 NY) for each weekday, Monday to Friday.
It automatically draws the Daily Range (DR) and Initial Daily Range (IDR) highs, lows, midlines, and opening price.
Each day’s DR/IDR box extends into the following session for clarity and projection.
All lines and colors are fully customizable per-day.
Tracks 3-bar swings after the DR window closes.
Automatically detects when price violates the DR high or low.
Draws a “Swing Violation Line” from the last valid swing to the end of the extension period.
Friday DR extends to next Monday and supports cross-week swing violation detection.
Background shading, labels, and opening lines are optional.
Designed for precision session modeling in NY timezone (America/New_York recommended).

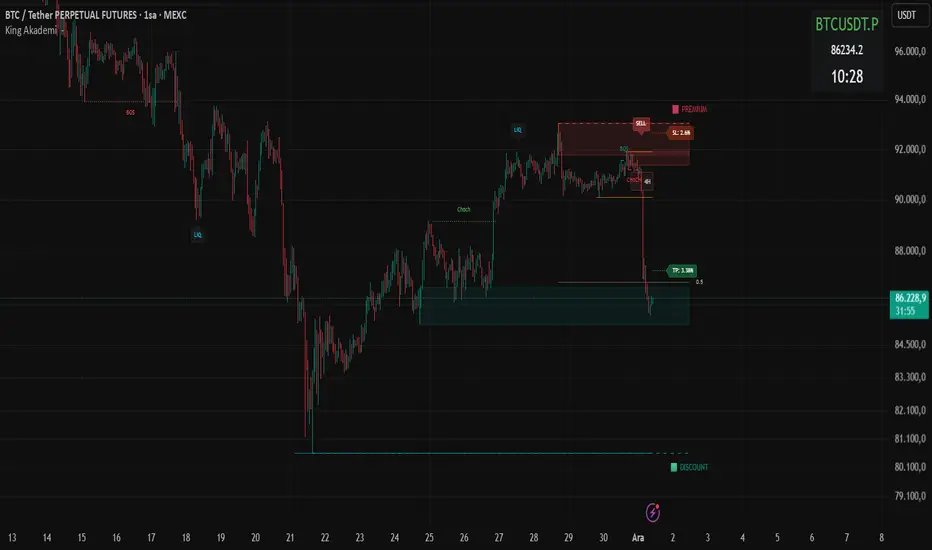
Smart Money OB FVG
Smart Money OB FVG Strategy — Full Description
🔷 Advanced Order Block + Multi-TF FVG + Liquidity Sweep + Auto TP/SL
A Complete Smart Money Concept Trading System
This script combines multiple professional Smart Money tools into a single, optimized and non-repainting engine. Designed for scalpers, intraday traders, swing traders, and algorithmic strategy users.
🔥 Key Features
✔ Intelligent Order Block Engine (IOB)
Automatic bullish & bearish Order Block detection
ATR-based or Range-based volatility filter
Scalp / Normal / Balanced swing structure modes
Auto extending OB zones
Auto-removal of invalid OBs
OB touch alerts
✔ Buy/Sell Signals With Dynamic TP/SL
Non-repainting BUY/SELL structure shift detection
Auto-generated TP & SL levels
SL placement based on OB structure + liquidation buffer
Adjustable Risk-Reward (RR) multiplier
TP/SL labels update in real-time
Fully dynamic lines extending as new candles appear
✔ Liquidity Grab Detection (Wick Liquidity Sweeps)
Upper/lower wick manipulation detection
RSI-supported confirmation
Automatic "LiQ" labels
Strong reversal indication
Liquidity alert system included
✔ Multi-Timeframe FVG Engine (Fair Value Gaps)
Tracks and updates FVG zones from:
15M
1H
4H
1D
Features:
Auto FVG detection
Bullish/Bearish colored zones
Tested FVG repainting → color changes
Auto-cleaning invalid FVGs
Maximum box limits (reduces clutter)
FVG labels inside zones (15M / 1H / 4H / 1D)
One-click master switch for all FVGs
✔ Real-Time Info Panel (Top-Right Table)
Current symbol
Live price
Turkish local time (UTC+3)
Minimalistic, transparent overlay panel
✔ Smart Alerts
OB Buy/Sell signal
Liquidity grab
OB touch
Trend shift
Multi-timeframe FVG alert
Alert-saving mode (prevents alert spam)
💼 Perfect For
Smart Money Concepts traders
Liquidity hunters
OB + FVG traders
Scalpers
Swing & intraday traders
Algorithmic systems
High RR strategy traders
📌 Notes
This is an Invite-Only Script.
Access is given only to approved users.

CrossX GR v3.3 Oh, the sacred CrossX signal! He came down from heaven to show us the way to 35% profit. And if not, then it's not your risk management that will be to blame, but the fact that you didn't wait for the third green candle.
Lord, give me strength. You're risking money based on an indicator that sells for likes. Skin in the game? Your "guru" only risks not getting 500 reposts.
The real support is not a line on the chart. This is the size of your position, at which you won't panic when this pseudo-analysis fails. And he will fail.

Defended Price Levels (DPLs) — Melvin Dickover ConceptThis indicator identifies and draws horizontal “Defended Price Levels” (DPLs) exactly as originally described by Melvin E. Dickover in his trading methodology.
Dickover observed that when extreme relative volume and extreme “freedom of movement” (volume-to-price-movement ratio) occur on the same bar, especially on bars with large gaps or unusually large bodies, the closing price (or previous close) of that bar very often becomes a significant future support/resistance level that the market later “defends.”
This script automates the detection of those exact coincident spikes using two well-known public indicators:
Relative Volume (RVI)
• Original idea: Melvin Dickover
• Pine Script implementation used here: “Relative Volume Indicator (Freedom Of Movement)” by LazyBear
Link:
Freedom of Movement (FoM)
• Original idea and calculation: starbolt64
• Pine Script: “Freedom of Movement” by starbolt64
Link:
How this indicator works
Calculates the raw (possibly negative) LazyBear RVI and starbolt64’s exact FoM values
Normalizes and standardizes both over the user-defined lookback
Triggers only when both RVI and FoM exceed the chosen number of standard deviations on the same bar (true Dickover coincident-spike condition)
Applies Dickover’s original price-selection rules (uses current close on big gaps or 2× body expansion candles, otherwise previous close)
Draws a thin maroon horizontal ray only when the new level is sufficiently far from all previously drawn levels (default ≥0.8 %) and the maximum number of levels has not been reached
Keeps the chart clean by limiting the total number of significant defended levels shown
This is not a republish or minor variation of the two source scripts — it is a faithful automation of Melvin Dickover’s specific “defended price line” concept that he manually marked using the coincidence of these two indicators.
Full credit goes to:
Melvin E. Dickover — creator of the Defended Price Levels concept
LazyBear — author of the Relative Volume (RVI) implementation used here
starbolt64 — author of the Freedom of Movement indicator and calculation
Settings (all adjustable):
Standard Deviation Length (default 60)
Spike Threshold in standard deviations (default 2.0)
Minimum distance between levels in % (default 0.8 %)
Maximum significant levels to display (15–80)
Use these horizontal maroon lines as potential future support/resistance zones that the market has previously shown strong willingness to defend.
Thank you to Melvin, LazyBear, and starbolt64 for the original work that made this automation possible.

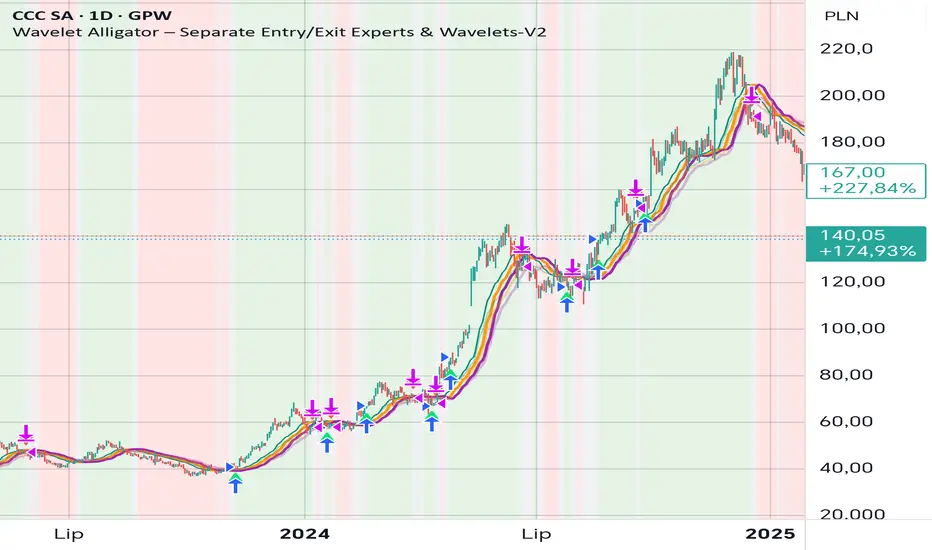
Wavelet Alligator – Separate Entry/Exit Experts & Wavelets-V2
Wavelet Alligator – Strategy Explanation & How to Use
1. Concept Overview
The Wavelet Alligator strategy combines:
- Wavelet transforms (Daubechies, Haar, Symlet, Mexican Hat, Morlet)
- Fractional calculus kernels: Caputo-Fabrizio (CF) and Atangana-Baleanu (AB)
- Three-layer “alligator-like” wavelet smoothing (soft → medium → strong)
- Expert-based entry/exit routing (RAW, CF, AB, or Majority vote)
- Independent wavelets for ENTRY and EXIT
- Main trend defined by AB wavelet ordering
This creates a multi-structure, multi-kernel trend engine capable of capturing extended moves with high signal quality.
2. Wavelet Alligator Structure
Each source (RAW, CF, AB) is transformed into three wavelet layers:
Soft = fastest reaction
Medium = mid smoothing
Strong = trend backbone
Wavelets:
- Daubechies: stable trend
- Haar: fast impulse detection
- Symlet: balanced
- Mexican Hat: curvature and reversal detection
- Morlet: cyclic, oscillatory
3. Entry Logic
Long entry occurs when:
- AB wavelet shows bullish structure (soft > medium > strong, medium rising)
- Selected entry expert approves (RAW / CF / AB / Majority)
- Wavelet condition: soft > strong AND medium crosses above strong
4. Exit Logic
Exit is independent from entry:
- Controlled by chosen exit expert
- Wavelet reversal condition: soft < strong AND medium crosses below strong
- Forced exit when AB trend turns neutral or bearish
5. Background Color (Regime)
- Green: bullish AB regime
- Red: bearish AB regime
- Gray: neutral/transition
6. How to Use
Step 1 – Choose entry wavelet
Daubechies: stable trend
Haar: breakout scalping
Mexican Hat: early reversals
Symlet: balanced
Morlet: cyclic markets
Step 2 – Choose exit wavelet
Mexican Hat: best precision
Daubechies: smooth exits
Haar: aggressive exits
Step 3 – Select entry/exit experts
CF only – fast fractional trend
AB only – stable long-memory trend
RAW only – pure price structure
Majority – safest, noise-filtered
Step 4 – Run the strategy
Entries occur only during AB bullish trend.
Exits occur on wavelet reversal or AB trend failure.
7. Why This Strategy Works
It fuses:
- Fractional calculus (memory)
- Wavelets (shape/curvature)
- Alligator ordering (trend hierarchy)
Result: high-quality entries, strong trend holding, noise-resistant signals.
Fractals by Aza fractals that show exactly those fractals that are intended for the 3-touch strategy and structure breakdown

FVG by AzaA special indicator that is correctly configured for the 3-touch strategy and structure breakdown


Unbounded RSI (Logit)Unbounded RSI-based oscillator using a logit transform for clearer momentum and divergence signals near extremes.

Multi-Timeframe Stochastic (4x) z Podświetlaniem - PawelA script that provides information when most of the stocks are in the overbought or oversold zone.

Multi-Timeframe RSI (4x) z Podświetlaniem - PawełRSI z podświetleniem z różnych tfów z ustawianiem intensywnosci i kolorów.

EMA Trend Alignment (10/20/50) with MTF & SignalsBullish Crossovers 10>20>50 and Bearish Crossover 10<20<50

Volume-Confirmed FTR Zones [AlgoPoint]FTR Zone Indicator — Fail To Return Zones (With Volume Confirmation)
Advanced Smart Money Zone Detection for Institutional Orderflow
The FTR Zone Indicator is a professional-grade tool designed for traders who follow Smart Money Concepts (SMC), ICT methodologies, or institutional orderflow. It automatically detects Fail To Return Zones (FTR) — high-probability supply and demand areas formed after strong displacement moves.
By combining impulse detection, base identification, and volume confirmation, this indicator highlights zones where price is most likely to react, reverse, or mitigate shortly after structure breaks.
⸻
⭐ What Are FTR Zones?
FTR zones (Fail To Return zones) are price areas where:
1. A strong displacement / impulse candle is formed
2. That impulse originates from a small consolidation (base)
3. Price moves away aggressively
4. AND fails to return immediately to the origin area
These zones often indicate:
• Institutional orders
• Imbalance
• Hidden liquidity
• Origin of a trend leg
• High-probability mitigation points
This indicator fully automates the detection and visualization of such areas.
🔍 How the Indicator Works
1. Impulse Detection
The indicator identifies a valid impulse candle using:
• ATR-based bar range filter
• Trend-aligned candle body direction
• Optional volume confirmation
Only large, meaningful institutional candles qualify — filtering out noise.
2. Base Zone Identification
Before every impulse, the tool finds the micro-consolidation base using:
• Highest high of the last X bars
• Lowest low of the last X bars
This base becomes the potential FTR zone.
3. FTR Zone Creation
When a valid impulse is detected:
• Bullish impulse → Demand FTR zone
• Bearish impulse → Supply FTR zone
The zone is immediately drawn on the chart using box.new().
4. Zone Extension
Every zone continuously extends to the right as price evolves, allowing you to track:
• Mitigation
• Retests
• Reaction points
• Liquidity sweeps
5. Invalidation Logic
Zones automatically delete when violated:
• Demand zone invalid if close < zone low
• Supply zone invalid if close > zone high
This keeps the chart clean and helps focus only on active, high-value areas.
🎛️ Key Features
✔ Automatic FTR Zone Detection
Instantly identifies institutional origin zones based on real impulse and displacement.
✔ Volume-Based Filtering
Ensures only high-volume impulses (true institutional orders) create zones.
✔ Supply & Demand Coloring
• Bullish FTR → Demand Zone (Teal tone)
• Bearish FTR → Supply Zone (Red tone)
✔ Safe Zone Storage
Fault-tolerant logic ensures no array errors, invalid zones, or broken visuals.
✔ Auto-Extending Boxes
Real-time zone updates with precise historical mapping.
✔ Smart Invalidation
Zone is removed only when fully broken, preventing false signals.
✔ Clean, Non-Repainting Logic
Impulse detection and zone placement are confirmed only on bar close.
📈 How to Use It (Example Schenarios)
For Reversals or Continuations
• Look for price reacting or mitigating inside a zone
• Use as entry confirmation in trend continuations
• Combine with FVG, BOS/CHOCH, liquidity sweeps, or premium/discount zones
For Scalping or Intraday Trading
• High-probability countertrend entries
• Reaction-based setups at institutional footprints
For Swing Traders
• Identify weekly/daily origin zones
• Plan entries around large displacement points

CAGR BAR B2BThis will help understanding CAGR is completely now form.
Contact in twitter/x @xpertnifty

Break & Retest + Liquidity Sweep EntryIdentify a BOS (vertical line appears).
Wait for price to retest the broken level (circle shows up).
Optionally confirm with liquidity sweep.
Enter long/short trades based on bullish/bearish retest signals.
Use ATR or personal risk management for stop-loss placement.

Fractional Candlestick Long Only Experimental V10Fractional Candlestick Long-Only Strategy – Technical Description
This document provides a professional English description of the "Fractional Candlestick Long Only Experimental V6" strategy using pure CF/AB fractional kernels and wavelet-based filtering.
1. Fractional Candlesticks (CF / AB)
The strategy computes two fractional representations of price using Caputo–Fabrizio (CF) and Atangana–Baleanu (AB) kernels. These provide long-memory filtering without EMA approximations. Both CF and AB versions are applied to O/H/L/C, producing fractional candlesticks and fractional Heikin-Ashi variants.
2. Trend Stack Logic
Trend confirmation is based on a 4-component stack:
- CF close > AB close
- HA_CF close > HA_AB close
- HA_CF bullish
- HA_AB bullish
The user selects how many components must align (4, 3, or any 2).
3. Wavelet Filtering
A wavelet transform (Haar, Daubechies-4, Mexican Hat) is applied to a chosen source (e.g., HA_CF close). The wavelet response is used as:
- entry filter (4 modes)
- exit filter (4 modes)
Wavelet modes: off, confirm, wavelet-only, block adverse signals.
4. Trailing System
Trailing stop uses fractional AB low × buffer, providing long-memory dynamic trailing behavior. A fractional trend channel (CF/AB lows vs HA highs) is also plotted.
5. Exit Framework
Exit options include: stack flip, CF

ATC v6 with ORB by SabnATC v6 with ORB: Advanced Automatic Session and Opening
Range Indicator
ATC v6 is an advanced indicator designed by Alfa Trade Club for
TradingView users. This tool not only automatically marks important session
opens, closes, or specific times of financial markets on your chart but also
visualizes powerful Opening Range (ORB) strategies directly on your chart.
This tool removes the need to manually monitor critical trading hours, allowing
you to easily analyze price action in relation to these important timeframes.
Key Features
This indicator comes with a set of powerful features to provide the flexibility,
visual clarity, and strategic advantage that traders need:
1. Multi-Time Zone Support The indicator is based on the world's most
important financial market centers:
New York (America/New_York)
London (Europe/London)
Tokyo (Asia/Tokyo)
Istanbul (Europe/Istanbul)
This allows you to always set the lines accurately according to the local time of
the market you are trading.
2. Advanced 3-Stage Timing (Pre / Main / Next) Each time line is more than
just a simple line; it can manage a three-stage event cycle:
"Pre-Session": Draws a dotted line a few minutes before the main time you
specify (e.g., market open). This allows you to see the price level just before a
significant event.
"Main Session": Marks the opening price at the exact event time (e.g., 08:00
London Open) with a solid line.
"Next / ORB" (Opening Range): Draws another dotted line a specified number
of minutes after the main event (e.g., 15 minutes later). This is used to define the
Opening Range.
3. Automatic Price Boxes (Volatility & ORB) The indicator can draw two
different types of boxes based on this timing:
Opening Volatility Box (Pre -> Main): If the "Pre-Session" feature is active, the
indicator draws a colored box between the price at the pre-session moment and
the price at the main event. This box visualizes the initial volatility at the session
open.
Opening Range Box (Main -> Next): If the "Next" feature is active, the indicator
draws a box between the price at the main event and the "next" event.
4. Customizable Time Lines You have full control over each line. Users can:
Enable/Disable each line.
Set any desired hour and minute.
Define the "Pre" and "Next" durations in minutes.
Assign a different color for visual distinction.
5. Smart and Efficient Drawing
Forward-Extending Lines: All drawn lines and boxes automatically extend from
the moment they are created until the next day. This makes it easy to track how
these levels act as support/resistance throughout the day.
High Performance: Instead of deleting old lines and drawing new ones when a
new day starts, the code intelligently extends the existing lines into the next day
Weekend and DST Protection: Automatically skips weekends (from Friday to
Monday) and is not affected by Daylight Saving Time (DST) changes.
Who Is It For?
Session-Focused Traders: Ideal for those who track volatility during the London,
New York, Asian, or Istanbul session opens.
Day Traders: Perfect for those who want to mark important economic data
release times or daily market open/close levels.
Technical Analysts: A powerful aid for those who want to visually analyze how
opening prices at specific times and time ranges play a role throughout the day.
ATC v6 with ORB is much more than just a simple session line; it is a dynamic
analysis and strategy tool that combines price and time.
