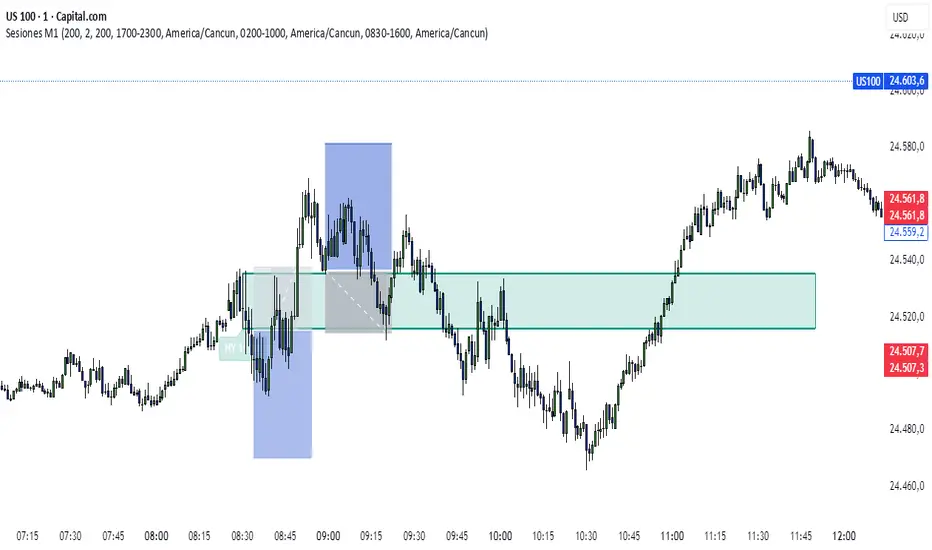
Opening Range Gaps [TakingProphets]What is an Opening Range Gap (ORG)?
In ICT, the Opening Range Gap is defined as the price difference between the previous session’s close (e.g., 4:00 PM EST in U.S. indices) and the current day’s open (9:30 AM EST).
That gap is a liquidity void—an area where no trading occurred during regular hours.
Why ICT Traders Care About ORG
Liquidity Void (Gap Fill Logic)
-Because the gap is an untraded area, it naturally acts as a draw on liquidity.
-Price often seeks to rebalance by retracing into or fully filling this void.
Premium/Discount Sensitivity
-Once the ORG is defined, ICT treats it as a mini dealing range.
-Above EQ (Consequent Encroachment) = algorithmic premium (sell-sensitive).
-Below EQ = algorithmic discount (buy-sensitive).
-Price reaction at these levels gives a precise read on institutional intent intraday.
Support/Resistance from ORG
-If the session opens above prior close, the gap often acts as support until violated.
-If the session opens below prior close, the gap often acts as resistance until reclaimed.
Key ICT Concepts Anchored to ORG
Consequent Encroachment (CE): The midpoint of the gap. The algo is highly sensitive to CE as a decision point: reject → continuation; reclaim → reversal.
Draw on Liquidity (DoL): Price is algorithmically “pulled” toward gap fills, CE, or the opposite side of the ORG.
Order Flow Confirmation: If price ignores the gap and runs away from it, this signals strong institutional order flow in that direction.
Confluence with Other Tools: FVGs, OBs, and HTF PD arrays often overlap with ORG levels, strengthening setups.
Practical Application for Traders
Bias Formation:
Use ORG EQ as a line in the sand for intraday bias.
If price trades below ORG EQ after the open → look for short setups into the prior day’s low or external liquidity.
If price trades above ORG EQ → favor longs into highs/liquidity pools.
Execution Framework:
Wait for liquidity raids or market structure shifts at ORG edges (.00, .25, .50, .75).
Target: EQ, opposite quarter, or full gap fill.
Precision Reads:
ORG lines let traders anticipate where algorithms are likely to respond, providing mechanical invalidation and clear targets without clutter.
Concept

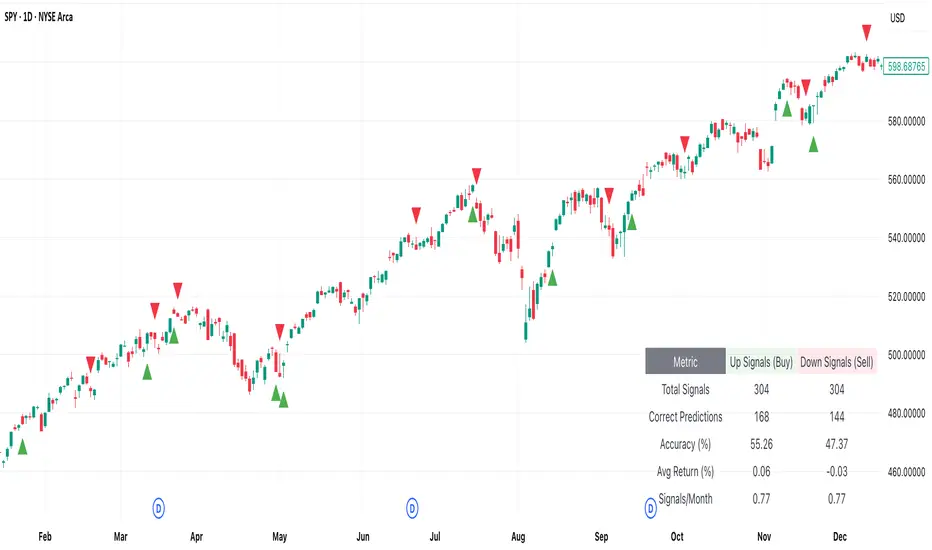
Trendline Breakouts With Targets [ omerprıme ]Indicator Explanation (English)
This indicator is designed to detect trendline breakouts and provide early trading signals when the price breaks key support or resistance levels.
Trendline Detection
The indicator identifies recent swing highs and lows to construct dynamic trendlines.
These trendlines act as support in an uptrend and resistance in a downtrend.
Breakout Confirmation
When the price closes above a resistance trendline, the indicator generates a bullish breakout signal.
When the price closes below a support trendline, it generates a bearish breakout signal.
Filtering False Signals
To reduce false breakouts, additional conditions (such as candle confirmation, volume filters, or price momentum) can be applied.
Only significant and confirmed breakouts are highlighted.
Trading Logic
Buy signals are triggered when the price breaks upward through resistance with confirmation.
Sell signals are triggered when the price breaks downward through support with confirmation.

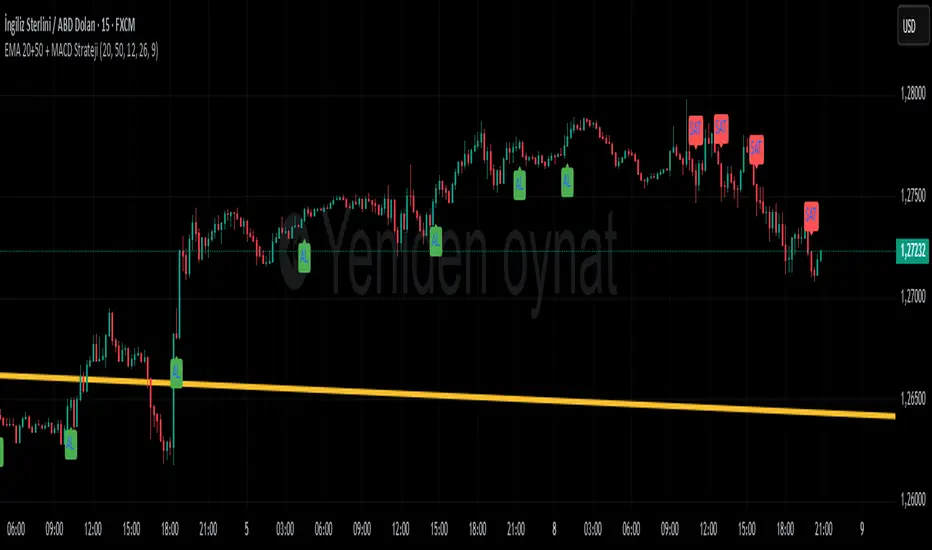
EMA 20+50 + MACD Strateji ( omerprıme)EASY BUY-SELL basitçe al -sat yapabileceğiniz macd indikatörü ve ema kullanılmış bir indikatördür unutmayın ki ne kadar basit o kadar verimli.
Moving Averages) to generate trading signals and trend confirmation.
Trend Identification with EMA
Two EMAs are used to determine the overall market trend (commonly a short-term EMA and a long-term EMA).
When the short EMA crosses above the long EMA, it indicates an uptrend.
When the short EMA crosses below the long EMA, it signals a downtrend.
Signal Confirmation with MACD
The MACD line and Signal line are analyzed to detect momentum shifts.
A bullish signal occurs when the MACD line crosses above the Signal line, especially if the EMAs confirm an uptrend.
A bearish signal occurs when the MACD line crosses below the Signal line, especially if the EMAs confirm a downtrend.
Trading Logic
Buy signals appear only when both the EMA trend is bullish and the MACD confirms momentum to the upside.
Sell signals appear only when both the EMA trend is bearish and the MACD confirms momentum to the downside.
Smart Money Concepts [varshitAlgo]🚀 Smart Money Concept (SMC) – Varshit Algo Indicator
The Varshit Algo Indicator is built for traders who want to trade like institutions and understand the true market structure behind the charts. It combines multiple Smart Money Concepts into one powerful tool to help identify high-probability trade setups.
🔹 Key Features:
Automatically detects Order Blocks, Break of Structure (BOS), and Market Structure Shifts (MSS)
Highlights Fair Value Gaps (FVG) for precise entry points
Identifies liquidity zones and reversal areas where market makers trap retail traders
Multi-timeframe confirmation for stronger signals
Clean, user-friendly, and professional visual design
🔹 Best For:
Scalping, intraday, and swing trading
Traders who want to apply institutional trading concepts
Beginners to learn SMC + Advanced traders to execute strategies with confidence
⚠️ Disclaimer: This indicator is for educational and analytical purposes only. It is not financial advice. Always trade with proper risk management.

Correlation Table 5хThe script allows you to determine the correlation in real time, which makes it possible to effectively select trading pairs.

DOT BOMB: Outlier Mark + Candle ColoringThis indicator helps us to get in where the probability of good trade is the highest which in my terms its called as the casino way of trading.
Works with every asset class/ every chart.
Useful for any trader to progress/recover their account which is mathematically made and proven.
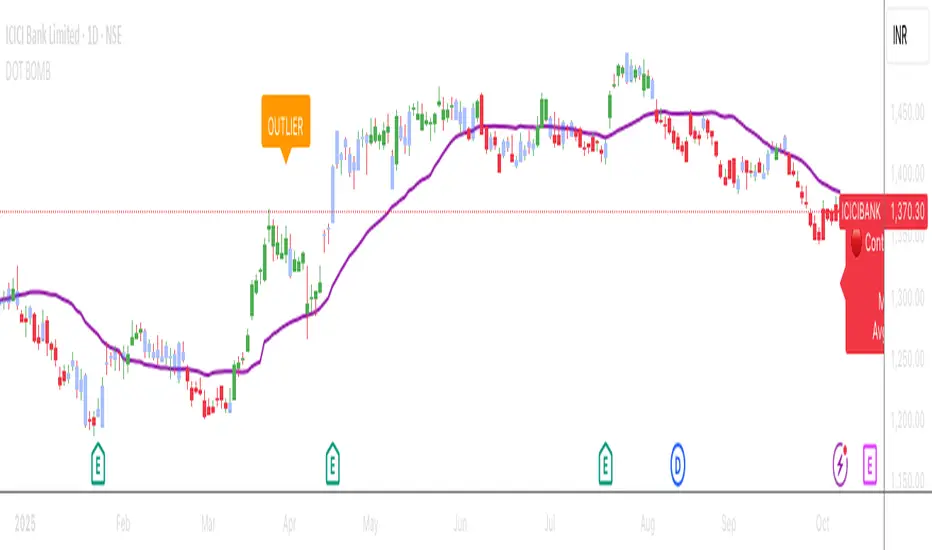
DOT BOMB: Outlier Mark + Candle Coloringthis indicator helps us to get in where the probability of good trade trade is the highest which in my terms its called as the casino way of trading
works with asset class useful for any trader to progress/recover their account which is mathematically made and proven

SANGAM ENTRYThis setup is highly effective in helping traders catch entries before a major move begins. When all the LINES converge and merge together, it signals an opportunity to take buy or sell entries with low risk and high reward. It serves as one of the best confirmations for both trend continuation and breakout trades. Many traders can benefit from this approach, as it is absolutely simple, practical, and easy to manage when planning their entries.

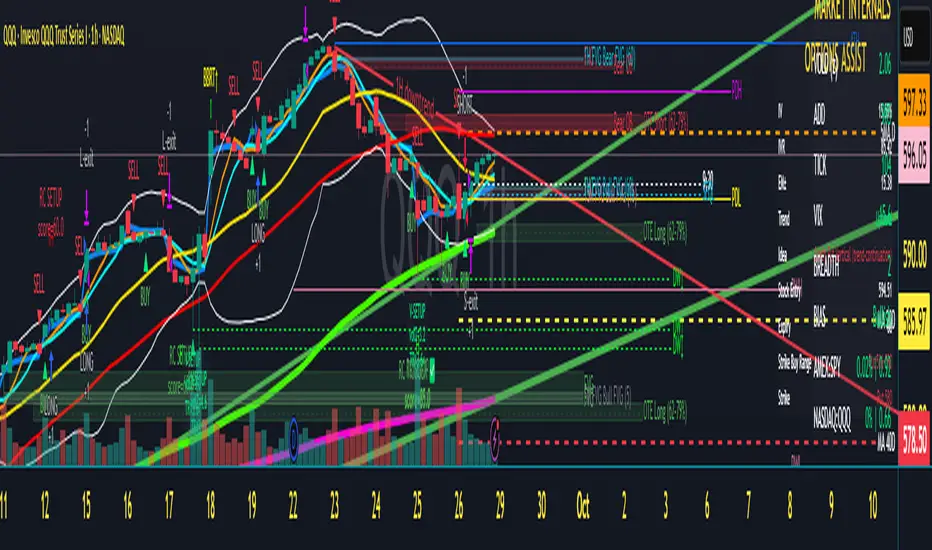
Scalper's Dream by Chino,CHINO’S ICT MES/MNQ Strategy — FVG/BOS/OTE/PD + VWAP + SMA + BB Squeeze/Failure
Summary
Intraday ICT-inspired toolkit tuned for MES/MNQ (also effective on equities/ETFs and crypto). It blends Fair Value Gaps (FVG) — including multi-timeframe FVG (MTF FVG) with first-touch and min-gap filters — Break of Structure (BOS), Optimal Trade Entry (OTE), and Prior-Day levels with VWAP, SMA gates, 9:30 Open, Session Equilibrium (EQ), custom ORB, and Key Rejection Levels (KRL). It also includes Accumulation/Distribution phase reads and Manipulation cues (e.g., liquidity sweeps/stop-runs) to contextualize trend transitions. On top, it adds Bollinger Band squeeze breakouts & failure reversals, V/A shape reversal detectors, Volume-boosted buy/sell signals with Reversal Candle Assist, Asia/London/New York sessions, an Options Assist HUD, and a Market Internals HUD.
Disclaimer: This tool is for education and research purposes only and is not financial advice. Test thoroughly in replay/paper before live trading.
CMC Macro Regime PanelOverview (what it is):
A macro‑regime gate built entirely from TradingView-native symbols (CRYPTOCAP, FRED, DXY/VIX, HYG/LQD). It aggregates central‑bank liquidity (Fed balance sheet − RRP − Treasury General Account), USD strength, credit conditions, stablecoin flows/dominance, tech beta and BTC–NDX co‑move into one normalized score (CLRC). The panel outputs Risk‑ON/OFF regimes, an Early 3/5 pre‑signal, and an automatic BTC vs ETH vs ALTs preference. It is intentionally scoped to Daily & Weekly reads (no intraday timing). Publish with a clean chart and a clear description as per TradingView rules.
TradingView
Why we also use other TradingView screens (and why that is compliant)
This script pulls data via request.security() from official TV symbols only; users often want to open the raw series on separate charts to sanity‑check:
CRYPTOCAP indices: TOTAL, TOTAL2, TOTAL3 (market cap aggregates) and dominance tickers like BTC.D, USDT.D. Helpful for regime & rotation (ALTs vs BTC). TradingView provides definitions for crypto market cap and dominance symbols.
TradingView
+3
TradingView
+3
TradingView
+3
FRED releases: WALCL (Fed assets, weekly), RRPONTSYD (ON RRP, daily), WTREGEN (TGA, weekly), M2SL (M2, monthly). These are the official macro sources exposed on TV.
FRED
+3
FRED
+3
FRED
+3
Risk proxies: TVC:DXY (USD index), TVC:VIX (implied vol), AMEX:HYG/AMEX:LQD (credit), NASDAQ:NDX (tech beta), BINANCE:ETHBTC. VIX/NDX relationship is well-documented; VIX measures 30‑day expected S&P500 vol.
TradingView
+2
TradingView
+2
Compliance note: Using multiple screens is optional for users, but it explains/justifies how components work together (a requirement for public scripts). Keep publication chart clean; use extra screens only to illustrate in the description.
TradingView
How it works (high level)
Liquidity block (Weekly/Monthly)
Net Liquidity = WALCL − RRPONTSYD − WTREGEN (YoY z‑score). WALCL is weekly (as of Wednesday) via H.4.1; RRP is daily; TGA is a Fed liability series. M2 YoY is monthly.
FRED
+3
FRED
+3
FRED
+3
Risk conditions (Daily)
DXY 3‑month momentum (inverted), VIX level (inverted), Credit (HYG/LQD ratio or HY OAS). VIX is a 30‑day constant‑maturity implied vol index per Cboe methodology.
Cboe
+1
Crypto‑internal (Daily)
Stablecoins (USDT+USDC+DAI 30‑day log change), USDT dominance (20‑day, inverted), TOTAL3 (63‑day momentum). Dominance symbols on TV follow a documented formula.
TradingView
Beta & co‑move (Daily)
NDX 63‑day momentum, BTC↔NDX 90‑day correlation.
All components become z‑scores (optionally clipped), weighted, missing inputs drop and weights renormalize. We never use lookahead; we confirm on bar close to avoid repainting per Pine docs (barstate.isconfirmed, multi‑TF).
TradingView
+2
TradingView
+2
What you see on the chart
White line (CLRC) = macro regime score.
Background: Green = Risk‑ON, Red = Risk‑OFF, Teal = Early 3/5 (pre‑signal).
Table: shows each component’s z‑score and the Preference: BTC / ETH / ALTs / Mixed.
Signals & interpretation
Designed for Daily (1D) and Weekly (1W) only.
Regime gates (default Fast preset):
Enter ON: CLRC ≥ +0.8; Hold ON while ≥ +0.5.
Enter OFF: CLRC ≤ −1.0; Hold OFF while ≤ −0.5.
0 / ±1 reading: CLRC is a standardized composite.
~0 = neutral baseline (no macro edge).
≥ +1 = strong macro tailwind (≈ +1σ).
≤ −1 = strong headwind (≈ −1σ).
Early 3/5 (teal): a fast pre‑signal when at least 3 of 5 daily checks align: USDT.D↓, DXY↓, VIX↓, HYG/LQD↑, ETHBTC↑ or TOTAL3↑. It often precedes a full ON flip—use for pre‑positioning rather than full sizing.
BTC/ETH/ALTs selector (only when ON):
ALTs when BTC.D↓ and (ETHBTC↑ or TOTAL3↑) ⇒ rotate down the risk curve.
BTC when BTC.D↑ and ETHBTC↓ ⇒ keep it concentrated.
ETH when ETHBTC↑ while BTC.D flat/up ⇒ add ETH beta.
(Dominance mechanics are documented by TV.)
TradingView
Dissonance (incompatibility) rules — when to stand down
Use these overrides to avoid false comfort:
CLRC > +1 but USDT.D↑ and/or VIX spikes day‑over‑day → downgrade to Neutral; wait for USDT.D to stabilize and VIX to cool (VIX is a fear gauge of 30‑day expectation).
Cboe Global Markets
CLRC > +1 but DXY↑ sharply (USD squeeze) → size below normal; require DXY momentum to roll over.
CLRC < −1 but Early 3/5 = true two days in a row → start reducing underweights; look for ON flip within a few bars.
NetLiq improving (W) but credit (HYG/LQD) deteriorating (D) → treat as mixed regime; prefer BTC over ALTs.
How to use (step‑by‑step)
A. Read on Daily (1D) — main regime
Open CRYPTOCAP:TOTAL3, 1D (panel applied).
Wait for bar close (use alerts on confirmed bar). Pine docs recommend barstate.isconfirmed to avoid repainting on realtime bars.
TradingView
If ON, check Preference (BTC / ETH / ALTs).
Then drop to 4H on your trading pair for micro entries (this indicator itself is not for intraday timing).
B. Confirm weekly macro (1W) — once per week)
Review WALCL/RRP/TGA after the H.4.1 release on Thursdays ~4:30 pm ET. WALCL is “Weekly, as of Wednesday”; M2 is Monthly—so do not expect daily responsiveness from these.
Federal Reserve
+2
FRED
+2
Recommended check times (practical schedule)
Daily regime read: right after your chart’s daily close (confirmed bar). For consistent timing across crypto, many users set chart timezone to UTC and read ~00:05 UTC; you can change chart timezone in TV’s settings.
TradingView
In‑day monitoring: optional spot checks 16:00 & 20:00 UTC (DXY/VIX move during US hours), but act only after the daily bar confirms.
Weekly macro pass: Thu 21:30–22:30 UTC (after H.4.1 4:30 pm ET) or Fri after daily close, to let weekly FRED series propagate.
Federal Reserve
Limitations & data latency (be explicit)
Higher‑TF data & confirmation: FRED weekly/monthly series will not reflect intraday risk in crypto; we aggregate them for regime, not for entry timing.
Repainting 101: Realtime bars move until close. This script does not use lookahead and follows Pine guidance on multi‑TF series; still, always act on confirmed bars.
TradingView
+1
Public‑library compliance: Title EN‑only; description starts in EN; clean chart; justify component mash‑up; no lookahead; no unrealistic claims.
TradingView
Alerts you can use
“Macro Risk‑ON (entry)” — fires on ON flip (confirmed bar).
“Macro Risk‑OFF (entry)” — fires on OFF flip.
“Early 3/5” — fires when the teal pre‑signal appears (not a regime flip).
“Preference change” — BTC/ETH/ALTs toggles while ON.
Publish note: Alerts are fine; just avoid implying guaranteed accuracy/performance.
TradingView
Background research (why these inputs matter)
Liquidity → Crypto: Fed H.4.1 timing and series definitions (WALCL, RRP, TGA) formalize the “net liquidity” concept used here.
FRED
+3
Federal Reserve
+3
FRED
+3
Stablecoins ↔ Non‑stable crypto: empirical work shows bi‑directional causality between stablecoin market cap and non‑stable crypto cap; stablecoin growth co‑moves with broader crypto activity.
Global liquidity link: world liquidity positively relates to total crypto market cap; lagged effects are observed at monthly horizons.
VIX/Uncertainty effect: fear shocks impair BTC’s “safe haven” behavior; VIX is a meaningful risk‑off read.

Pro Momentum Table + Trade Alerts📊 Indicator Name: Pro Momentum Table – ADX + DI + ATR + Astro Timing
🧠 Concept:
This indicator is designed for professional scalpers and intraday traders who want to capture only strong momentum waves — not noise. It combines trend strength, volatility, directional movement, momentum oscillation, vega divergence, and astrological timing into a single compact table on your chart.
⚙️ Components Explained:
Metric Description
ADX (Average Directional Index) Measures the strength of the trend. Values above 20 indicate that a meaningful move is starting.
+DI / -DI (Directional Indicators) Show whether buyers (+DI) or sellers (-DI) are dominating. Increasing +DI with ADX rising = bullish momentum. Increasing -DI with ADX rising = bearish momentum.
ATR (Average True Range) Shows volatility and expected range. Used for setting realistic stop-loss and multi-level targets (1×, 1.5×, 2×, 2.5× ATR).
Price Displays the current price level for quick reference.
CMO (Chande Momentum Oscillator) Measures short-term momentum direction and strength. Helps identify overbought/oversold conditions in trend continuation.
Vega Divergence Shows a synthetic reading of volatility pressure — "Bullish" when volatility expansion supports upward moves, "Bearish" for downward pressure, and "Neutral" otherwise.
Astro Remark Suggests ideal time windows based on planetary cycles for scalping entries. “Bullish Window” often aligns with high-probability long trades; “Bearish Window” favors shorts.
Trade Signal The core momentum condition: “Bullish Momentum” if ADX > 20 and +DI rising, “Bearish Momentum” if ADX > 20 and -DI rising, else “No Clear Momentum.”
📈 How to Use:
Wait for ADX > 20 – This confirms that the market is entering a strong momentum phase.
Check DI direction:
✅ +DI rising: Buyers gaining strength → look for long setups.
✅ -DI rising: Sellers gaining strength → look for short setups.
Use ATR to plan exits:
🎯 TP1 = Entry ± 1 × ATR
🎯 TP2 = Entry ± 1.5 × ATR
🎯 TP3 = Entry ± 2 × ATR
🎯 TP4 = Entry ± 2.5 × ATR
CMO & Vega Divergence: Confirm momentum direction and volatility expansion before committing.
Astro Remark: Align your scalping activity with the planetary support window for higher probability trades.
🪙 Pro Tips for Scalpers:
Only trade when ADX > 20 and DI is consistently rising. Ignore signals in choppy or sideways phases.
Avoid trades if Vega is neutral and CMO is flat – these usually indicate fake breakouts.
If targets aren’t hit within expected ATR-based time, treat the move as false and exit early.
Combine with 9 EMA and 20 EMA (hidden) for wave structure confirmation without cluttering the chart.
💡 Summary:
This indicator acts as a real-time trade decision dashboard. It removes clutter from the chart and delivers everything a professional scalper needs — strength, direction, volatility, momentum, timing, and actionable trade bias — all in one elegant table.

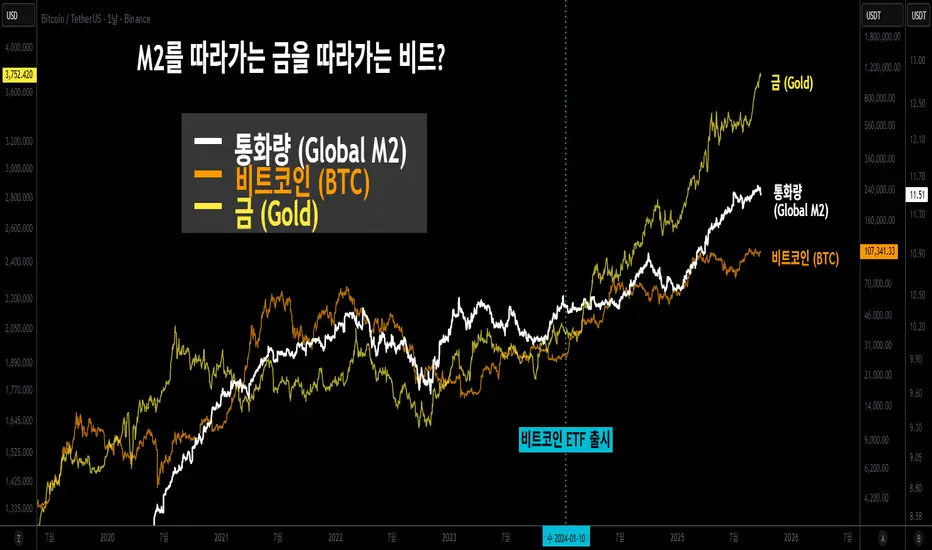
Bitcoin Lagging (N Days)This indicator overlays Bitcoin’s price on any chart with a user-defined N-day lag. You can select the BTC symbol and timeframe (daily recommended), choose which price source to use (open, high, low, close, hlc3, ohlc4), and shift the series by a chosen number of days. An option to normalize the series to 100 at the first visible value is also available, along with the ability to display the original BTC line for comparison.
It is designed for traders and researchers who want to test lagging relationships between Bitcoin and other assets, observe correlation changes, or visualize how BTC’s past prices might align with current market movements. The lagging is calculated based on daily candles, so even if applied on intraday charts, the shift remains in daily units.
이 지표는 비트코인 가격을 원하는 차트 위에 N일 지연된 상태로 표시해 줍니다. 심볼과 타임프레임(일봉 권장)을 선택할 수 있으며, 가격 소스(시가, 고가, 저가, 종가, hlc3, ohlc4)도 설정 가능합니다. 또한 시리즈를 첫 값 기준으로 100에 맞춰 정규화하거나, 원래의 비트코인 가격선을 함께 표시할 수도 있습니다.
비트코인과 다른 자산 간의 시차 효과를 분석하거나 상관관계 변화를 관찰할 때 유용하게 활용할 수 있습니다. 지연은 일봉 기준으로 계산되므로, 분·시간 차트에 적용해도 항상 일 단위로 반영됩니다.
MTF Regime + Breakout-Pullback by HarshMTF BTC regime filter + trend filter, Donchian breakout after a pullback, ATR‑based stop, 2 profit targets, trailing runner, and pyramiding into 3 tranches.

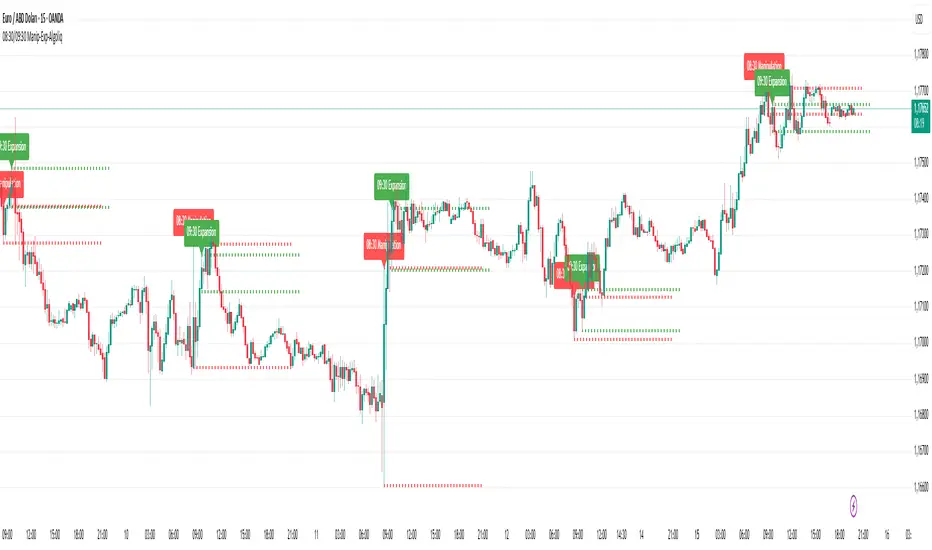
08:30 & 09:30 Manipulation-Expansion - AlgoliqDescription:
The 08:30 & 09:30 Manipulation-Expansion indicator identifies key market levels at two critical times during the trading session: 08:30 (Manipulation) and 09:30 (Expansion). It visually marks the high and low of these bars and provides real-time alerts when price breaks these levels.
Features:
08:30 Manipulation: Highlights high and low with dotted lines and a label. Alerts trigger when levels are broken.
09:30 Expansion: Highlights high and low with dotted lines and a label. Alerts trigger when levels are broken.
Customizable: Set hours, minutes, line colors, widths, and lengths to fit your trading style.
Alert System: Real-time notifications whenever price breaks key levels.
Usage:
Ideal for traders looking to monitor early session price action, detect potential manipulations, and plan breakout trades.
First Window Box + Asia Open HourFirst Window Box + Asia Open Hour is an indicator which marks the High and Low of the Asia Open First hour along with the range marking of First Four Hour and its lenght comparing to the length of last 10 days first four hour range.

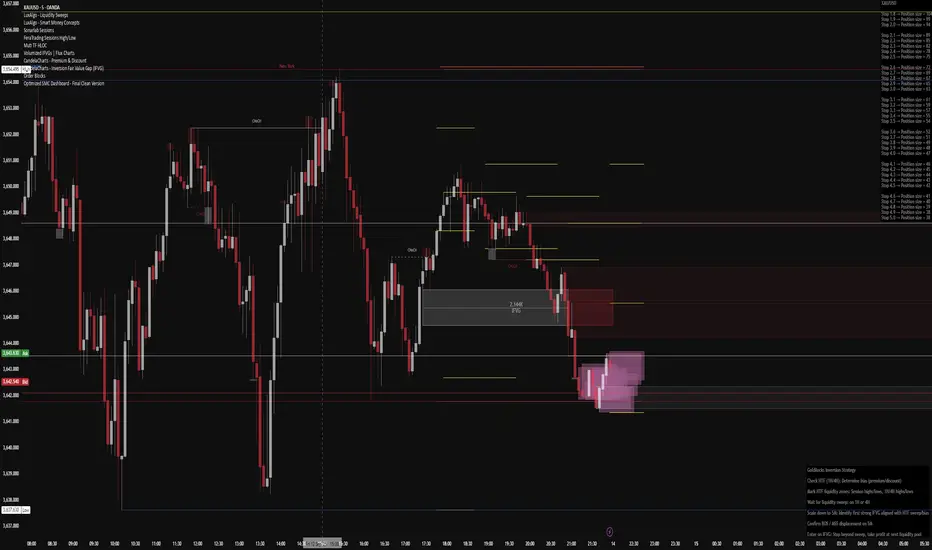
Optimized SMC Dashboard - by MinkyJuiceSMC - all in one
all SMC confluences are included, fully automated and customisable
enjoy, made by MinkyJuice
No Turd Burglars, please
[DEM] Klinger Signal (With Backtesting) Klinger Signal (With Backtesting) is designed to generate buy and sell signals based on the Klinger Volume Oscillator, which combines price movement direction with volume flow to identify potential trend changes and momentum shifts. It also includes a comprehensive backtesting framework to evaluate the historical performance of these signals. The indicator overlays directly on the price chart, plotting signals and displaying performance statistics in a table. The strategy calculates signed volume (positive when HLC3 rises, negative when it falls), applies dual EMA smoothing with configurable fast and slow periods (default 34 and 55), creates a signal line using additional EMA smoothing (default 13 periods), then generates buy signals when the signal line crosses above its own EMA-smoothed version and sell signals on the opposite crossover, combining volume analysis with price momentum to identify institutional money flow changes while tracking signal accuracy, average returns, and frequency through integrated backtesting metrics.
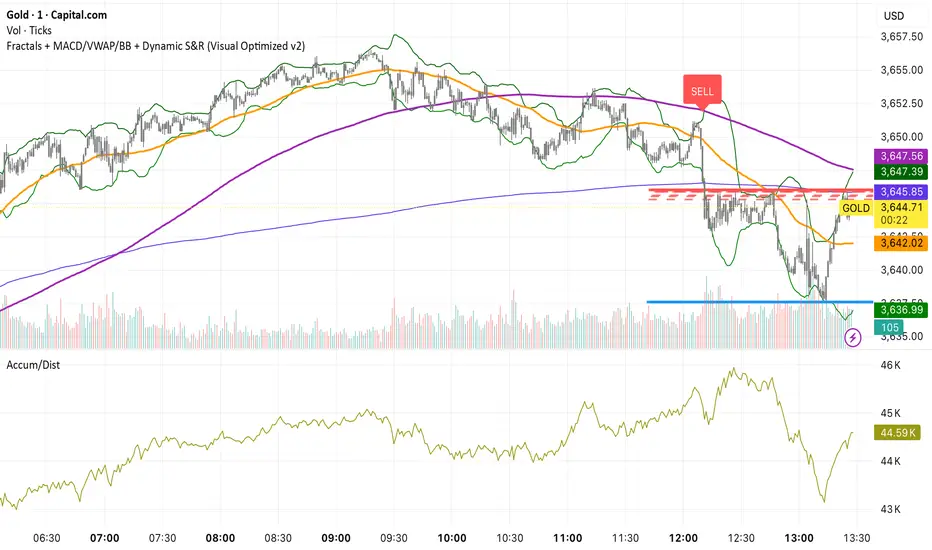
SOLACE PROSOLACE PRO is a confirmation-based trend/breakout indicator that computes on the previous candle to cut intrabar noise and repainting. It plots VWAP, Bollinger Bands (20,2), and SMA50/200, and signals BUY when the prior bar closed above the upper band and above VWAP/SMA50/SMA200 with MACD > signal; SELL when it closed below the lower band and below VWAP/SMAs with MACD < signal. Labels are stamped on the prior bar (offset −1), duplicate same-side signals are suppressed, and alert conditions are included for instant notifications.
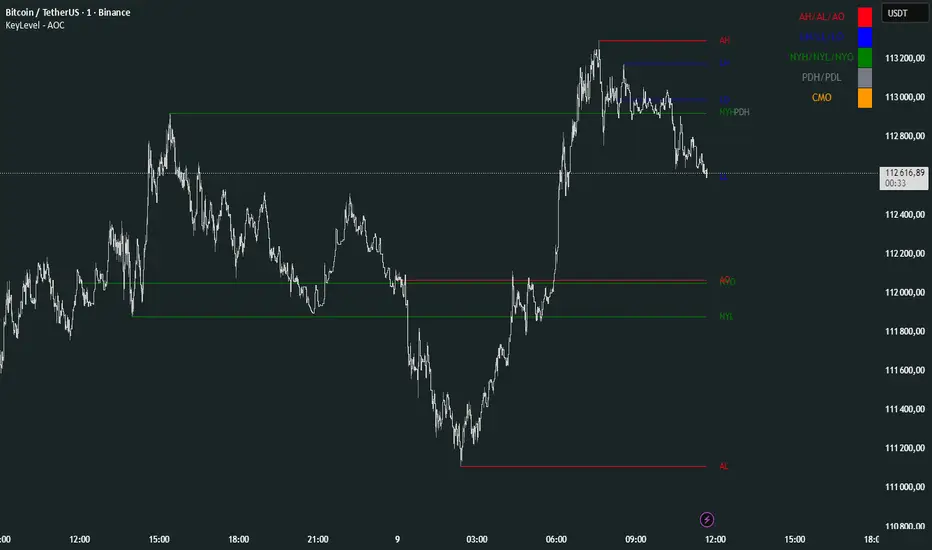
KeyLevel - AOCKeyLevel - AOC
✨ Features📈 Session Levels: Tracks high, low, and open prices for Asian, London, and New York sessions.📅 Multi-Timeframe Levels: Plots previous day, week, month, quarter, and yearly open/high/low levels.⚙️ Preset Modes: Choose Scalp, Intraday, or Swing presets for tailored level displays.🎨 Customizable Visuals: Adjust colors, line styles, and label abbreviations for clarity.🖼️ Legend Table: Displays a color-coded legend for quick reference to session and period levels.🔧 Flexible Settings: Enable/disable specific sessions or levels and customize UTC offsets.
🛠️ How to Use
Add to Chart: Apply the "KeyLevel - AOC" indicator on TradingView.
Configure Inputs:
Preset: Select Scalp, Intraday, or Swing, or use custom settings.
Session Levels: Toggle Asian, London, NY sessions and their open/high/low lines.
Period Levels: Enable/disable previous day, week, month, quarter, or yearly levels.
Visuals: Adjust colors, line widths, and label abbreviations.
Legend: Show/hide the legend table for level identification.
Analyze: Monitor key levels for support/resistance and session-based price action.
Track Trends: Use levels to identify breakouts, reversals, or consolidation zones.
🎯 Why Use It?
Dynamic Levels: Tracks critical price levels across multiple timeframes for comprehensive analysis.
Session Focus: Highlights key session price points for intraday trading strategies.
Customizable: Tailor displayed levels and visuals to match your trading style.
User-Friendly: Clear lines, labels, and legend table simplify price level tracking.
📝 Notes
Ensure timeframe compatibility (e.g., avoid daily charts for session levels).
Use M5 or higher timeframes for accurate session tracking; some levels disabled on M5.
Combine with indicators like RSI or MACD for enhanced trading signals.
Adjust UTC offset if session times misalign with your broker’s timezone.
NQ Open Playbook (with Toggles)marks out asain,london.ny high and lows on 4h,1h,15m simple little stradGY FOER BEGINERS TO GET A FEEL FOR THE MARKET.
ATEŞ ÇOKLU TARAMA)My educational scanning efforts are ongoing. I'll make adjustments based on your feedback. I look forward to your feedback if there are any incorrect data. Each group contains 40 stocks. The entire bid is attached. You can create your own custom list of 40+40.

𝙵𝚛𝚊𝚖𝚎𝚠𝚘𝚛𝚔|[𝙰|𝛺]This indicator was designed and coded by me, providing a clean and efficient adaptation of the teachings from Inner Circle Trading (ICT). The tool is intended to display various data points that help streamline and simplify your trading process. However, it does not generate signals or recommendations for trade execution.
It is designed to automatically display different components according to the timeframe you are analyzing. From the Hourly chart down to the seconds, you will be able to visualize a wide range of time-based data points in one indicator.
On the Hourly timeframe, the indicator begins with the Weekly Profile using the True Day . You will be able to visualize Monday’s price extended throughout the entire week, as well as each individual day of the week separately.
You can also visualize the equilibrium and quadrants of each individual day, if desired.
ICT 3-Day Protocol: This feature extends the highs and lows of the previous two days up to the current candle. These levels can serve as potential draws on liquidity or reference points for identifying opportunities on lower timeframes.
M15 Timeframe
On this timeframe, you will be able to visualize the previously mentioned elements, with the addition of the Asian and London sessions. These are included to help outline the potential intraday profile, as well as the highs and lows of these sessions, since they represent relevant data points.
You will also have the option to display projections of these ranges. These projections are useful for anticipating potential price manipulation and distribution levels, using Midnight Open as the reference point for the Daily PO3 .
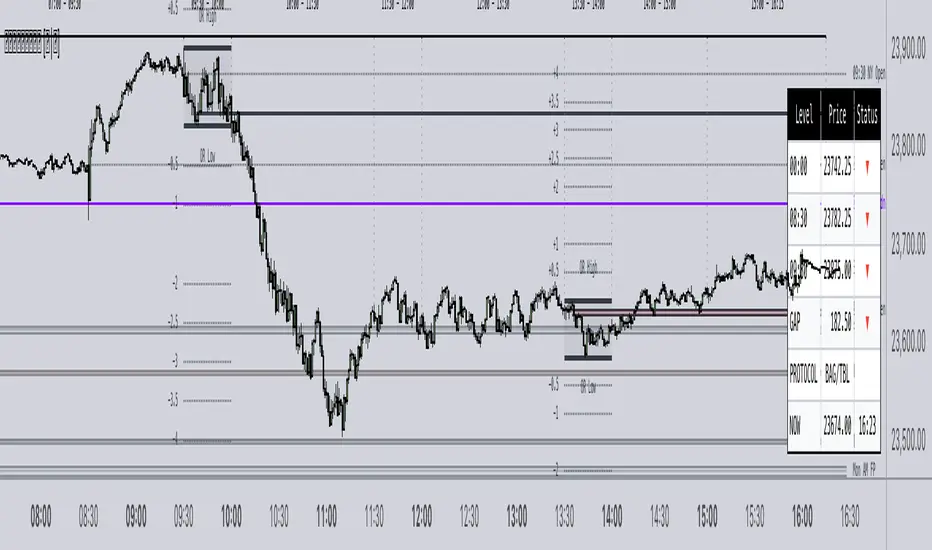
You will also be able to visualize different Opens , including:
• 00:00
• 08:30
• 09:30
• 13:30
• Previous day’s Settlement Price
These levels represent relevant data points that can be used to frame implied discount or premium conditions relative to the Time of Day .
M1 and Seconds
On this timeframe, you will be able to see the previously mentioned elements, along with additional features.
Market Session Dividers: These are included to provide a clear and organized visual reference of which session the market is currently in, as well as the separation between one session and another.**
Opening Ranges: This feature allows you to visualize the Opening Range of the AM and PM sessions, along with their respective projections. You can also choose whether to extend these ranges over time or keep them limited to their formation period.
First Presentations: This feature allows you to visualize the initial imbalance of the Regular Trading Hours session, including both the AM and PM sessions.
Additionally, an option is included in the menu to indicate if the current day has high-impact news before the 09:30 open, allowing you to consider including the formation of the First Presented Gap from 09:29, as recommended by ICT.
You can also enable alerts to be notified each time a First Presentation is formed.
Table: This feature displays a table with the various Openings mentioned earlier. It shows the price and indicates whether the market is at a Discount or Premium relative to these levels using an arrow.
The table also displays the size of the Opening Range Gap and, with an arrow, indicates whether it is a Premium or Discount Gap.
It provides different possible protocols based on the gap size and other elements taught by ICT to help anticipate certain market scenarios.
Additionally, it shows the current time and changes the color of the time indicator depending on whether you are within a macro session or not. This keeps your chart clean while still allowing you to know if the market is in a macro session.
All elements of the indicator are customizable . You can personalize virtually every component to suit your preferences.
The Engineer.