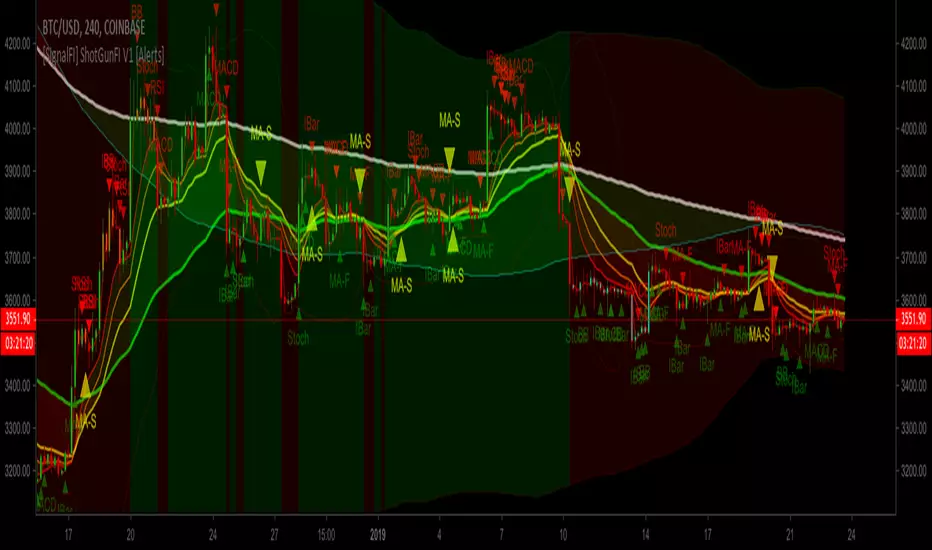
[SignalFI] ShotGunFI V1 [Alerts]Welcome to ShotGunFI
In order to help give our members awareness of how major indicators move market price action, we created ShotGunFI. This script provides signals for the following indicators and gives a customizable framework for the user to track how certain indicators impact price and further how those impacts could relate to their overall strategy. We took the major indicators that are used in the market and smashed them into one chart with one indicator so that you can visualize a broad spectrum of strategies that are already driving price action.
This script is enabled with Data Leak and Repaint protection by default. Ensuring that signals are true.
The following indicators are included:
//+RSI Ob/Os Crossover Signals
- Candles are colored Orange and Aqua when RSI is overbought or oversold.
- Arrows and Alerts for crossover 30 and crossunder 70 RSI.
//+Slow Stochastic Signals
- Arrows and Alerts for crossover 20 and crossunder 80 Stoch RSI
//+MACD Bull/Bear Signals
- Arrows and Alerts for MACD Bull and Bear Signal line crossovers
//+MA Cross Bull/Bear Signals
- Arrows and Alerts for MA 1 Cross of MA 1 and MA 1 Cross of MA 4.
By default EMA is enabled, however, we included several other MA types to enhance and expand on this concept.
Included are the following MA types:
Kaufman Adaptive Moving Average ( KAMA )
Hull Moving Average
Smoothed Moving Average
Variable Index Dynamic Average
Fractal Adaptive Moving Average
Fractal Dimension Adaptive Moving Average
Double Exponential Moving Average
Least Squares Moving Average
Coefficient of Variation Weighted Moving Average
Simple Weighted Moving Average
Exponential Moving Average
Weighted Moving Average
Arnaud Legoux Moving Average
Option Types Labels:
"SWMA", "EMA", "WMA", "SMA", "HMA", "KAMA", "SMMA", "VIDYA", "VWMA", "ALMA", "FRAMA", "DEMA", "FDAMA", "LSMA", "COVWMA"
//+BollingBand Bull/Bear Signals
- Arrows and Alerts for lower BB crossover and higher BB crossover
//+Bollinger Band + RSI (BBRSI) Bull/Bear Signals
- Arrows and Alerts for custom higher timeframe Bollinger Band that integrates RSI. 4 Signals total.
//+InsideBar Bull/Bear Signals
- Arrows and Alerts for InsideBar bull/bear break combinations.
ALERTS VERSION Only for Jedi and Master Subscribers
SignalFI was created to help traders and investors to effectively analyze the market based on the Golden Mean Ratio (Fibonacci numbers), plan a trade and ultimately execute it. To help inform and educate market decisions we developed a set of Trading Indicators which are available on TradingView , the most advanced and yet easy to use charting platform available on the web.
SignalFI indicators are just that, indicators. Our indicators are generally configured to use completely historical data (negating repaint), and we advise all alerts created with SignalFI indicators to be fired upon "close" of the current candle. Our indicators can provide valuable context and visualization support when performing market analysis and executing buy and sell decisions. However. we are not financial experts, and all information presented on this site or our other media outlets are for educational purposes only.
For subscription information, visit www.signalfi.net and follow us on twitter.
Crypto
1hTriLine, so much power, so easy to use....So many nuances to this one. So many powerful strategies to devise. Responsive. Accurate. Easy to use. Everything you can expect from one of my scripts. Trading made easy.
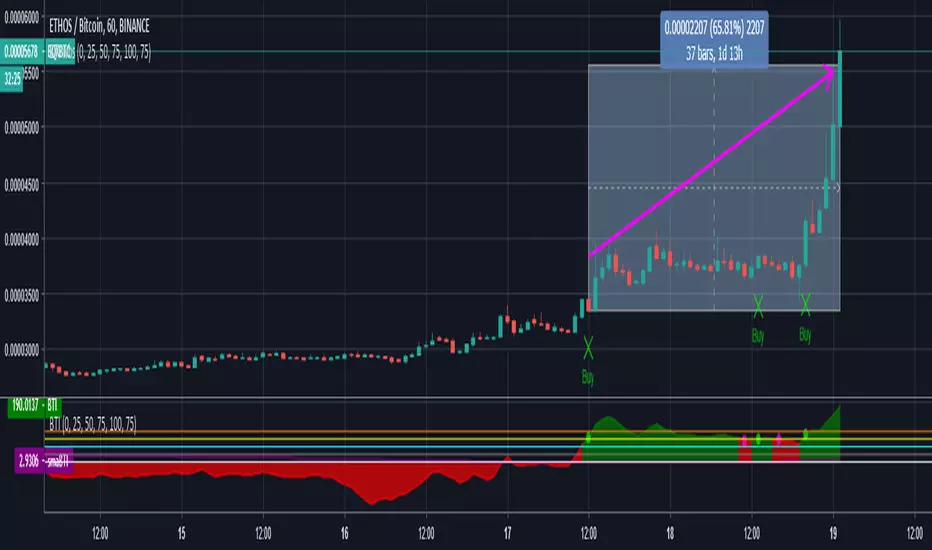
Bull Trend Indicator with Buy Sell2New version of Bull Trend Indicator for crypto, plots Buy text:
- Buy signal fine-tuned for high momentum (only Buy signal at BTI crossedover 75)
- Removed Buy signal when BTI crossedunder 75

Bull Trend Indicator v2New version of Bull Trend Indicator for crypto:
- Buy signal fine-tuned for high momentum (only Buy signal at BTI crossedover 75)
- Removed Buy signal when BTI crossedunder 75

Crypto Bull Detector (CBD)Crypto Bull Detector (CBD) is my very own customized crypto screener which attempts to finds bullish coins. This is an implementation of my previous BTI (Bull Trend Indicator).
Right now I have placed 6 coins on it so it is watching those 6 coins. It can watch more coins, hundreds if you like, they just need to be added in the future. It uses the prices of these various coins for the calculations to determine the likelihood of the coin pumping. Once any of those coins get detected as bullish, it will pop-up and plot on the bottom chart. No need to watch hundreds of coins, it can all be added in here in one indicator.
With this CBD indicator you will be able to buy the right coin at the right time to maximize your profits since it is likely to be on bullish trend.
Message me for trial access (via email preferred).

PpSignal Haiken Hashi and Alma Super Smoother John Ehlers Buy or sell when alma and Haiken Ashi Change a Color.
Cyatophilum Ichimoku Small TimeFrames [ALERT SETUP]A script for daytraders trading small timeframes.
Currently in developpement.
If you want to try it send me a PM, and give a like to receive updates.
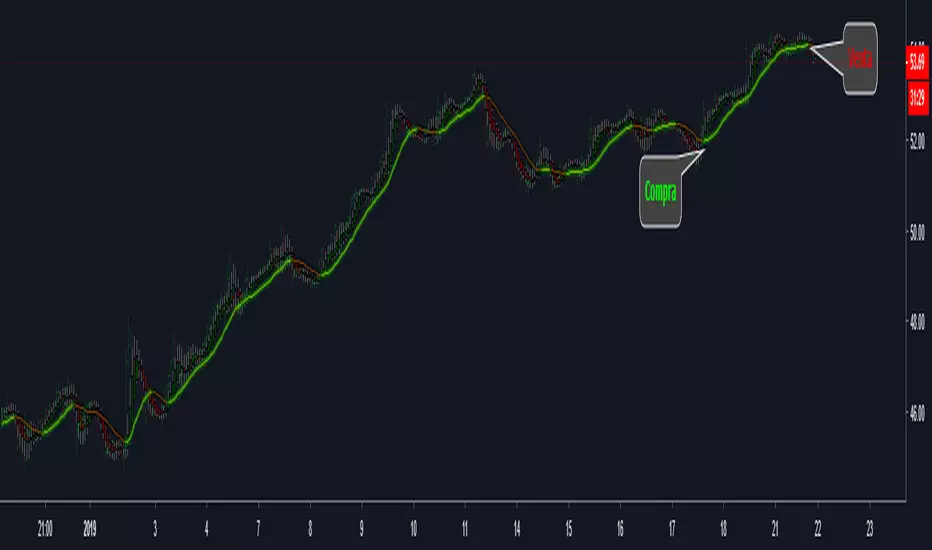
Bull Trend Indicator with Buy Signal on Chart (BTI wbs)Bull Trend Indicator with Buy Signal on Chart (BTI wbs)
Purpose:
- With so many coins/stocks to choose from, which ones do you buy to get profits ($) ? Enter BTI, you can use this indicator to find coins/stocks that have high chance of being profitable. The indicator finds potentially profitable coins/stocks and signals "buy"on the chart when it does. Best way to test this indicator is to load the top coins of the day and see how the indicator performs on past data. Emails/alerts can also be set on your favorite coins so that you get alerted/receive emails when its time to buy.
Some notes:
this is a minor modification of the original Bull Trend indicator with clear "buy" text added to plot on chart
- indicator is for crypto and stocks
- attempts to find bullish coins/stocks that will give maximum profits
- only produces buy signal on chart when the program estimates it will be bullish
- test this against the top coins of the day to see how it works, you will see recent buy signals which gives you time to buy
- test this against worst coins of the day and you will see there are no buy signals generated on down days which avoids buying
- test this against best performing stocks of the year and you will see plenty of buy signals to get profit
- play around with the time frames (usually 1hr, 2hr works for crypto, experiment with time)
- the shorter the timeframe used the more reliable is the calculation, but the disadvantage is it could be too late to buy so try to get a balance timing and accuracy
- for stocks could use longer time frame (usually 1 day)
- if the indicator does not plot, that means data is insufficient to do the calculations, so lower the timeframe until you get plots
- sorry by subscription only, message me if interested
- limited free trials
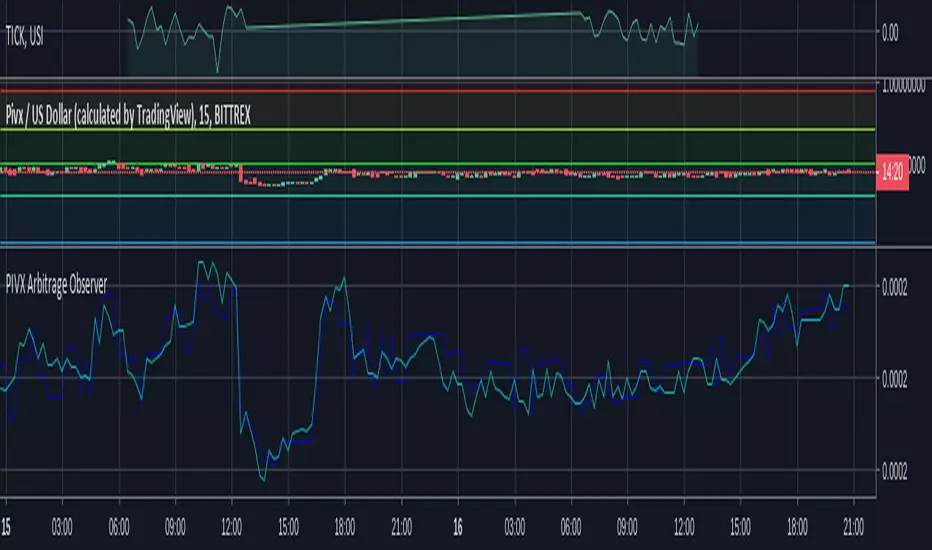
PIVX Arbitrage ObserverObserve PIVX price arbitrage in BTC on two exchanges that TradingView has listed. It's on a bunch more but TV doesn't track them :/
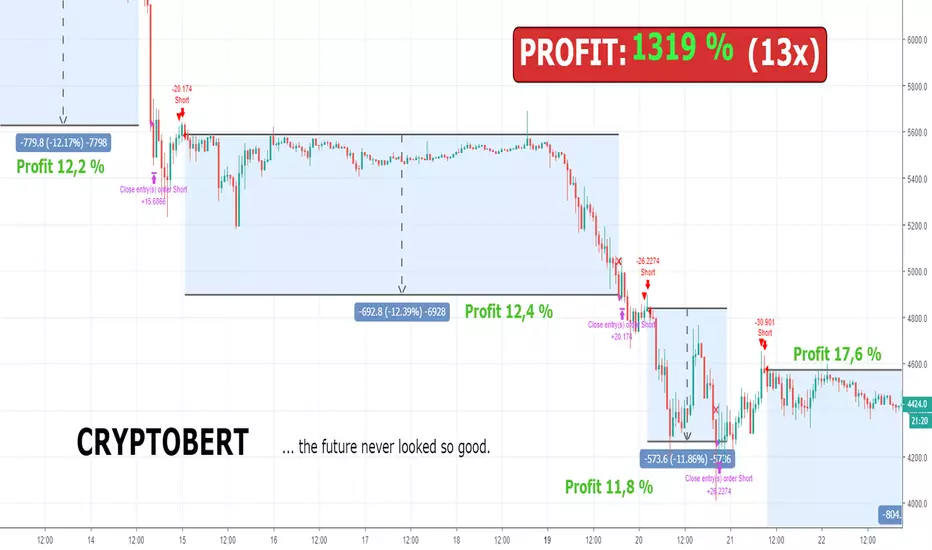
Bert LONG BTC Study (Alerts) - Profit 2018: 1319 % (no leverage)Bert LONG Term BTC study (BITMEX) - script for setting alerts and trading bots
This is a revolutionary strategy for bitcoin (XBT) trading. The strategy is perfectly configured for trading on the Bitmex exchange. No further configuration and setup is required.
The strategy itself recognizes a volatile period or whether the market is in downtrend, uptrend or sideways. Accordingly, it applies the appropriate orders to reach maximum profit.
The strategy can be handled manually, you can receive alerts (popup, email, sms) or can be fully automated by bot (works with: Autoview, Gunbot, Profitview, Jubot and others) without any manual intervention.
What is the minimum and maximum capital I can trade with?
You can trade with 0.0001BTC – 1000BTC. That is one of many advantages of using this strategy on XBT. There is enough liquidity to execute the order for the market price with a big investment amount.
What is the recommended setting?
Timeframe: 45m
Chart: Bitcoin/USD Dollar Perpetual Inverse Swap Contract (XBT)
Leverage: 2x
Orders: Long and Shorts
Why was this strategy created?
You have basically two option how to make money in crypto market. HODL (buy the coin and believe it will rise to the moon) and TRADING (only 3-5% traders are profitable, most of them are full time traders with 5+ years of experience in trading).
If you HODL btc in this year, you are -70 % this year
If you are TRADING, the results depend on how good you are (think about this, if you decide to be a heart surgeon, rocket star or NBA player, do you think you can be? Yes, you can but the chances are very small. The same probability you have that you will be in the 3-5% profitable traders 😊). It takes time, you need experience and still 96% all of you will never be a profitable traders!
If you use Bert BTC long term strategy, you are + 1319 % this year
How well the Bert BTC strategy performs?
Profit in 2018 was 1319 % / 13x (without leverage)
Profit in 2018 was 11 477 % / 115x (with leverage 2)
If you invested (with leverage 2) 1 000 USD you have now 114 766 USD
If you invested (with leverage 2) 10 000 USD you have now 1 147 660 USD
Detailed trades report for 2018 (you can calculate your own profit with specific investments and leverage) – download excel here
Notes:
You will hardly find better strategy on the market which achieves similar results with minimal risk and can operate in any market condition (downtrend, uptrend, sideways).
We guarantee the strategy does not repaint, and we use real candles (not heikin ashi or renko which does not reflect real prices).
We wish you to become financially independent and all your secret wishes to be fulfilled.
And in case if you still want to HODL or you want to be TRADING all the days watching to your monitors, consider to try our strategy at least with a minimum capital invested, you will see that you will not regret in long run. Be patient and the money will come to you!
For access to this strategy visit website: www.cryptobert.io
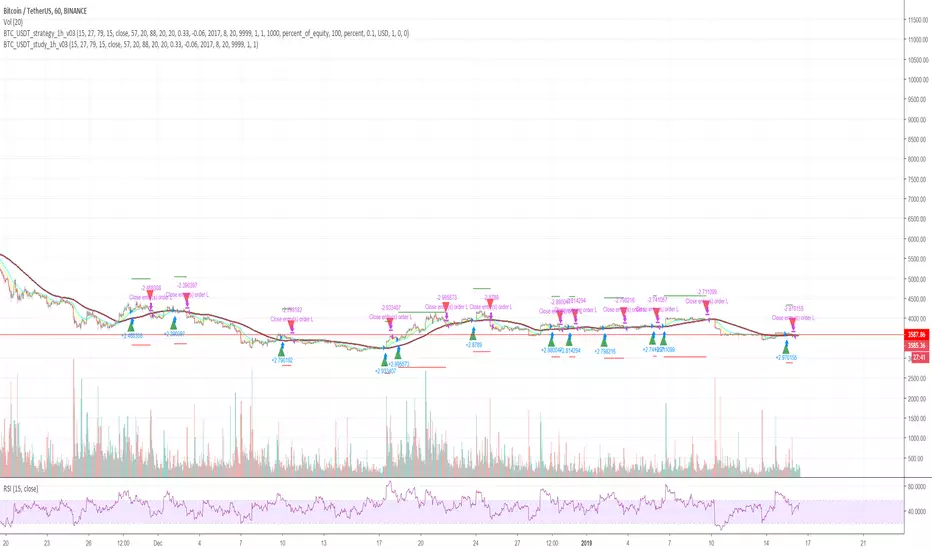
Cryptocurrency trend following LONG only studyThis strategy uses multiple indicators to find optimal time to enter/exit the trade. The default setting is mainly for trading bitcoin/stable coin pair such as USDT etc on 1h timeframe but it can be applied to any pair/any timeframe with some settings adjustments.
Strategy settings description:
ID Name Descrption
1 FastMA - Value for fast exponencial moving average
2 SlowEMA - Value for slow exponencial moving average
3 SMA - Value for simple moving average
4 RSI Length - Length of RSI identificator
5 RSI Source candle - What price of candle is used for RSI calculation (open, close, high, low)
6 RSI Long condition - When buy, RSI indicator must be below this value to prevent of buying already overbought coin
7 RSI Short condition - When sell, RSI indicator must be above this value to prevent of selling already oversold coin
8 RSI close trade condition - Sell once RSI indicator acquires defined value
9 Take Profit (%) - Take profit value in percent
10 Stop Loss (%) - Stop loss value in percent
11 Long price toleration (%) - Price deviation for filtering bounces of simple moving average - price must close defined percents above SMA to open long trade
12 Short price toleration (%) - Price deviation for filtering bounces of simple moving average - price must close defined percents bellow SMA to close long trade
13 From Year - To run strategy in interval
14 From Month - To run strategy in interval
15 From Day - To run strategy in interval
16 To Year - To run strategy in interval
17 To Month - To run strategy in interval
18 To Day - To run strategy in interval
19 Show every signal? - (Study only) Unchecked shows only first signal based on strategy. But if you use take profit/stoploss settings within your bot, you might want to rebuy on next signal. Checked shows signal on each candle.
Notice that there are also false signals, especially when the coin is not trending or is strongly manipulated. Overall strategy is profitable though. You just take some minor loses and wont miss the big move.
You may also consider to compare buy&hold return vs profit from trading this strategy. In downtrend as we have seen recently, profit may not be as high as you expect but it is still much better than just hold and hope.
You can use the strategy script for fine tunning settings and find best settings for yourself
Study script helps you to automate trading with use of alerts perharps with 3commas bot or even trade manually based on email/sms notification setted by tradingview
Make sure that you keep same settings for strategy and study scripts.
If you need any help with settings do not hesitate to ask. I would also appriciate any feedback and ideas how to improve this script.
Here is backtest result from 23.08.2017:
[SignalFI] - FutureFI Free [BTC Long VS Short RSIFutureFI uses the futures (Long and Short) contracts housed on Bitfinex to provide a gauge for the relative difference and strength of interest in buying or selling Bitfinex assets based on total contracts created.
FREE VERSION
Hi All,
Welcome to the free version of FutureFI which shows the RSI of the difference between BTC Long and Short Contracts on Bitfinex. In this version, the difference between the RSI of the contracts can be viewed however the following features are locked for members only:
1) Longpower and Shortpower color shading
2) Total New Longs added column bars
3) Multi-Timeframe Signals
4) Longpower and Shortpower Exhaustion Alert signals
5) Chart Asset Standard RSI Exhaustion Alerts
We hope that you find this useful, and that you're interested in the advanced signaling available in our members only scripts which take this concept to a new level.
Supported Assets:
LongAsset "BTCUSDLONGS"
MEMBER "ETHUSDLONGS","XRPUSDLONGS","EOSUSDLONGS","LTCUSDLONGS","BTGUSDLONGS","ETPUSDLONGS","IOTUSDLONGS","ETCUSDLONGS","ZECUSDLONGS","NEOUSDLONGS","XMRUSDLONGS","ZRXUSDLONGS","OMGUSDLONGS","DSHUSDLONGS","BABUSDLONGS","BSVUSDLONGS","SANUSDLONGS","EDOUSDLONGS","TRXUSDLONGS","XLMUSDLONGS","BATUSDLONGS","VETUSDLONGS","SNGUSDLONGS"
ShortAsset "BTCUSDSHORTS"
MEMBER
"ETHUSDSHORTS","XRPUSDSHORTS","EOSUSDSHORTS","LTCUSDSHORTS","BTGUSDSHORTS","ETPUSDSHORTS","IOTUSDSHORTS","ETCUSDSHORTS","ZECUSDSHORTS","NEOUSDSHORTS","XMRUSDSHORTS","ZRXUSDSHORTS","OMGUSDSHORTS","DSHUSDSHORTS","BABUSDSHORTS","BSVUSDSHORTS","SANUSDSHORTS","EDOUSDSHORTS","TRXUSDSHORTS","XLMUSDSHORTS","BATUSDSHORTS","VETUSDSHORTS","SNGUSDSHORTS"
SignalFI was created to help traders and investors to effectively analyze the market based on the Golden Mean Ratio (Fibonacci numbers), plan a trade and ultimately execute it. To help inform and educate market decisions we developed a set of Trading Indicators which are available on TradingView , the most advanced and yet easy to use charting platform available on the web.
SignalFI indicators are just that, indicators. Our indicators are generally configured to use completely historical data (negating repaint), and we advise all alerts created with SignalFI indicators to be fired upon "close" of the current candle. Our indicators can provide valuable context and visualization support when performing market analysis and executing buy and sell decisions. However. we are not financial experts, and all information presented on this site or our other media outlets are for educational purposes only.

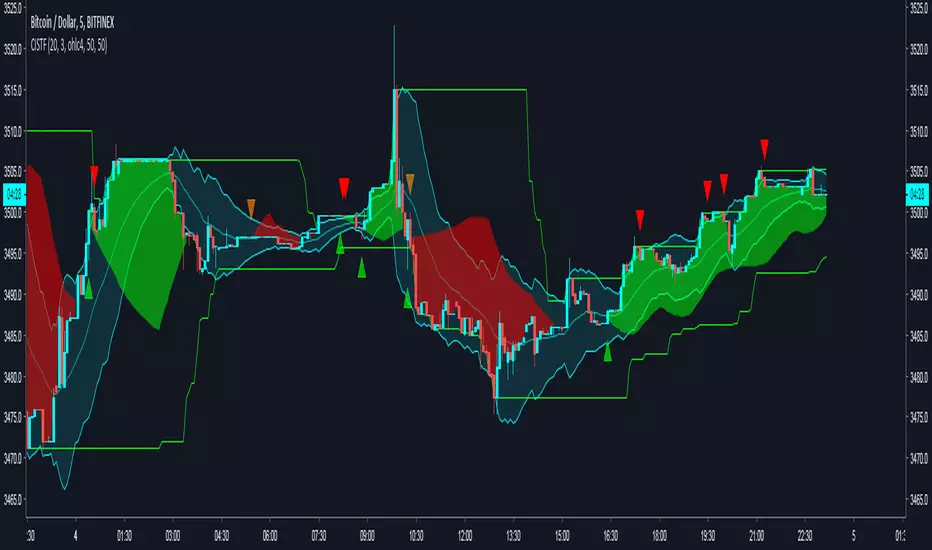
[SignalFI] PhilakOne ExtremeWelcome,
This script is provided for free as a support system for the trading strategy developed by Philakone (@philakonecrypto).
Phil has been providing immense support to the trading community through consistent education, and thats why we decided to adapt and automate his system so that everyone can follow.
Key Features
1. Moving Averages
By default fibonacci based EMA moving averages are included with the script set at:
- MA 1 = 8
- MA 2 = 13
- MA 3 = 21
- MA4 = 55
We also added green and red fill colors to show the current status of each MA with respect to the other MA's.
By default Phil uses EMA, however, we included several other MA types to enhance and expand on this concept. Included are the following MA types:
Kaufman Adaptive Moving Average(KAMA)
Hull Moving Average
Smoothed Moving Average
Variable Index Dynamic Average
Fractal Adaptive Moving Average
Fractal Dimension Adaptive Moving Average
Double Exponential Moving Average
Least Squares Moving Average
Coefficient of Variation Weighted Moving Average
Simple Weighted Moving Average
Exponential Moving Average
Weighted Moving Average
Arnaud Legoux Moving Average
Option Types Labels:
"SWMA", "EMA", "WMA", "SMA", "HMA", "KAMA", "SMMA", "VIDYA", "VWMA", "ALMA", "FRAMA", "DEMA", "FDAMA", "LSMA", "COVWMA"
2. RSI
Phil relies on simple RSI to determine the relative strength of a trend. To display this easily we added bar coloring that matches overbought and oversold situations.
Red Bars = RSI > 70
Green Bars = RSI < 30
3. MACD
Phil also uses MACD to determine the trend. To display this easily we added signals above and below bars to show crossovers between the MACD and the MACD Signal line.
Small Green Triangle UP = MACD bull cross
Small Red Triangle DOWN = MACD bear cross
4. Alerts
We know that everyone can't watch charts all day, so we configured this script with full alerting for each of the components above.
1. Moving Average Bull Cross
2. Moving Average Bear Cross
3. RSI Overbought Cross
4. RSI Oversold Cross
5. MACD Bull Cross
6. MACD Bear Cross
Thanks to Phil for the inspiration and continued community education.
We hope you enjoy!
General Information
SignalFI was created to help traders and investors to effectively analyze the market based on the Golden Mean Ratio (Fibonacci numbers), plan a trade and ultimately execute it. To help inform and educate market decisions we developed a set of Trading Indicators which are available on TradingView , the most advanced and yet easy to use charting platform available on the web.
SignalFI indicators are just that, indicators. Our indicators are generally configured to use completely historical data (negating repaint), and we advise all alerts created with SignalFI indicators to be fired upon "close" of the current candle. Our indicators can provide valuable context and visualization support when performing market analysis and executing buy and sell decisions. However. we are not financial experts, and all information presented on this site or our other media outlets are for educational purposes only.
For subscription information, visit www.signalfi.net and follow us on twitter.

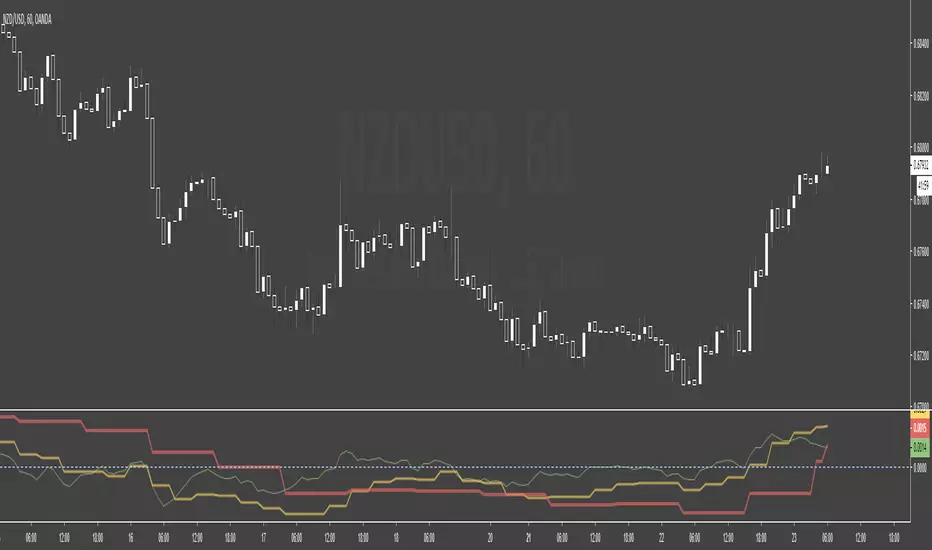
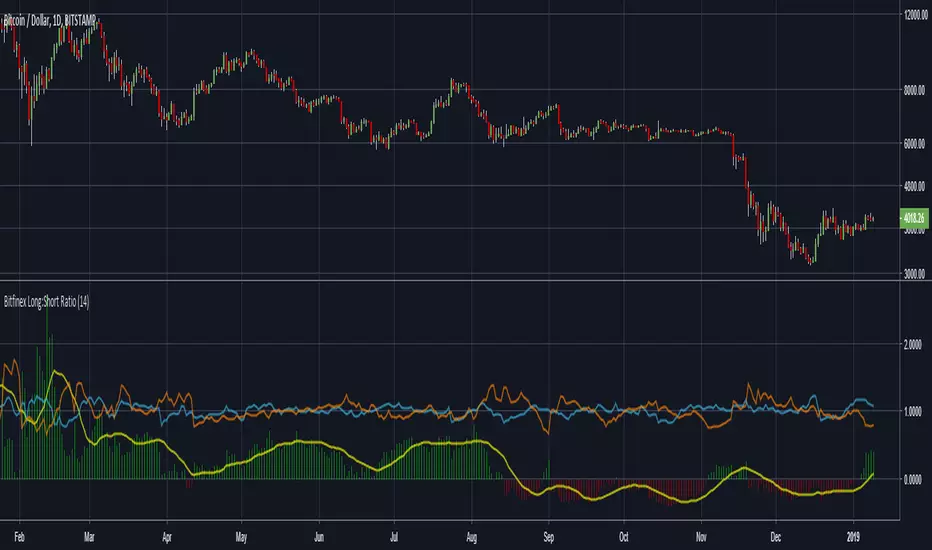
Bitfinex Long:Short RatioThis is a simple indicator that creates a ratio of margin Long & Short positions on Bitfinex for the ticker you currently have selected. If the ticker you are looking at does not have margin positions on Bitfinex; it will error out - however when you select another ticker it automatically resets.
The indicator provides the following:
Histogram of the ratio of margin Longs to margin Shorts. + results (green) are higher longs; - results (red) are higher shorts. NOTE: A 1:1 ratio has been offset to a 0 cross for the benefit of the histogram
A simple moving average line (yellow) for quick reference of current margin trend. Length is adjustable viable input.
A plotted line (blue) of margin longs as a ratio to the SMA of Longs. Above 1 indicates acceleration of trend; below 1 indicates deceleration
A plotted line (orange) of margin shorts as a ratio to the SMA of Shorts. Above 1 indicates acceleration of trend; below 1 indicates deceleration
Ratio is based on the close position and is intended as reference only. Don't rely on this supplied information as a sole indication prior to making a trade.
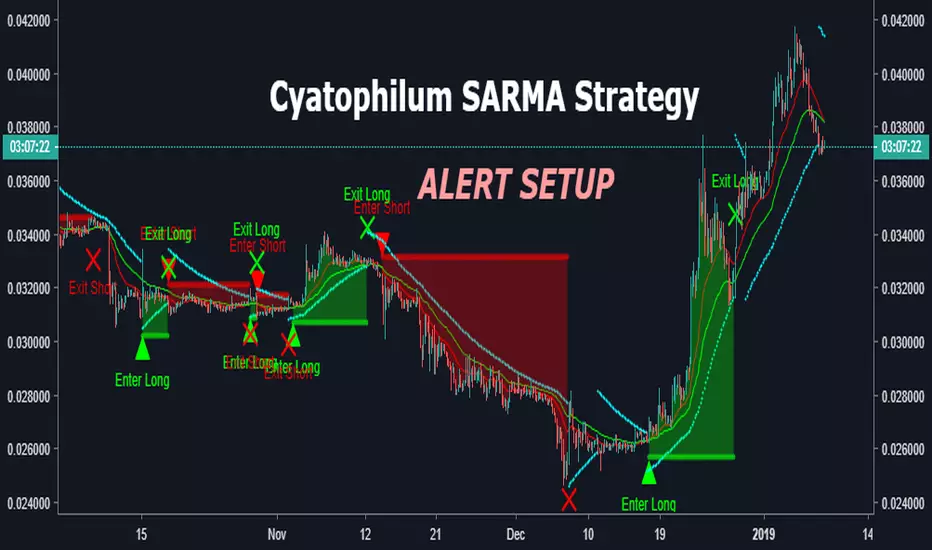
Cyatophilum SAR-MA Strategy [ALERT SETUP]An Automated Strategy based on Parabolic SAR and EMAs, also called the SARMA Strategy. Works on any timeframe and market.
Read More
This indicator will trigger long/short signals entries and exits. Excellent for manual or bot trading!
It has a stop loss system that you can activate to reduce risk.
Note: If a stop loss is reached, an exit alert is triggered.
This is the Alert Setup version. That means it is used to create automatic email or SMS alerts.
It has a Backtest version that you can use to find the best configuration. I will also be there to help you on my Discord channel .
Sample Use cases
Get the indicator today!
Crypto Aggregated VolumeThis is a helper tool to perform reliable volume studies in Crypto markets .
Currently, we face the problem of unreliable crypto volume when focusing on a single exchange.
Volume keeps flowing from place to place each time a new fashion exchange appears in the scene.
"Old" exchanges that once were relevant might dry in volume terms. And that's an issue to study volume on a wider context.
For that reason, I've created this indicator: to aggregate crypto volume and overcome the current limitations.
As a user, you're able to select which exchanges to aggregate:
Volume from Unleveraged Exchanges
Volume from Leveraged Exchanges
All Exchanges
Or custom select the exchanges by marking the checkboxes
By default, the indicator is aggregating volume from unleveraged exchanges. The reason for that is because their read might be more reliable.
Trading Bots which distort the volume read, mainly operate in margin exchanges because unleveraged trading is less attractive to them.
On this first release I've aggregated the volume from the following markets:
BTCUSD
ETHUSD
ETHBTC
I've found that aggregating markets is a time intensive task. Therefore if you're using this indicator, please leave a comment below and let me know which other markets you would like being added.

Munich -- By @CryptoNTezMunich is a new tool for Crypto and other markets that brings the easiest approach to trading with a high profitability rate
Trend direction of the market plus other indicators that allow the script to print different signals with top accuracy
Munich will handle Short and Long signals plus signals of where to close them.
Optimized for crypto markets, to catch trend movements as soon as possible and maximize profitability
The Script does not repaint (just in case you wonder...) and access to it will be available in my website CryptoNTez.com

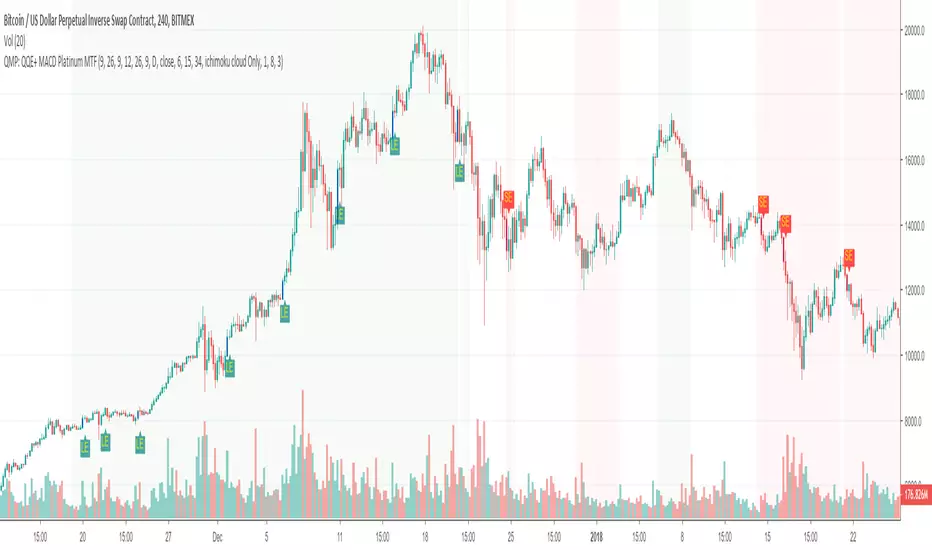
Trend following and reversal strategy for cryptoThe idea of this indicator comes from Jim Brown's book.
using the "MACD Platinum" and "QQE advanced" and multi-timeframe.
The difference to the original idea is that I use Ichimoku cloud for trend detection.
Cyatophilum Crypto Trader 1H [ALERTSETUP]A strategy specificaly engineered for trading altcoins.
Crypto pairs configurations already available: ADA/BTC, BNB/BTC, EOS/BTC, ETH/BTC, ICX/BTC, NEO/BTC, TRX/BTC, XLM/BTC, XMR/BTC, XRP/BTC.
This version allows to create automated alerts for buy and sell signals that can be used for manual or bot trading.
Note: You can use the backtest version for finding the best configuration for your pair if it isn't in the list. I will also be there to help you.
How it Works
The strategy is based upon two Exponential Moving Averages, it captures trend reversals, fakeouts, has a stop loss option and more (see the presentation page for input parameters description).
It should be used in 1 Hour timeframe and on any pair of cryptocurrency.
Backtest
The Net Profit (Gross profit - Gross loss) is calculated with a commission of 0.05% on each order.
Each trade is made with 100 % of equity
Get the indicator today!
Purchase on my website : blockchainfiesta.com

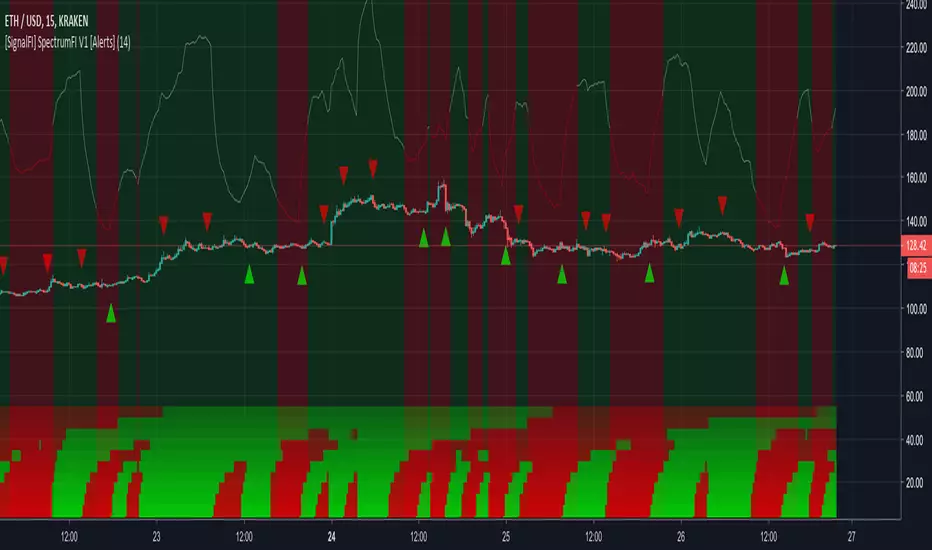
[SignalFI] SpectrumFI V1 [Alerts]SpectrumFI uses 11 independent Fibonacci based moving averages and their associated momentum to create a unified trend signal.
FIBONACCI BASED TREND DISCOVERY
DIFFERENCE STATISTICS COMBINED WITH RSI MOMENTUM
HEATMAP AND RSI INDICATORS BUILT INTO ONE TRADINGVIEW INDICATOR
ALERTS VERSION Only for Jedi and Master Subscribers
SignalFI was created to help traders and investors to effectively analyze the market based on the Golden Mean Ratio (Fibonacci numbers), plan a trade and ultimately execute it. To help inform and educate market decisions we developed a set of Trading Indicators which are available on TradingView , the most advanced and yet easy to use charting platform available on the web.
SignalFI indicators are just that, indicators. Our indicators are generally configured to use completely historical data (negating repaint), and we advise all alerts created with SignalFI indicators to be fired upon "close" of the current candle. Our indicators can provide valuable context and visualization support when performing market analysis and executing buy and sell decisions. However. we are not financial experts, and all information presented on this site or our other media outlets are for educational purposes only.
For subscription information, visit www.signalfi.net and follow us on twitter.
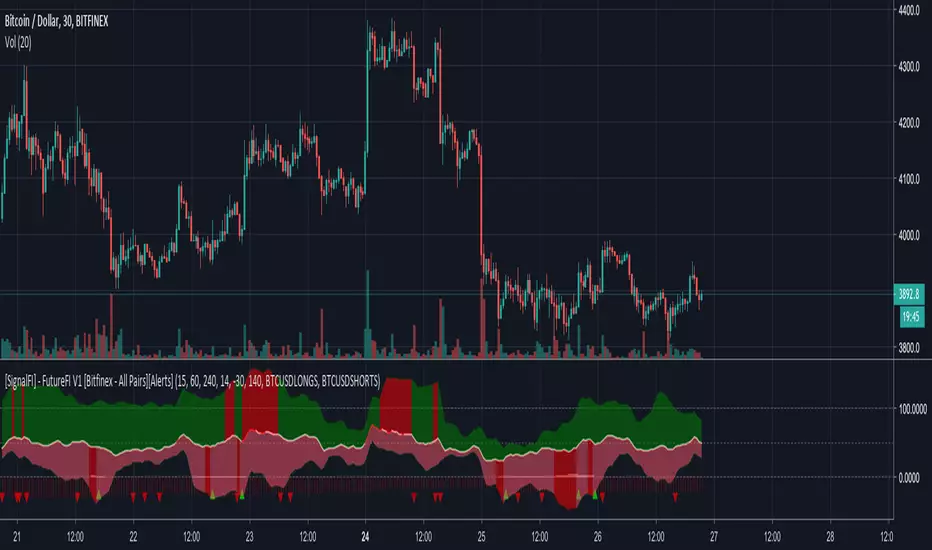
[SignalFI] - FutureFI V1 [Bitfinex - All Pairs][Alerts]FutureFI uses the futures (Long and Short) contracts housed on Bitfinex to provide a gauge for the relative difference and strength of interest in buying or selling Bitfinex assets based on total contracts created.
MUTLTIPLE-TIMEFRAME RSI FOR FUTURES CONTRACTS
DIFFERENCE STATISTICS COMBINED WITH RSI MOMENTUM
SIGNALS CAN BE APPLIED OUTSIDE OF BITFINEX
ALERTS VERSION Only for Jedi and Master Subscribers
Supported Assets:
LongAsset "BTCUSDLONGS","ETHUSDLONGS","XRPUSDLONGS","EOSUSDLONGS","LTCUSDLONGS","BTGUSDLONGS","ETPUSDLONGS","IOTUSDLONGS","ETCUSDLONGS","ZECUSDLONGS","NEOUSDLONGS","XMRUSDLONGS","ZRXUSDLONGS","OMGUSDLONGS","DSHUSDLONGS","BABUSDLONGS","BSVUSDLONGS","SANUSDLONGS","EDOUSDLONGS","TRXUSDLONGS","XLMUSDLONGS","BATUSDLONGS","VETUSDLONGS","SNGUSDLONGS"
ShortAsset "BTCUSDSHORTS","ETHUSDSHORTS","XRPUSDSHORTS","EOSUSDSHORTS","LTCUSDSHORTS","BTGUSDSHORTS","ETPUSDSHORTS","IOTUSDSHORTS","ETCUSDSHORTS","ZECUSDSHORTS","NEOUSDSHORTS","XMRUSDSHORTS","ZRXUSDSHORTS","OMGUSDSHORTS","DSHUSDSHORTS","BABUSDSHORTS","BSVUSDSHORTS","SANUSDSHORTS","EDOUSDSHORTS","TRXUSDSHORTS","XLMUSDSHORTS","BATUSDSHORTS","VETUSDSHORTS","SNGUSDSHORTS"
SignalFI was created to help traders and investors to effectively analyze the market based on the Golden Mean Ratio (Fibonacci numbers), plan a trade and ultimately execute it. To help inform and educate market decisions we developed a set of Trading Indicators which are available on TradingView , the most advanced and yet easy to use charting platform available on the web.
SignalFI indicators are just that, indicators. Our indicators are generally configured to use completely historical data (negating repaint), and we advise all alerts created with SignalFI indicators to be fired upon "close" of the current candle. Our indicators can provide valuable context and visualization support when performing market analysis and executing buy and sell decisions. However. we are not financial experts, and all information presented on this site or our other media outlets are for educational purposes only.
For subscription information, visit www.signalfi.net and follow us on twitter.
[SignalFI] - FutureFI V1 [Bitfinex - All Pairs]FutureFI uses the futures (Long and Short) contracts housed on Bitfinex to provide a gauge for the relative difference and strength of interest in buying or selling Bitfinex assets based on total contracts created.
MUTLTIPLE-TIMEFRAME RSI FOR FUTURES CONTRACTS
DIFFERENCE STATISTICS COMBINED WITH RSI MOMENTUM
SIGNALS CAN BE APPLIED OUTSIDE OF BITFINEX
Supported Assets:
LongAsset "BTCUSDLONGS","ETHUSDLONGS","XRPUSDLONGS","EOSUSDLONGS","LTCUSDLONGS","BTGUSDLONGS","ETPUSDLONGS","IOTUSDLONGS","ETCUSDLONGS","ZECUSDLONGS","NEOUSDLONGS","XMRUSDLONGS","ZRXUSDLONGS","OMGUSDLONGS","DSHUSDLONGS","BABUSDLONGS","BSVUSDLONGS","SANUSDLONGS","EDOUSDLONGS","TRXUSDLONGS","XLMUSDLONGS","BATUSDLONGS","VETUSDLONGS","SNGUSDLONGS"
ShortAsset "BTCUSDSHORTS","ETHUSDSHORTS","XRPUSDSHORTS","EOSUSDSHORTS","LTCUSDSHORTS","BTGUSDSHORTS","ETPUSDSHORTS","IOTUSDSHORTS","ETCUSDSHORTS","ZECUSDSHORTS","NEOUSDSHORTS","XMRUSDSHORTS","ZRXUSDSHORTS","OMGUSDSHORTS","DSHUSDSHORTS","BABUSDSHORTS","BSVUSDSHORTS","SANUSDSHORTS","EDOUSDSHORTS","TRXUSDSHORTS","XLMUSDSHORTS","BATUSDSHORTS","VETUSDSHORTS","SNGUSDSHORTS"
SignalFI was created to help traders and investors to effectively analyze the market based on the Golden Mean Ratio (Fibonacci numbers), plan a trade and ultimately execute it. To help inform and educate market decisions we developed a set of Trading Indicators which are available on TradingView , the most advanced and yet easy to use charting platform available on the web.
SignalFI indicators are just that, indicators. Our indicators are generally configured to use completely historical data (negating repaint), and we advise all alerts created with SignalFI indicators to be fired upon "close" of the current candle. Our indicators can provide valuable context and visualization support when performing market analysis and executing buy and sell decisions. However. we are not financial experts, and all information presented on this site or our other media outlets are for educational purposes only.
For subscription information, visit www.signalfi.net and follow us on twitter: @signalfi_

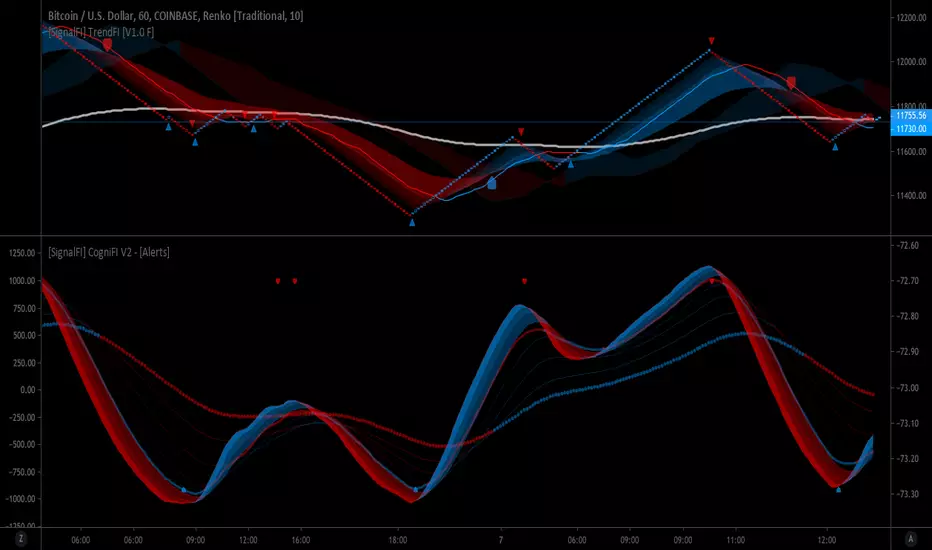
[SignalFI] CogniFI V1 - [Alerts]CogniFI uses 8 independent Fibonacci based inputs to calculate a unified Center Of Gravity (COG) and RMA or RSI based moving average created by J. Welles Wilder.
FIBONACCI BASED TREND AND MOMENTUM DISCOVERY
RSI BASED MOVING AVERAGES COMBINED WITH CENTER OF GRAVITY (COG)
COLOR BASED TREND SMOOTHING FOR INDICATOR SIGNAL
SignalFI was created to help traders and investors to effectively analyze the market based on the Golden Mean Ratio (Fibonacci numbers), plan a trade and ultimately execute it. To help inform and educate market decisions we developed a set of Trading Indicators which are available on TradingView , the most advanced and yet easy to use charting platform available on the web.
SignalFI indicators are just that, indicators. Our indicators are generally configured to use completely historical data (negating repaint), and we advise all alerts created with SignalFI indicators to be fired upon "close" of the current candle. Our indicators can provide valuable context and visualization support when performing market analysis and executing buy and sell decisions. However. we are not financial experts, and all information presented on this site or our other media outlets are for educational purposes only.
For subscription information, visit www.signalfi.net and follow us on twitter: @signalfi_