Short Selling EMA Cross (By Coinrule)BINANCE:AVAXUSDT
This short selling script works best in periods of downtrends and general bearish market conditions, with the ultimate goal to sell as the the price decreases further and buy back before a rebound.
This script can work well on coins you are planning to hodl for long-term and works especially well whilst using an automated bot that can execute your trades for you. It allows you to hedge your investment by allocating a % of your coins to trade with, whilst not risking your entire holding. This mitigates unrealised losses from hodling as it provides additional cash from the profits made. You can then choose to to hodl this cash, or use it to reinvest when the market reaches attractive buying levels.
Entry
The exponential moving average ( EMA ) 20 and EMA 50 have been used for the variables determining the entry to the short. EMAs can operate better than simple moving averages due to the additional weighting placed on the most recent data points, whereas simple moving averages weight all the data the same. This means that price is tracked more closely and the most recent volatile moves can be captured and exploited more efficiently using EMAs.
Our backtesting data revealed that the most profitable timeframe was the 30-minute timeframe, this also enabled a good frequency of trades and high profitability.
A fast (shorter term) exponential moving average , in this strategy the EMA 20, crossing under a slow (longer term) moving average, in this example the EMA 50, signals the price of an asset has started to trend to the downside, as the most recent data signals price is declining compared to earlier data. The entry acts on this principle and executes when the EMA 20 crosses under the EMA 50.
Enter Short: EMA 20 crosses under EMA 50.
Exit
This script utilises a take profit and stop loss for the exit. The take profit is set at -8% and the stop loss is set at +16% from the entry price. This would normally be a poor trade due to the risk:reward equalling 0.5. However, when looking at the backtesting data, the high profitability of the strategy (93.33%) leads to increased confidence and showcases the high probability of success according to historical data.
The take profit (-8%) and the stop loss (+16%) of the strategy are widely placed to ensure the move is captured without being stopped out due to relief rallies. The stop loss also plays a role of mitigating losses and minimising risk of being stuck in a short position once there has been a fundamental trend reversal and the market has become bullish .
Exit Short: -8% price decrease from entry price.
OR
Exit Short: +16% price increase from entry price.
Tip: Research what coins have consistent and large token unlocks / highly inflationary tokenomics, and target these during bear markets to short as they will most likely have substantial selling pressure that outweighs demand - leading to declining prices.
The strategy assumes each order is using 30% of the available coins to make the results more realistic and to simulate you only ran this strategy on 30% of your holdings. A trading fee of 0.1% is also taken into account and is aligned to the base fee applied on Binance.
The backtesting data was recorded from December 1st 2021, just as the market was beginning its downtrend. We therefore recommend analysing the market conditions prior to utilising this strategy as it operates best on weak coins during downtrends and bearish conditions.
Crypto

Price action: Double top/bottom StrategyDouble top and bottom patterns are chart patterns that occur when the underlying investment moves in a similar pattern to the letter "W" (double bottom) or "M" (double top).
In this strategy, I use Pivot High/Low to find Double top and bottom.
Entry long: when Double bottom occur.
Entry short: when Double top occur.
Risk: Reward: You can change % Stop loss and Target pfofit.

Price action: Trendline Break StrategyThis strategy use trendline to entry. Trendline be drawed from Pivots High/Low.
Entry Long: When price break up trendline.
Entry Short: When price break down trendline.
Risk:Reward setup is 1:1.
You can backtest with whichever pair and whichever timeframe.
I backtested:
- If scalping: should use timeframe 5m, set up SL, TP is 2%.
- If swing trade: should use timeframe 1H, set up SL 2%, TP is 3%.
Should use with other indicator to increase winrate.

Oversold RSI with tight SL Strategy (by Coinrule)This is one of the best strategies that can be used to get familiar with technical indicators and start to include them in your trading bot rules.
ENTRY
1. This trading system uses the RSI ( Relative Strength Index ) to anticipate good points to enter positions. RSI is a technical indicator frequently used in trading. It works by measuring the speed and change of price movements to determine whether a coin is oversold (indicating a good entry point) or overbought (indicating a point of exit/entry for a short position). The RSI oscillates between 0 and 100 and is traditionally considered overbought when over 70 and oversold when below 30.
2. To pick the right moment to buy, the strategy enters a trade when the RSI falls below 30 indicating the coin is oversold and primed for a trend reversal.
EXIT
The strategy then exits the position when the price appreciates 7% from the point of entry. The position also maintains a tight stop-loss and closes the position if the price depreciates 1% from the entry price. The idea behind this is to cut your losing trades fast and let your winners ride.
The best time frame for this strategy based on our backtesting data is the daily. Shorter time frames can also work well on certain coins, however in our experience, the daily works best. Feel free to experiment with this script and test it on a variety of your coins! With our backtesting data a trading fee of 0.1% is taken into account. The fee is aligned to the base fee applied on Binance, which is the largest cryptocurrency exchange by volume. In the example shown, this strategy made a handsome net profit of 39.31% on Chainlink with 61.54% of trades being profitable.

Sideways Strategy DMI + Bollinger Bands (by Coinrule)Markets don’t always trade in a clear direction. At a closer look, most of the time, they move sideways. Relying on trend-following strategies all the time can thus lead to repeated false signals in such conditions.
However, before you can safely trade sideways, you have to identify the most suitable market conditions.
The main features of such strategies are:
Short-term trades, with quick entries and quick exits
Slightly contrarian and mean-reversionary
Require some indicator that tells you it’s a sideways market
This Sideways DMI + Bollinger Bands strategy incorporates such features to bring you a profitable alternative when the regular trend-following systems stop working.
ENTRY
1. The trading system requires confirmation for a sideways market from the Directional Movement Index (DMI) before you can start opening any trades. For this purpose, the strategy uses the absolute difference between positive and negative DMI, which must be lower than 20.
2. To pick the right moment to buy, the strategy looks at the Bollinger Bands (BB). It enters the trade when the price crosses over the lower BB.
EXIT
The strategy then exits when the move has been exhausted. Generally, in sideways markets, the price should revert lower. The position is closed when the price crosses back down below the upper BB.
The best time frame for this strategy based on our backtest is the 1-hr. Shorter timeframes can also work well on certain coins that are more volatile and trade sideways more often. However, as expected, these exhibit larger volatility in their returns. In general, this approach suits medium timeframes. A trading fee of 0.1% is taken into account. The fee is aligned to the base fee applied on Binance, which is the largest cryptocurrency exchange.

Three EMAs Trend-following Strategy (by Coinrule)Trend-following strategies are great because they give you the peace of mind that you're trading in line with the market.
However, by definition, you're always following. That means you're always a bit later than your want to be. The main challenges such strategies face are:
Confirming that there is a trend
Following the trend, hopefully, early enough to catch the majority of the move
Hopping off the trade when it seems to have run its course
This EMA Trend-following strategy attempts to address such challenges while allowing for a dynamic stop loss.
ENTRY
The trading system requires three crossovers on the same candle to confirm that a new trend is beginning:
Price crossing over EMA 7
Price crossing over EMA 14
Price crossing over EMA 21
The first benefit of using all three crossovers is to reduce false signals. The second benefit is that you know that a strong trend is likely to develop relatively soon, with the help of the fast setup of the three EMAs.
EXIT
The strategy comes with a fixed take profit and a volatility stop, which acts as a trailing stop to adapt to the trend's strength. That helps you get out of the way as soon as market conditions change. Depending on your long-term confidence in the asset, you can edit the fixed take profit to be more conservative or aggressive.
The position is closed when:
The price increases by 4%
The price crosses below the volatility stop.
The best time frame for this strategy based on our backtest is the 4-hr. Shorter timeframes can also work well, although they exhibit larger volatility in their returns. In general, this approach suits medium timeframes. A trading fee of 0.1% is taken into account. The fee is aligned to the base fee applied on Binance, which is the largest cryptocurrency exchange.

Optimised RSI strategy for Reversals (by Coinrule)The most common way to use the RSI to spot a good buy opportunity is to check for values lower than 30. Unfortunately, the RSI can remain in oversold territory for long periods, and that could leave you trapped in a trade in loss. It would be appropriate to wait for a confirmation of the trend reversal.
In the example above I use a short-term Moving Average (in this case, the MA9) coupled with an RSI lower than 40. This combination of events is relatively rare as reversal confirmations usually come when RSI values are already higher. As unusual as this setup is, it provides buy-opportunities with much higher chances of success.
The parameters of this strategy would be:
ENTRY: RSI lower than 40 and MA9 lower than the price
TAKE PROFIT and STOP-LOSS with a ratio of at least 2. That means that if you set up a take profit of 3%, your stop-loss shouldn’t be larger than 1.5%.
The advantage of this approach is that it has a high rate of success and allows you the flexibility of setting up the percentages of the take profit and stop-loss according to your preferences and risk appetite.

Scalp 1min CryptoThis scalping strategy is designed for 1min timeframe.
It uses indicators: SuperTrend 15m ( is used to filter the trade as to open only long position or short position), Wavetrend 1min, Bollinger Band 3min, Stoch 3min to find entry.
TP: optimized value : 0.5 - 1
Stoploss: You have two choice: % or when SuperTrend reverse
If you would like use scripts, please ib to me.
You are welcom!

Crypto Correlation Strategy based on Technical Ratings This is a swing trading crypto correlation strategy, based initially on technical ratings but adapted to the entire crypto market environment , by using as a source of calculations the candle values from CRYPTOCAP:TOTAL.
So since TOTAL, is the sum of all the crypto currencies, its going to be our leader. We will get the entries and exits , internally from it and input them into the crypto coins(more than 80-90% of the usdt perpetual pairs are following the same direction but with a higher volatility), and with this in general is going to give us as much better risk/reward than just by trading 1 coin alone.
So this means that all coins will enter and exit at the same time forom a trade. With this, since sometimes we have sudden big changes in the price form one side to another, is going to break a little this effect and since the initial movements were bigger, it would make us lose less. At the same time it can also make us lose more if the changes happen to soon.
One of the things of this particular idea is we dont have to worry about particular optimizations for each asset/coin.
This scenario has been adapted for 30min timeframe, using 0.1% comission per entry and 0.1% comission for exit from the trade.
I have tested so far with most USDT Perpetual Pairs from binance, and it seems to give good results with most of the pairs.
If you have any question please let me know !

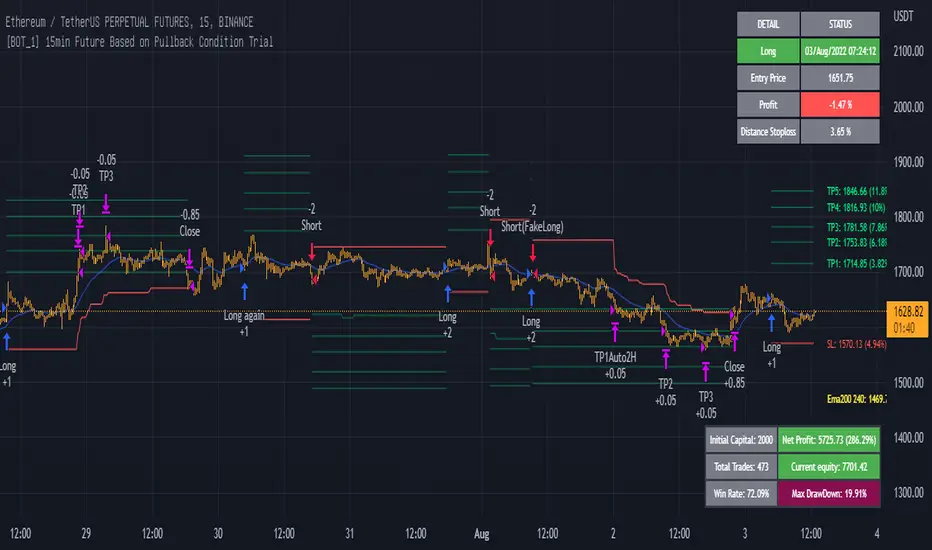
15min ETH Binance Future Full for auto tradingThe strategy is optimized for ETHBUSDPERP or ETHUSDTPERP pairs on Binance Future. With other altcoins, you need change set up of indicators.
This is a swing strategy to follow the trend on the 15m frame, use the pullback condition in the smaller timeframe to enter the trade.
Entry long: price close above ema10 and ema30, macd(12,26,9) (tf1m) < macd(12,26,9) (tf1m) and rsi < 80 (not overbought) and parabol sar is below price
Exit long: price hit TP1, TP2, ... or touch stoploss or have entry short signal
Entry short: price close below ema10 and ema30, macd(12,26,9) (tf1m) > macd(12,26,9) (tf1m) and rsi > 20 (not oversold) and parabol sar is aboce price
Exit short: price hit TP1, TP2, ... or touch stoploss or have entry long signal
In addition, the strategy also has profit risk management feature: move stoploss to entry and take multiprofit, plot resistant in higher timeframe 1D, 4H for activing take profit.
If you find any helpful for your trading and need scripts, please inbox to me.
You are welcom!
Scalping The Bull - Two EMA StrategyName: Scalping The Bull - Two EMA "Gianno-Nano" Strategy from the Meeting
Category: Trend Follower
Operating mode: Spot or Future, only long or swing trading
Trades duration: Multiday
Timeframe: 4H
Suggested usage: Mid-term trading, when the market is in trend and it is showing high volatility.
Entry: When fast EMA crosses over slow EMA.
Exit: When fast EMA crosses under slow EMA then Exit Long or Entry Short (for reversal strategy).
Usage:
⁃ It can be useful to use alerts or web-hooks to automate this strategy.
⁃ This is a raw system that can be improved in different ways (e.g. Stop-loss, take-profit, position sizing) or studying more the behaviour of the coin.
Configuration:
- N/A
Backtesting
⁃ Exchange: BINANCE
⁃ Pair: NEOUSDT
⁃ Timeframe: 4H
⁃ Fee 0.075%
⁃ Slippage 0
- Start : 2017-12-03
How you or we can improve? Source code is open so share your ideas!

Oversold RSI with Tight Stop-Loss Strategy (by Coinrule)KRAKEN:LINKUSD
This is one of the best strategies that can be used to get familiar with technical indicators and start to include them in your rules on Coinrule .
ENTRY
1. This trading system uses the RSI (Relative Strength Index) to anticipate good points to enter positions. RSI is a technical indicator frequently used in trading. It works by measuring the speed and change of price movements to determine whether a coin is oversold (indicating a good entry point) or overbought (indicating a point of exit/entry for a short position). The RSI oscillates between 0 and 100 and is traditionally considered overbought when over 70 and oversold when below 30.
2. To pick the right moment to buy, the strategy enters a trade when the RSI falls below 30 indicating the coin is oversold and primed for a trend reversal.
EXIT
The strategy then exits the position when the price appreciates 7% from the point of entry. The position also maintains a tight stop-loss and closes the position if the price depreciates 1% from the entry price. The idea behind this is to cut your losing trades fast and let your winners ride.
The best time frame for this strategy based on our back testing data is the daily. Shorter time frames can also work well on certain coins, however in our experience, the daily works best. Feel free to experiment with this script and test it on a variety of your coins! With our back testing data a trading fee of 0.1% is taken into account. The fee is aligned to the base fee applied on Binance, which is the largest cryptocurrency exchange by volume. In the example shown, this strategy made a handsome net profit of 52.6% on Chainlink with 66.67% of trades being profitable.
You can execute this strategy on your favorite exchanges with Coinrule .

Hulk Strategy x35 Leverage 5m chart w/Alerts This strategy is a pullback strategy that utilizes 2 EMAs as a way of identifying trend, MACD as an entry signal, and RSI and ADX to filter bad trades. By using the confirmation of all of these indicators the strategy attempts to catch pullbacks, and it is optimized to wait for high probability setups. Take not that the strategy is optimized for use on BTCUSDT along with 35 times leverage(Using leverage is risky). The Hulk Strategy waits for strong trend confirmation and then attempts to identify pullbacks using MACD and RSI. By using these it identifies strong short term movement against the trend(hence the name Hulk). To use the strategy wait for the strategy to make an entry, and then enter with a stop loss of 1.1% and a take profit of 1.35% with respect to if it is a long or short position. The trade frequency of this strategy is high as it is made for use on the 5m timeframe. But this does not mean you will have to be staring at your computer constantly as an average of 1 trade takes place each day. This will vary a lot though, somedays the strategy enters up to 4 times. I wish you good trading and hope that you like this strategy!
P.S. The indicators on my chart are visualizations of the indicators used in the strategy, they are not necessary for the strategy to work though. Also the colored in cloud on the price chart is an EMA cloud and it comes with the strategy when you add it to your chart. This EMA cloud consists of two EMAs a 50 and a 200 EMA.

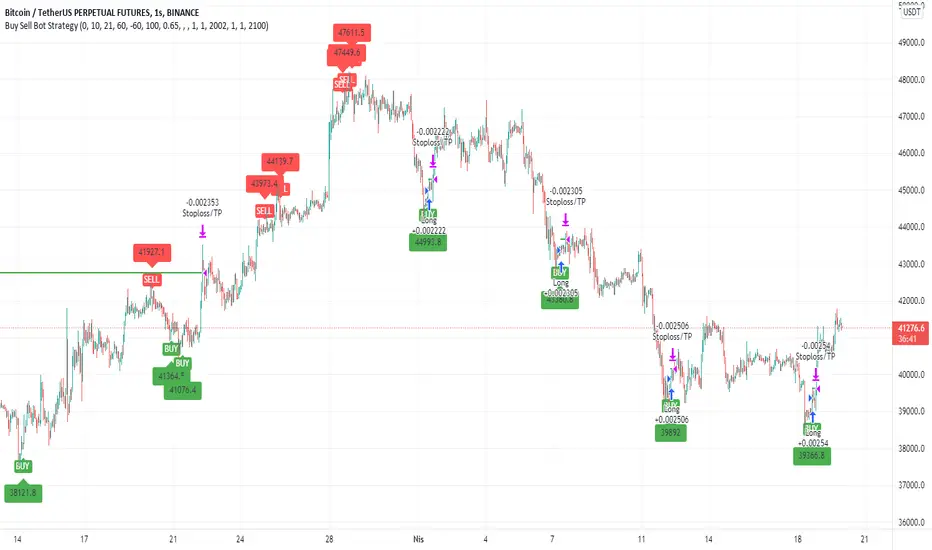
Buy Sell Bot StrategyHello Everyone,
In this strategy, I benefited from the values of RSI and wave trend indicators, which are the oldest and most used indicators in the market. I contributed to this bi-valued indicator myself with a bivariate formula. My variables are actually a simple intersection algorithm, the intersection of the wave trend indicator and the RSI indicators when they are oversold or overbought.
As you all know, we can send signals to bot sites via tradingview. You can use bot signals boxes in this strategy. You can analyze past transactions in the Date settings section. In the indicator settings section, you can change the settings of the overbought and oversold zones. Perhaps the most important feature here is the USE SELL SIGNALS section. I would like to emphasize this section in particular that when you mark the use sell signal section, the strategy will be processed in the buy section and will not be processed in the sell section. If you do not click on the USE SELL SIGNALS section, the strategy will be processed in the buy section, but this time it will be exited when the target in the take profit section is reached. THIS WAS IMPORTANT.
There is another important point here. Always in position and USE SELL SIGNALS sections do not work together. Run these two features one by one. It is a strategy that is constantly in operation through the name of the Always in position feature, I do not recommend it. The USE PERCENTAGE DECREASE feature, on the other hand, is the section where we want the share to drop as a percentage to enter the second trade after the first purchase is made in the settings section if you activate the pyramiding feature. You can use the tradingview help page for the pyramiding feature.
I found this strategy suitable to use in the 1-hour time frame in the crypto market and adjusted it that way. Of course, you can use it by changing the settings in stocks and in different time periods. big wins
SuperTrend Multiple Risk Management SystemThis is an improved SuperTrend strategy that makes use of multiple types of risk management options.
We have for example :
1. Take profit and stop loss levels based on support and resistence created with RSI and Pivot Lines(dynamic)
For example, if we have an oversold level and a pivot low , we can take that low point for support.(or resistence for short)
If instead we have an overbought level and a pivot high, we can take that high point for resistence.(orsupport for short)
2. Take profit and stop loss levels based on swing low and swing high points calculated with highest high and lowest low function(dynamic)
For example we take the lowest point in the last 100 candles. We calculate the distance from the current point to that one, and we apply this value as a take profit point. Same for stop loss
3. Take profit and stop loss levels based on % movements(fixed)
For example we have a tp or sl of 10%. If either of them make a movement of 10% from the entry point, they will get triggered.
4. Break even stop loss once the asset moves certain % in our direction.
For example we have a long breakeven of 5%. If the asset moves 5% in our direction, we move the stop loss on the entry point so if the trade pullback and crosses with this point it will exit from the trade.
Notes:
All the exits from the strategy are happening at the end of the candle close, since we are checking if inside the current candle we cross with either high or low of the candles parts the set prices from any of the above options.
At the same time we can combine multiple of them into one, and we can either exit based on which one was hit first, or use a quantity reduction of the trade and exit multiple times when we hit any of the levels.
This tool is for educational purpose only.
Its main purpose is to show the difference between having a risk management or without.
For example on this scenario of BTC USD 4h, I found out that the drawdawn was reduced by more than half when using different type of risk management, compared to not use one at all, while at the same time increasing the profits by a huge margin.

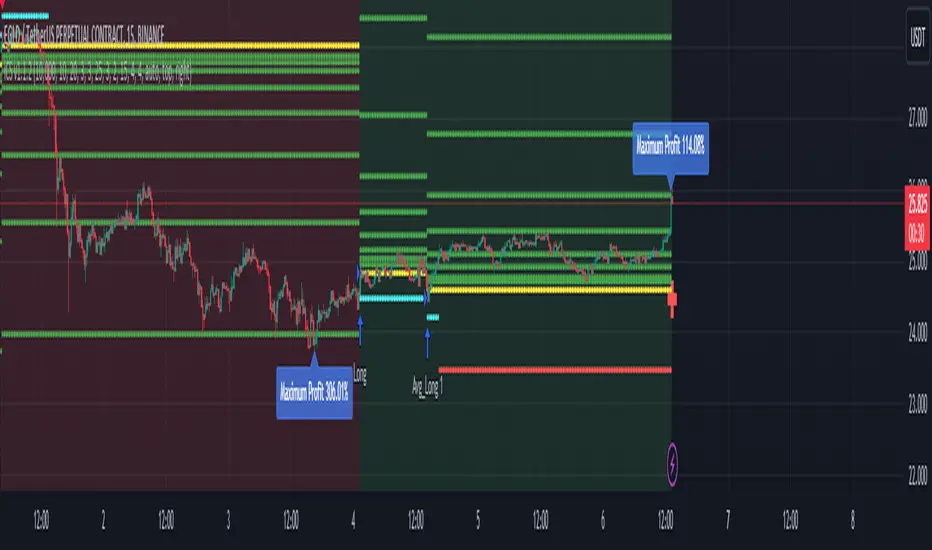
iCryptoScalperHi everyone!
In this post I would like to present my personal indicator for short-term strategies on cryptocurrencies called iCryptoScalper , but let me first introduce myself:
I am a theoretical physicist with a deep passion for trading and mathematical modelling of the financial markets.
I started trading cryptocurrencies more than 4 years ago and, throughout this period, I got more and more involved in trying to describe the mechanisms governing
the price action at lower timeframes like 1, 5 and 15 minutes.
As a beginner, I started with the usual "buy and hold" strategy, the safest but also boring option. Afterthat, I tried to get more involved on speed trading
and scalping and, as it happens to all the beginners, I went through many mistakes.
At the beginning, trying to find the best scalping strategy, was a very difficult task and I barely managed to perform well, mostly because every trade were overwhelmed
by my emotional approach and the fear of missing the right entry point and/or exit point. However, thanks to these difficulties, I understood that I needed
an algorithmic procedure to improve my performances and overtake the emotional approach, with a more technical approach: a mathematical guide that precisely tells me how to behave in the best way possible to be profitable.
To achieve this goal, I put all my efforts in trying to write a consistent mathematical model able to give me all the statistical informations I needed to reach
the best performances and, of course, the best possible profits.
The iCryptoScalper is an explicit mathematical tool to be used for scalping strategies and optimized for different cryptocurrency pairs on 15/30 min timeframes.
The script gives you many useful informations and details regarding the current and subsequent trade, accompanied with a detailed overview on both the last 20 short
and long trade results.
Let us have a look to all the detailed informations the script shows to you:
CHART
- Lines: The script plots for you the Entry price (yellow line), the Stop Loss price (red line) and a series of 8 Take Profit levels (green lines).
- Background: The green background color indicates that the script is in a long position, viceversa, the red background color indicates that the script is in a short position.
- Labels: The blue labels indicate the maximum achieved profit for each trade.
- Alerts: The script shows two types of alerts, the "prepare to #" one and the true entry one. The prepare alert is very useful to understand when the strategy is going
to enter a specific trade, thus giving you the possibility to set up all the necessary Entry/SL/TP levels on your favorite trading platform.
- Crosses: The green and red crosses are precisely located at the corresponding long and short entry price for the next trade, thus giving you a preview on the target price
that has to be reached for the indicator to enter. They are computed thanks to a mathematical model I set up and optimized for each cryptocurrency pair.
PANEL
- Overview: This part shows you two probability tables for the last 20 long and short trades each. The first table indicates the set of probabilities of reaching the corresponding TP level, whereas the second table shows the conditional probability , namely the probability of reaching a certain profit level once the previous one has been achieved.
Below the tables you can find three quantities again referring to the last 20 long and short trades: the Average Maximum Profit , the Average Maximum Drawdown and the Average Risk/Reward Ratio .
Last but not least, the correlation between the current asset and BTC is displayed together with the current BTC status.
- Active Trade: This part collects all the data related to the current trade status.
- Next Trade: This part collects all the data related to the next trade status.
ATTENTION!
Please notice that the equity line you see in the "Strategy Tester" section of TradingView is unreliable compared to the real performances of the script. This is due to the
fact that the TradingView engine is designed for backtesting automatic trading strategies and not real-time trading bots.
An example is the following: Bob buys 1 BTC-PERP contract at 10000$, setting the Stop Loss at 9000$. The price of the perpetual then goes to 12000$ and then go back hitting the Stop Loss. For the TradingView Engine this is a
trade with a permanent loss of 1000$. However, for the iCryptoScalper users, the trade is perfectly fine thanks to the numerous TP levels (and corresponding probabilities) given by the script within the trade window.
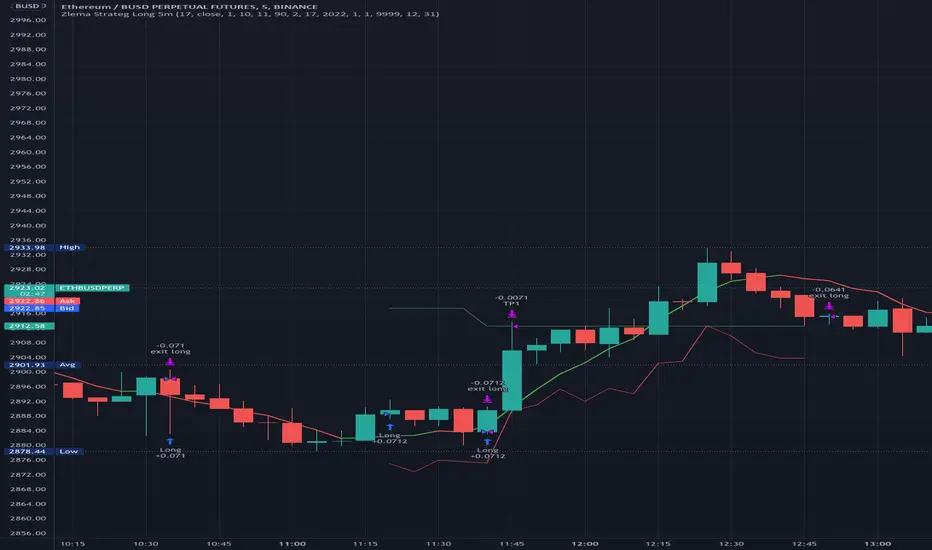
Zlema Strateg Long 5mJust putting this out there.
I created this Strategy based on Everget Zlema.
Opens long trade when Zlema changes color.
It is profitable as it is, but just putting it out to the community to see if someone else has ideas to make it better.
How to make this strategy better?
1. FInd a way to filter ranging bad trades.
2. Trades would be more profitable if entry point had an entry on the candle the zlema changes color.
3. I had to put TP 5 limit, but the optimal would be when the zlema changes color back to red (if ranging trades can we filtered that is).
In any case, just putting it out there, hope it is useful for someone, and I am open to suggestions.
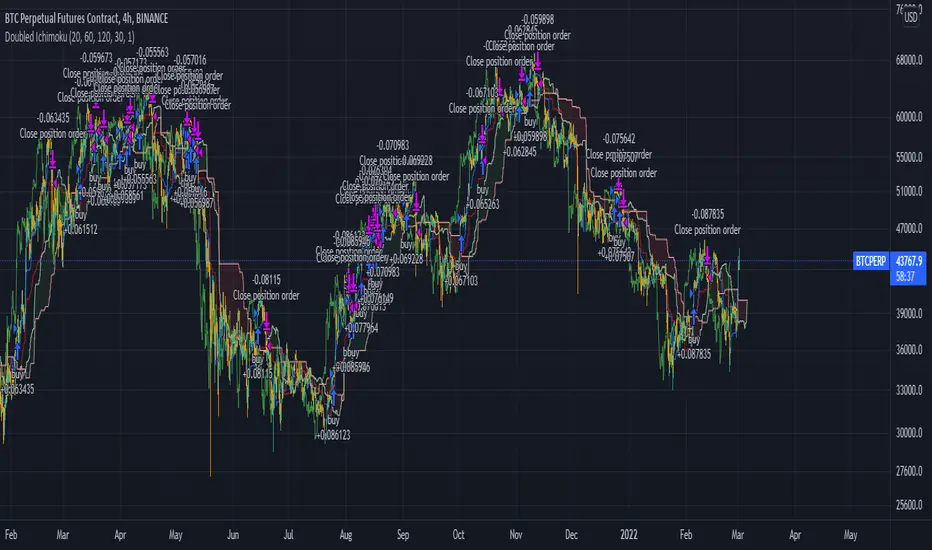
Ichimoku 4H crypto strategy -- LONG ONLYThis is a LONG ONLY strategy for 4h timeframe of any Cryptocurrency/USD pairs. The strategy opens only 1 position at a time with the following conditions.
Open Long Position when:
1. Closed price above cloud AND
2. Green cloud ahead AND
3. Conversion line above Baseline AND
4. Lagging span above cloud and price action AND
Close trade when:
1. Lagging span gets below price action or cloud OR
2. Price gets inside the cloud OR
3. Price gets below baseline
You can use it on a lower timeframe at YOUR OWN RISK. My optimal timeframe is 4 Hour candles.
Cheers.
Crypto Spot Market Bot | BacktestHello Friends.
This script is only for long positions.
How does the algorithm work ?
The Relative Momentum Index
Relative Strength İndex
Average Directional Movement İndex
Momentum
When rsi and adx produce signals in the same direction, the rmi indicator confirms the signal. After the Confirmed Signal, the buy-side transaction is entered , the closed according to the % of profit taking and stoploss specified on the algorithm in the entered transaction.
In the spot market, it is possible to make money even in a down trend
All shared charts run within a 1-hour time frame.
Note : The shared backtest results have been shared as of 9/9/2021 by calculating 50% balance and 2 pyramiding methods in an account of 1000 dollars. Keep in mind that this algorithm will want to try to average down in possible worst-case scenarios. 2% - %3take profit levels will provide consecutive gains in the spot market.
How should the adjustments be made?
Value variables should be made according to formula a and formula b values and backtest results. You can increase the frequency of transactions by lowering the adx and rsi values.
Overview :

ms hypersupertrendThis is a well-known strategy by using 3 different Supertrends and a trend-defining EMA,
feel free to play around with the settings, a backtest on 8h ETHUSDT pair brought some good results using
the 233EMA and investing 75% of a 10k start capital
the idea is to have at least 2 super trends going green above the trend-EMA to go long and exit by turning
2 super trends red (idea: 1 super trend in red could initialize a take profit)
shorts work vice versa
The EMA shows in green for uptrends and in red for downtrends, if it is blue no Signal will be taken because
the 3 super trends are not all above or below the trendline(EMA)
//-------------------------------------------------------------------------------------------------------------------------------------------------
Update 1:
- Fixed a minor input error
- Added ATR stoploss, and commented out the percentage stop loss
- Added time window to backtest
- Added exit on risk/reward is met
- This version is only buy...wait for next update adding shorts and more
As always, thanks for your ideas, likes, and support. Feel free to mess around with the settings and give me your feedback.

Contrarian Scalping Counter Trend Bb Envelope Adx and StochasticContrarian Scalping is an trading strategy designed to take advanted of a counter-trend.
The advantage of these strrategies types is that they have a good profitability but with do not great gain (in relation at the time frame).
Indicators used:
Bollinger
Envelope
ADX
Stochastic
Rules for entry
For short: close of the price is above upper band from bb and envelope, adx is below 30 and stochastic is above 50
For long: close of the price is below lower band from bb and envelope, adx is below 30 and stochastic is below 50
Rules for exit
For short: either close of the candle is below lower band of bb or enveloper or stochastic is below 50
For long: either close o the candle is above upper band of bb or envelope or stochastic is above 50
If there are any questions let me know !

RSI Average Swing BotThis is a modified RSI version using as a source a big length(50 candles) and an average of all types of sources for candle calculations such as ohlc4, close, high, open, hlc3 and hl2.
In this case we are going to use a 0-1 scale for an easier calculation, where 0.5 is going to be our middle point.
Above 0.5 we consider a bullish possibility.
Below 0.5 we consider a bearish possibility.
I made a small example bot using that initial logic, together with 2 exit points for long or short positions.
If there are any questions, let me know !

Premium ScalperThe strategy works with a combination of a number of different factors, including:
- Volume
- Moving averages
- Volatility
- RSI
This strategy generates long and short signals based on volume movements, moving averages and RSI. By combining other algorithms, low volatility periods can be filtered out.
The best results can be achieved by pairing the indicator with a bot through 3Commas and using a diversification strategy. This way you spread your risk over different pairs and you therefore also have a great chance of taking big moves.
The strategy results we display are results WITHOUT leverage. It is therefore also possible to only long on spot with this strategy, but for optimal results a trading bot link is required.
The settings we have used for these results are an order size of 100% with a 0.08% commission size.
Side note: This indicator does NOT use repainting!
We offer the possibility to try the indicator for free for 7 days.
