ICHIMOKU Crypto Swing AlertThis is a crypto swing alert for the strategy with the same name designed for timeframes bigger than 1h.
The main components are
ICHOMOKU
KDJ
Average High
Average Low
Rules for entry
For long: we have the ichimoku crosses between tenkan and baselines, we have a rising kdj line and at the same time we have a increase in the average high
For short: we have the ichimoku crosses between tenkan and baselines, we have a falling kdj line and at the same time we have an increase in the average low
Rules for exit
We exit when we have inverse conditions than the initial ones used for entry.
Caution
This strategy does not use a risk management, so be careful with it !
If you have any questions let me know !
D-ETH

[DS]Bitcoin BTC ETH and others cryptos==DESCRIPTION - English version
The purpose of this script is to show information on graph that can help your decision to buy and sell cryptos.
The script is indicated for Position Trade (Long Term - Holder) and Swing Trade (Medium term).
Position Trade it is recommended to use the Weekly (W) and Daily (D) charts, Swing trade to use the 4H and 2H charts.
It is not advisable to use this indicator with graphic time frame less than 2 hours because the noise levels of information are very high.
An alert function has been inserted in the indicator and to activate this function you will need configure it in the Tradingview.
This alert will indicate the likely points of entry and exit of the asset.
**DESCRIÇÃO - Versão em Português
A proposta deste script é mostrar no gráfico informações que possam auxiliar a sua decisão de compra e venda de cryptos.
Este script é indicado para negociação Position Trade (Longo Prazo - Holders) e Swing Trade (Médio prazo).
Para Position Trade (Holders) é indicado utilizar os gráficos Semanal (W) e Diário (D), para Swing trade utilizar os gráficos 4H e 2H.
Não é aconselhável utilizar este indicador com tempos gráficos menores que 2hs pois os níveis de ruídos nas informação são muito altos.
Foi inserido no indicador uma função de alerta e para ativar esta função, você precisará configurá-la no seu Tradingview.
Este alerta irá indicar os provaveis pontos de entrada e saída do ativo.
====================================================================================================
** English Version
====================================================================================================
█ SETUP applied to Indicator
The setup is based on the average 8, 21 and 56 of the weekly chart (taught on youtube channel: Augusto Backes)
Price above the average 8 on the weekly, indicates that the market is UP trend, below the average 8 on the weekly that the market is DOWN trend
RSI greater than 60% the market is UP trend
RSI greater than 40% and lower 60% the market is in ACCUMULATION
RSI less than 40% the market DOWN trend
The weekly average 8 is represented in GREEN (Upward Trend) and RED (Downward Trend).
The weekly average 21 is represented in LIGHT ORANGE
The weekly average 56 is represented in LIGHT PURPLE
The crossing of weekly averages 8 and 21 is represented with a GREEN (HIGH trend) and RED (LOW trend) cross - this signal is disabled on the graph but you can enable it by clicking on the graph setup
█ FUNCTION USE
(1) Average 8, 21 and 56 on Weekly - show the average 8, 21, 56 weekly on graphic (Average 8 in color red and green, 21 - light orange, 56 light purple)
(2) Crossing of averages 8 and 21 Weekly - is not active but you can activate
(3) Calculation of RSI
(4) barcolor() - mark the candles with the green color (High market) and red color (Dow market)
(5) alertcondition() - you can active this alert on Tadingview
█ BUY AND SELL POINTS - likely points
The indication of the BUY position is shown by a green arrow pointing upwards and the sell position by a red arrow pointing downwards. Buy and sell indications are obtained from the divergence in the market trend.
█ THANK TO
PineCoders for everything they do, all the tools and help they provide, and their involvement in making a better community. All PineCoders, Pine Pros and Pine Wizards, people who share their work and knowledge because of it and helping others, I am so happy and so grateful.
█ NOTE
This indicator is not a buy and sell recommendation, it indicates the most likely buy and sell points. Every purchase and sale decision is your responsibility
*****************************************************************************************************
** Versão em Português
*****************************************************************************************************
█ SETUP aplicado no Indicador
O setup está baseado na média 8, 21, e 56 do gráfico semanal
Preço acima da média 8 no semanal indica que o mercado esta em tendência de ALTA, abaixo da média 8 no semanal que o mercado está em tendência de BAIXA
RSI maior que 60% o mercado está em ALTA
RSI maior que 40% e menor 60% o mercado está em ACUMULAÇÃO
RSI menor que 40% o mercado está em BAIXA
A média 8 semanal está representadas nas cores VERDE (Tendência de Alta) e VERMELHA (Tendência de Baixa).
A média 21 semanal está representada na cor laranja claro
A média 56 semanal está representada na cor roxa claro
O cruzamento das médias 8 e 21 semanal esta representado com uma cruz VERDE (Tendência de ALTA) e VERMELHA (Tendência de BAIXA) - este sinal esta desativado no gráfico mas você pode ativá-lo clicando no setup do gráfico
█ FUNÇÕES UTILIZADAS
(1) Média 8, 21 e 56 no Semanal - mostra a média 8, 21, e 56 no gráfico
(2) Cruzamento das médias 8 e 21 Semanal - não está ativo mas você pode ativá-lo
(3) Cálculo do RSI
(4) barcolor() - marca a vela (Candle) com a cor verde (Mercado em Alta) e a cor vermelha (Mercado em Baixa)
(5) alertcondition () - você pode ativar o alerta no Tradingview
█ PONTOS DE COMPRA E VENDA - prováveis pontos
A indicação da posição de COMPRA é apresentada por uma seta na cor verde apontada para cima e a posição de VENDA por uma seta na cor vermelha apontada para baixo. As indicações de compra e venda são obtidas a partir da divergência na tendência do mercado.
█ OBRIGADO PARA
PineCoders por tudo o que fazem, todas as ferramentas e ajuda que fornecem, e seu envolvimento em fazer uma comunidade melhor. Todos os PineCoders, Pine Pros e Pine Wizards, pessoas que compartilham seu trabalho e conhecimento por causa dele e ajudando os outros, estou muito feliz e muito grato.
█ NOTA
Este indicador não é uma recomendação de compra e venda ele indica os pontos mais prováveis de compra e venda. Toda decisão de compra e venda é de sua responsabilidade

3x EMA fast, 3 x MA slow + BB + PsarThis is a trend system which combines multiple fast EMA + mulitple slower SMA together with bollinger band channel and PSAR.
For entry rules the ones that I use are:
Long
We are inside BB channel, psar is ascending, and our close is above all moving averages or below all EMA'S + 1 SMA
WE can exit either when our close is below all EMA's or when PSAR is descending or when we hit upper/lower BB levels
Short
We are inside BB channel, psar is descnending, and our close is below all moving averages or below all EMA's + 1 SMA
WE can exit either when our close is above all EMA's or when PSAR is ascending or when we hit upper/lower BB levels
If you have any questions, let me know

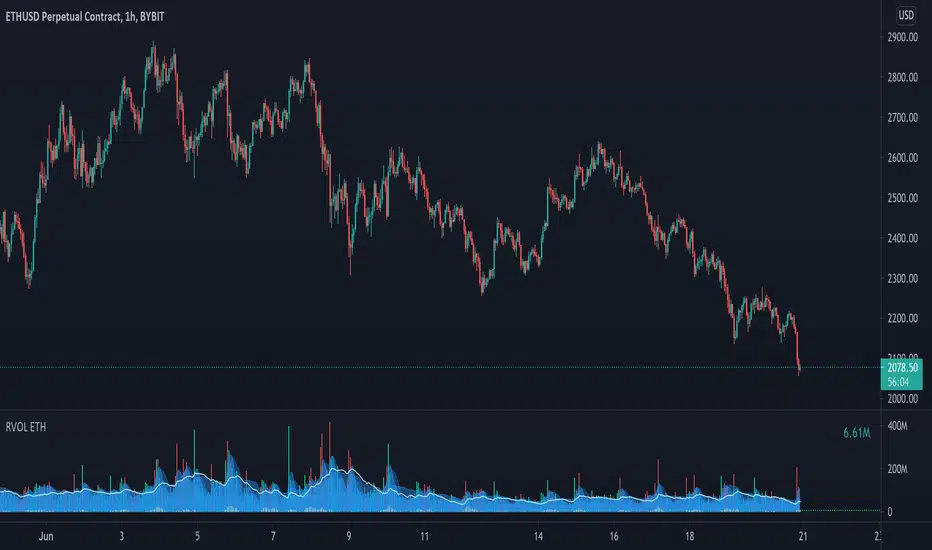
Relative Volume - ETHEREUMRelative Volume indicator that pulls data from 9 different Ethereum exchanges. Please note that this indicator only works with ETH and will not use data from your current chart.
Includes the following exchanges:
BYBIT:ETHUSD
BITFINEX:ETHUSD
BITSTAMP:ETHUSD
INDEX:ETHUSD
COINBASE:ETHUSD
FTX:ETHUSD
PHEMEX:ETHUSD
BITTREX:ETHUSD
POLONIEX:ETHUSDT
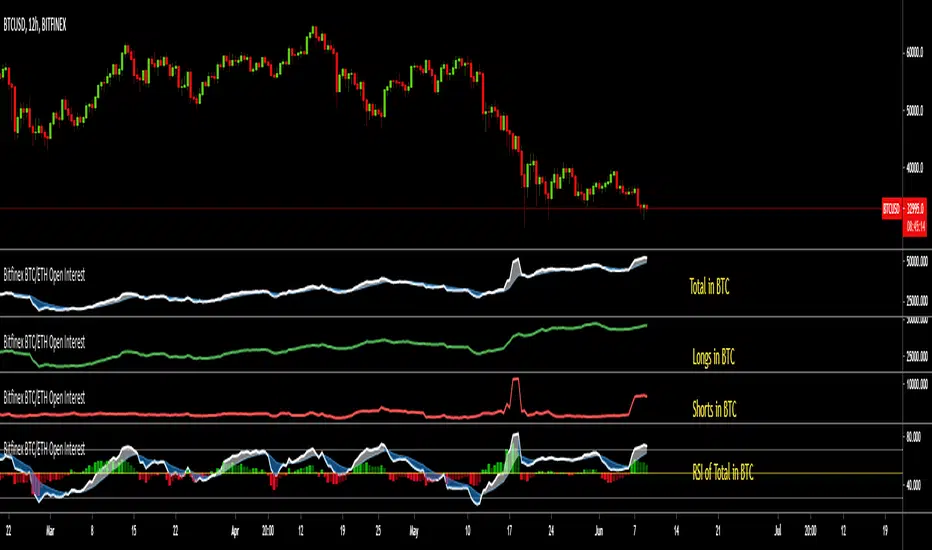
Bitfinex BTC/ETH Open InterestThe Bitfinex Exchange is providing the Open Long and Short positions as data feeds in Tradingview. This information can be valuable in order to judge how the big players are positioned.
This indicator allows to analyze this Bitfinex Open Interest data for BTC and ETH. By default it shows the Total Open Interest (Longs + Shorts) in BTC. A 10 period EMA is applied to the data.
The following alternative displays are available:
- Show ETH instead of BTC
- Show Long positions separately
- Show Short Positions separately
- Show the results in USD (Number of coins multiplied by period closing price)
- Show RSI instead of absolute value (see below)
Instead of displaying the absolute value, it is possible to show the RSI (current default length is 20) to make the changes easier visible. If RSI display is selected, then the Overbought, Oversold and Middle Line are shown automatically. Additionally a histogram is displayed which shows the difference between the RSI and the EMA of the RSI.
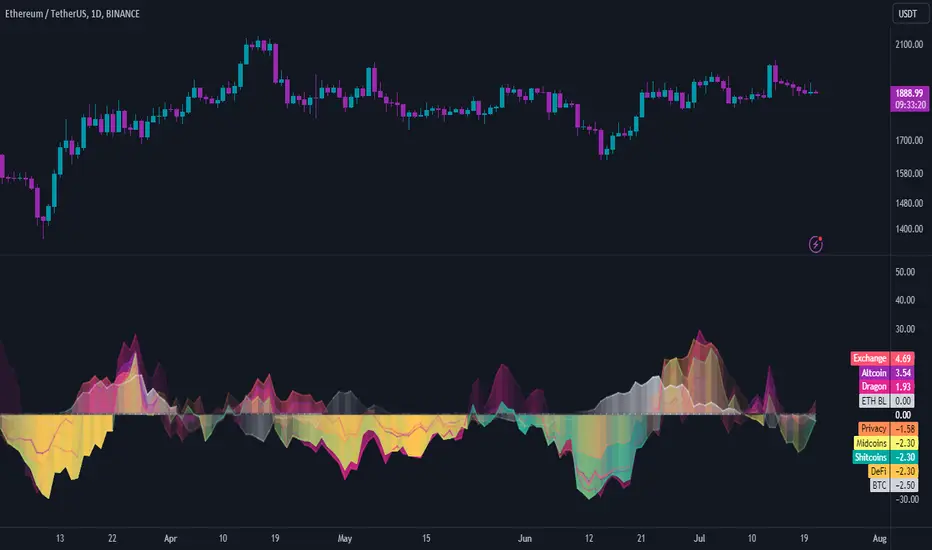
INDICES against BTC & ETHThe idea is the following; you can easily chart the FTX perp indices against (currently) two baselines, ETH & BTC.
I always choose ETH since it is way harder to outperform ETH at the moment. Doing this helps me see certain trends and/or fractal that might happen again in the future.
Since I already made D.A.M (Defi against Majors / Pricing Defi categories against BTC & ETH: ) I came across the idea of doing the same thing but with the perp indices that FTX offer. At first, I wanted to add this to D.A.M but it has no place in this indicator since this will not only look at Defi but the macro market as a whole.
The indicator currently only looks at the following indexes (weighting can be found here: https:// help. ftx. com/hc/en-us/articles/360027668812-Index-Calculation) :
DRGN: THE DRAGON INDEX
ARPA, BTM, IOST, NEO, NULS, ONT, QTUM, TRX, VET
ALT: ALTCOIN INDEX
BCH, BNB, EOS, ETH, LTC, XRP, TRX, DOT, LINK, ADA
MID: THE MID CAP INDEX
ALGO, ATOM, BAT, CRO, DASH, DCR, DOGE, HT, IOTA, LEO, NEO, OKB, ONT, QTUM, VET, XEM, XLM, XMR, XTZ, ZEC, ZRX, OMG, COMP, BSV, FTT, YFI, UNI, SNX, MKR, AAVE
SHIT: THE SHITCOIN INDEX
AE, AION, ARDR, ARPA, BCD, BEAM, BTG, BTM, BTS, BTT, CHZ, CKB, DGB, ELF, ENJ, GNT, GRIN, GT, HBAR, HC, ICX, IOST, KMD, KNC, LAMB, LRC, LSK, MANA, MATIC, MCO, NANO, NULS, OMG, POWR, PUNDIX, REN, REP, RVN, SC, SNT, STEEM, THETA, TOMO, VSYS, WAVES, XVG, XZC, ZEN, ZIL, ZRX
PRIV: THE PRIVACY INDEX
BEAM, DCR, GRIN, KMD, XMR, XVG, XZC, ZEC, ZEN
DEFI: THE DECENTRALIZED FINANCE INDEX
KNC, MKR, ZRX, REN, REP, SNX, COMP, TOMO, RUNE, CRV, DOT, LINK, MTA, SOL, CREAM, BAND, SRM, SUSHI, SWRV, AVAX, YFI, UNI, WNXM, AAVE, BAL
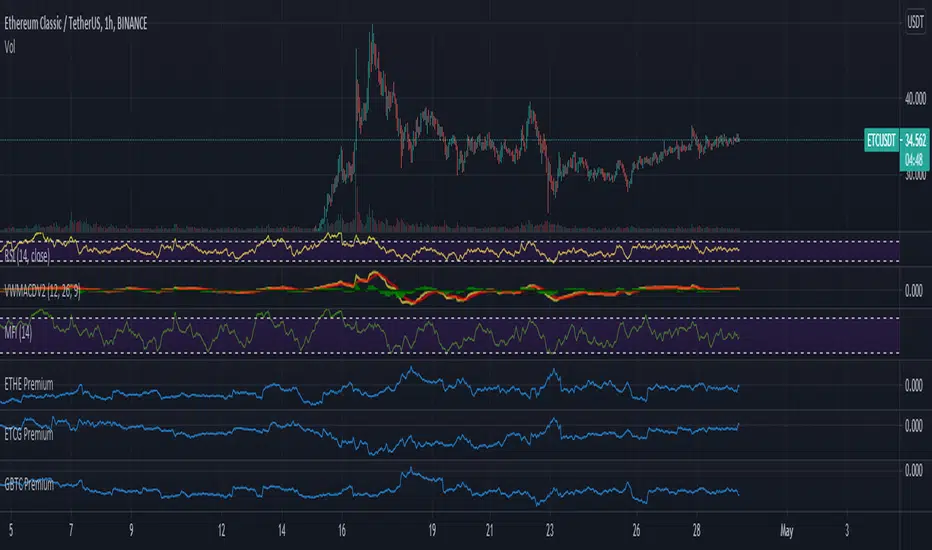
ETHE PremiumThis script simply shows the premium (when positive) and discount (when negative) associated with ETHE as compared with its estimated NAV based on ETH underlying holdings. This will of course need to be updated frequently for accuracy, but it serves as a rough estimate for educational purposes.
Price DEFI Categories against BTC & ETH/* Work in progress. The indicator is not finished. *\
The indicator shows the pricing of 3 DEFI categories against 2 possible baselines, BTC and ETH.
To do:
* Make a simple array in the source code to enter and remove new projects to the category. -> Maybe can also make it so that the source code does not have to be altered (projects can be added through input etc.)
* Adjust weightings depending on project data but this is not as important since weightings are being priced in by the market.
* Try to find a way to update input to string instead of booleans. As of currently, I could not seem to use input strings into plot functions because of an error.
* and more. Leave some feedback, that would be highly appreciated!

Bitfinex Spot PremiumOverview
A tool to display the spot price premium of Bitfinex coins vs the other big 3 exchanges.
Premium is calculated against:
- Coinbase
- Binance
- FTX
The average is calculated through volume weighting. The absolute difference between the Bitfinex spot price and the calculated average is then displayed on the histogram.
Interacting with the tool
Colours: Green bars indicate a positive premium (Bitfinex spot price is greater than the average), Red bars indicate a negative premium. The ability to grey out smaller premiums is also enabled with the "Grey Small Vals" checkbox, this can be used to further emphasise larger premiums.
Ticker: The ticker input allows you to detect the Bitfinex premium for any coin traded within all 4 exchanges (Bitfinex, Coinbase, Binance, FTX). Just input the coins ticker symbol, for example, "BTC", "ETH", "UNI".
Indicator Ideology
Bitfinex is known for being the home of crypto "smart money". Therefore, positive premiums indicate stronger buying from "smart money". Although this premium is a good sign of bullish/ bearish market conditions, for example, consecutive days of a negative Bitfinex premium have been pretty good at indicating short term tops in BTC, this indicator should only be used as a confirmation signal.

Korea PremiumA simple indicator based on the percentage price difference between Korean crypto markets and western markets.
It currently shows the premium for BTC & ETH.
If it's positive (red) it means that the Korean market is trading at a premium.
Vice versa negative (blue) means the West is trading at a premium.
Because the Korean crypto market is so closed off (because of regulations) the premium sometimes gets really wild.
The Korean average is based on Bithumb & Korbit prices.
The index made for the west is based on Coinbase, Kraken and Bitstamp.
By default it uses closing prices for the calculation but you can change that.
You can also change the timeframe in the settings although it's probably best that you keep it at "same as chart".
It's free so you can just add it to your favourites and start using it.

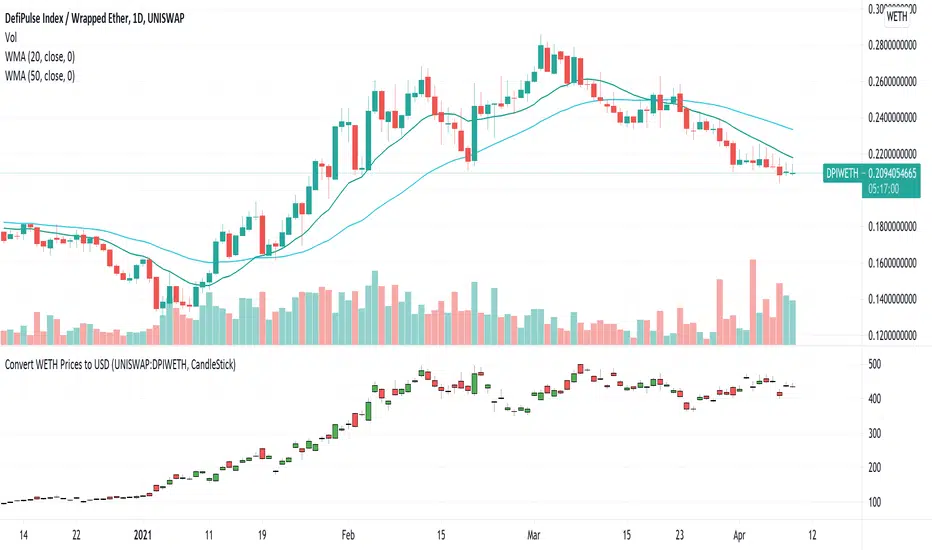
USD Prices for Uniswap Token/WETHUniswap instrument prices are in WETH. This indicator translates the series to USD prices and plots the series as candles or as a line. Data is translated by using corresponding series data for ETHUSD. The reference ETHUSD price is from Coinbase.
Any token listed as a ETH/WETH pair could be specified as an input parameter. The default instrument value is set to UNISWAP: DPIWETH, an index created by indexcoop and tracking the DEFI basket.
The script is simple and easy to understand. It allows for quick conversion and comparisons and something we had to do in a custom way prior to this script. The crypto and DEFI community would benefit from it immensely. There is even a feature request for something like this on the tradingview subreddit.
Full CRYPTO pack macd, rsi, obv, ema alert versionThis is the indicator version of a simple, yet very efficient crypto strategy, adapted to 4h time frame, on big coins like ETH and BTC . However it can be adapted to other markets, timeframes etc
For this strategy I use a combination of a trend line , an oscillator, price action and volume .
This study has alert for both long and short entries/exit.
The rules are the next ones:
Long : we check that current candle is ascending and above the moving average, the macd is in positive range, rsi is below overbought level and volume is bigger than the moving avg of volume .
For short, we have the opposite long rules.
If you have any questions, please let me know !

MACD oscillator with EMA alert version 4HThis is the study/indicator alert version of the macd + ema strategy.
The strategy details are the following :
Is a simple, yet efficient strategy, which is made from a combination of an oscillator and a moving average.
Its setup for 4h candles with the current settings, however it can be adapted to other different timeframes.
It works nicely ,beating the buy and hold for both BTC and ETH over the last 3 years.
As well with some optimizations and modifications it can be adapted to futures market, indexes(NASDAQ, NIFTY etc), forex( GBPUSD ), stocks and so on.
Components:
MACD
EMA
Time condition
Long/short option
For long/exit short we enter when we are above the ema , histogram is positive and current candle is higher than previous.
For short /exit long , when close below ema , histo negative and current candles smaller than previous
If you have any questions please let me know !

ETH Top Cap [jamesray]This script is modified from Top Cap , as published here.
Historically it matches market tops for ETH

Ether (Ethereum) CME Gaps [NeoButane]Detects gaps in trading for CME's "Ether" cash-settled futures. This will show gaps as they happen on the 24/7 charts that crypto exchanges use. It is not usable on CME's tickers themselves, as gaps in trading are not displayed.
This indicator will only display if viewing an ETH chart.
More information on the CME ETH futures here:
www.cmegroup.com
Based on:
What's different: CME's BTC and ETH markets trade the same hours, but one may hit a limit breaker while there may be a case where the other does not.

CRYPTO Trend Direction Multiple EMA'sToday I bring an indicator specialized in crypto markets.
Its made of multiples EMA : very fast, fast, normal, slow, very slow
The logic behind its simple :
For long : we check that the EMA are in ascending order like EMA 5 > EMA 10 > EMA 20 .... and at the same time that last close of candle is above all of them.
For short : we check that the EMA are in descending order like EMA 5 < EMA 10 < EMA 20 .... and at the same time last close of candle is below all of them.
It can be used with all time frames.
Enjoy it !

OnTheMoveWith this plot one is able to compare the different % change in the given time frame. It calculates the sma of a given period (defval = 7) for the close/open.
Strategy would be to choose (trade) from one to other asset in order to get higher rates when pumping or lower when dumping.
The Symbol & exchange has to be specified.
defSymbols = BTC, ETH and LINK
defExchange = BINANCE

BTC & ETH Alert SystemWith Tradingview's free plan, only one alert is allowed. The purpose of this indicator is to allow for two alerts--one for BTC and one for ETH.
How to use the alert system:
1. Set the desired value for BTC and ETH that you want to be alerted for
2. Set an alert on the indicator by clicking the three ellipses and then "Add Alert"
3. Set the alert to go off if the value of the indicator is greater than 0.
The example is of BTC using an alert of $10,000 and an alert of ETH at $2,000 (untriggered)
The script can be easily modified to be used for different assets

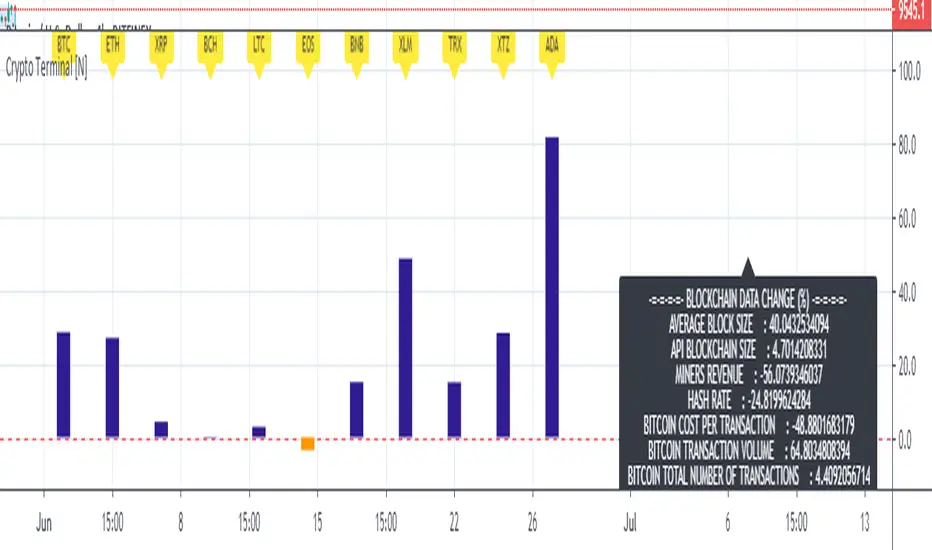
Basic Cryptocurrency TerminalHello,
This script is a simple Cryptocurrency Terminal.
It serves the same purpose as Heatmaps.
You can also set the period to look back manually in the menu.
Major Cryptocurrencies are taken into account.
And various Blockchain data are shown in the information panel.
In this way, an idea can be obtained about Cryptocurrency Market.
It is visually more convenient and clear to use in an indicator window under the chart, not on the chart, as follows:
Regards.
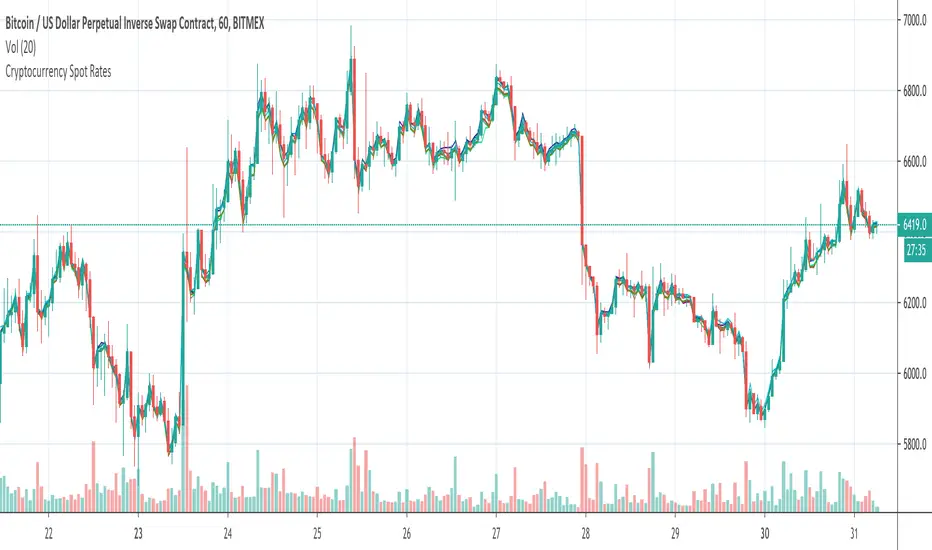
Cryptocurrency Spot RatesThis is an overlay indicator on the chart that will plot cryptocurrency spot prices of the following exchanges:
- Coinbase
- Poloniex
- OKCOIN
- Binance
- Huobi
- Bittrex
- HitBTC
- Kraken
- Bitfinex
Additionally it plots the price average of all those exchanges.
This overlay is intended to be used on charts with derivatives/futures such as BitMEX/Deribit/...
It works with all USD and Tether pairs on the main chart (for example BTCUSD, ETHUSD, BCHUSD,...)
Keltner Channel Alerts [QuantNomad]This is a script with alerts for standard Keltner Channer Strategy you can find in TradingView.
Use "Once Per Bar" option when creating alerts.

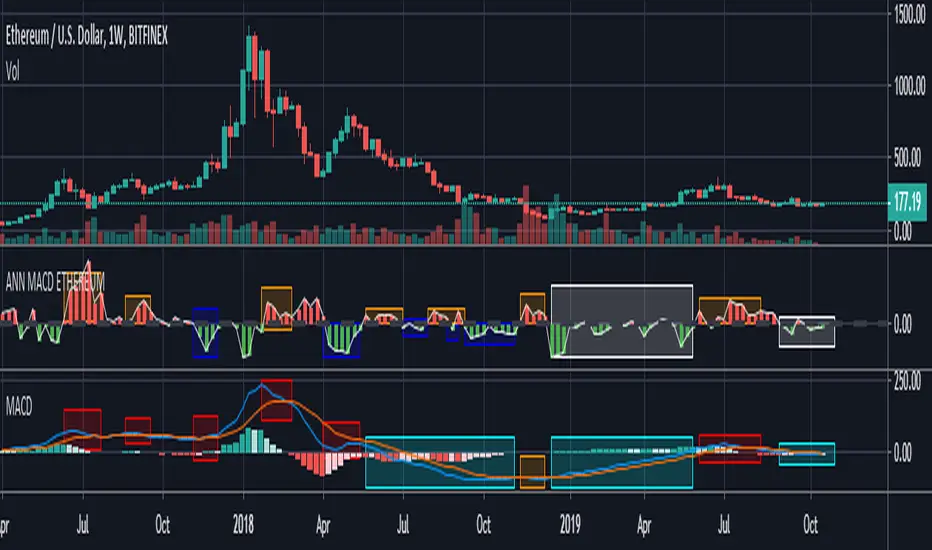
ANN MACD ETHEREUM
This script is trained with Ethereum (Timeframe : 4 hours ).
Details :
Input columns: 19
Output columns: 1
Excluded columns: 0
Training example rows: 300
Validating example rows: 0
Querying example rows: 0
Excluded example rows: 0
Duplicated example rows: 0
Input nodes connected: 19
Hidden layer 1 nodes: 8
Hidden layer 2 nodes: 1
Hidden layer 3 nodes: 0
Output nodes: 1
Learning rate: 0.7000
Momentum: 0.8000
Training error: 0.009378 ( That's a very good error coefficient. )
Many thanks to wroclai for help.
Deep learning series will continue!