Crypto Multi Exchange Volume (CMEV)Crypto Multi Exchange Volume (CMEV) aggregates and plots trading volumes for supported cryptoasset pairs over multiple different cryptoasset exchanges. For developers looking for more information and for those who want to compile their own version of CMEV, please check out my GitHub (jakobpredin/crypto-multi-exchange-volume).
Configuration
CMEV comes with two configurable settings - whether base volume or quote volume is plotted and the length of the volume's EMA. By default, the base volume is used for plotting and the length of the EMA is set to 12 periods.
Use cases
The indicator was primarily developed in order to be able to chart using the trading pair with the longest available trading history. Due to the fast-changing preferences of where cryptoassets are traded, volumes tend to be very inconsistent and can give a distorted picture of a pairs history. For illustration, check out the SC-BTC pair from Poloniex using their native volume and compare it to the CMEV volume.
The other use case is to be able to spot divergences in volume. A great example here is bitcoin's 2019 rally where volumes from derivatives exchanges are at all time highs but volumes from retail/spot exchanges are not.
Supported exchanges
CMEV currently supports asset pairs from the following exchanges:
Binance
Bitfinex
Bitstamp
Bittrex
Coinbase
Gemini
Kraken
Poloniex
Limitations
Because of the fact that CMEV is pulling data from from multiple different exchanges and is computationally intensive it can take a couple of seconds to load while charting certain cryptoasset pairs.
Additionally, due to Tradingview's various limitations only a certain number of pairs can be supported at a time. By default, only pairs with a BTC or USD quote are supported and many non-unique pairs with consistently low trading volumes have been removed. For a full explanation, please refer to the docs in my GitHub (jakobpredin/crypto-multi-exchange-volume).
Future of the project
I plan on supporting pairs from more exchanges in the future as I see fit and as they become available for charting on Tradingview. Further, I may develop a strategy script using CMEV as its core indicator.
I welcome everybody from the community to help me extend the functionality of CMEV in order to make investing in cryptoassets more transparent for everybody.
D-ETH

OBV Z-ScoresThis study calculates the On-Balance Volume (OBV) and displays it in terms of its Z-Score.
OBV is a great momentum indicator . As the name suggests, OBV predicts changes in price based on the security's volume flow.
Formula:
if (Current Price > Previous Price)
then Current OBV = Previous OBV + Current Volume
if (Current Price < Previous Price)
then Current OBV = Previous OBV - Current Volume
if (Current Price == Previous Price)
then Current OBV = Previous OBV
As the formula shows, the OBV goes a step beyond just looking at the pure volume of a security. Instead, it factors in relative price action from period to period to reflect investor sentiment. As a result, we often look to the OBV to spot bullish or bearish trends while they are in the early stages of development or simply predict impending uptrends or downtrends.
To make the OBV easier to visualize, we converted the value to a Z-Score. The Z-Score is a simple statistical measurement and represents the current OBV value's distance from the mean OBV value in terms of # of standard deviations.
Users can adjust the values for the 2 upper bounds for Z Scores and 2 lower bounds. Additionally, the n value for z score calculation can be adjusted in the input menu. A higher n value means the z score will be based on a longer lookback period. A lower value will result in more sensitive readings.
Overall, I think this is an interesting way to represent OBV values and will be a valuable leading indicator.
~Happy Trading~

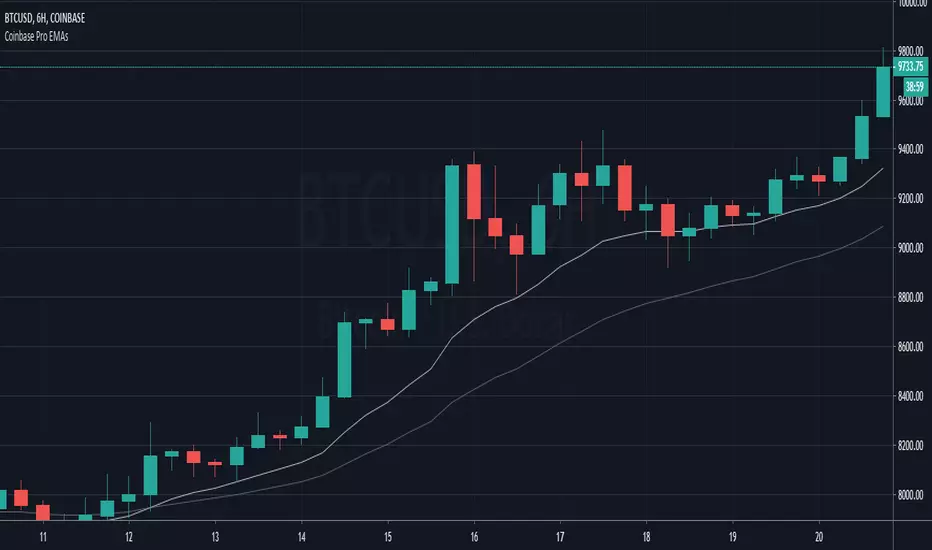
Coinbase Pro EMAsAn indicator to match the only overlays available on Coinbase Pro charts, the EMA12 and EMA26.
ETHUSDSHORTS+ETHUSDLONGS - Bitfinex ETH Shorts & Longs & TotalBitfinex ETH Shorts & Longs & Total
There is "Shorts" & "Longs" & "Shorts + Longs" & "Shorts - Longs"

Top 5 coins cummulated Upvol/Dnvol and Money FlowThis script reads price and volume information for the top 5 coins (on 9 exchanges, a total of 29 pairs), calculates the cummulative upvolume and downvolume according to the Money Flow (MFI) formula, and shows upvolume and downvolume separately on the chart as a green and a red line.
The coins used are BTC, ETH, LTC, XRP and EOS. They are the top 5 coins by daily volume, as of 24th of February 2019.
Because of the many security() calls needed, the script is VERY slow, so have lots of patience.
I find it useful as a broad crypto market indicator - for example to compare the current pump with the pumps in the past.
Can also calculate the aggregated Money Flow (MFI) if you check that option in the indicator's configuration. Make sure to wait for recalculation and rescale the chart afterwards - MFI has a value from 0 to 100 and you may need to zoom in.

ETH HawkEye Aggregated Volume IndicatorThis is combined Aggregated ETH Exchange Volume by Neobutane with HawkEye volume clone indicator by LazyBear.
Indicator includes aggregated raw ETH volume from 7 user selectable fiat and tether exchanges on USD, USDT, BTC, EUR, GBP, JPY pairs + Exponential MA + hawkeye bar coloring where: green is bullish volume , red - bearish and white - volume neutral to the market:
Bitfinex
Coinbase
Bitstamp
Kraken
Binance
Poloniex
Bittrex
*There is a TV bug that doesn't display a whole volume history if some pair was added later than date intended to be analysed by operator eg, if you want to watch older data you should exclude all secondary pairs that were added later and switch off "newer" exchanges like Binance.

CCV Crypto Margin Positions Via BitfinexAllows you to change between multiple assets to see open longs versus shorts. Includes BTC, ETH, LTC, TRX and more. You can also choose the quote pair of USD or BTC to get an idea for Bitmex assets as well. If you choose BTC on a BTC quote the USD positions will appear. All other assets will show the BTC paired positions.
Like and follow for more free scripts in the future.

BTC ETH RatioBTCUSD / ETHUSD Ratio.
You might find patterns when to move from BTC to ETH and vice versa.
# Open Source
The code is open source @ github.com and uses the commonpine library github.com

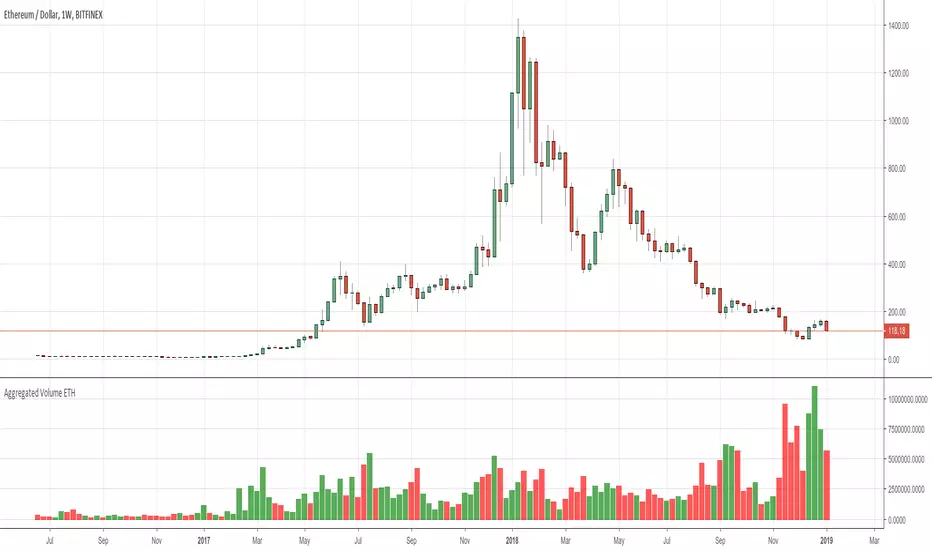
Aggregated Volume ETHAggregates the ETH/fiat volume from multiple exchanges into a single indicator.
# Exchanges and Pairs
Included are only exchanges supported by TradingView:
* Binance
* Bitstamp
* Bittrex
* Coinbase
* Gemini
* itBit
* Bitfinex
* Kraken
* Poloniex
* BitMEX
Excluded low volume exchanges (not in CMC Top):
* CEX . IO
* Coinfloor
Excluded exchange due to volume calculation by TV:
* HitBTC
Many other top exchanges are not included, because they are not supported by TradingView.
# Inputs
By default the spot exchanges are selected. You can select also the other margin trading and derivatives exchanges.
# Contribute
Feel free to share any ideas and issues you have.
# Open Source
The code is open source @ github.com and uses the commonpine library github.com


XBT Volatility Weighted Bottom Finder. [For Daily Charts]An update to:
Made it into and indicator.
v. 0.0.1
DESIGNED FOR DAILY CHARTS


Volatility Across CoinsCompare the recent volatility of 8 cryptocurrencies, based on percentage change per candle.
Useful for volatility strategies to find the highest volatility coins over recent periods or to get an at-a-glance view of volatility correlations.
Options to change the resolution and find average % change per candle over user defined length.
Key:
BTC = Yellow/Gold
ETH = Purple
LTC = Gray
NEO = Green
IOTA = Light Blue
XMR = Orange
BCH = Red
Dash = Blue

GDAX Coin CorrelationPretty viz of how correlated/uncorrelated price of coins BTC ETH LTC BCH are on GDAX.
From the ref:
"Correlation coefficient. Describes the degree to which two series tend to deviate from their sma values."

40 DOMINANT ALTCOINS BINANCEThis indicator is a combination of 40 different altcoins which are found on Binance exchange.
I have listed all Binance altcoins in the order of the oldest listed and the newest.
Due to limitations on TV for calling only 40 securities at the same time, I have limited myself with adding only the oldest ones (9+ months) and some 8+ to make up at least 40 for more data.
I have excluded BTC, BCC, ETH, USDT, BNB from list as these are the trading pairs.
I have some updates in mind and will try to add more options in coming months
Regularly updating 40 altcoins list by sorting them by market cap and available historical data from Binance
Adding Bitfinex, Bittrex and other exchanges separetly, as there is only 40 security call limit
Adding ETH; USDT pairs for all above exchanges.
You can add any indicator to this indicator - such as MACD, RSI, EMA and so on to help you analyse it more deeper
When you load this indicator, it takes about 1 min wait as it takes and calculates a lot of data. After it is loaded, it works perfectly.
Currently there is only 40 oldest altcoins to gather enough data, but as time passes, I will change some of them to create better picture of alt coins.
Please report any problems and give feedback.
Any idea of improvement is welcome and I will try my best.
Please support me an consider to give a small tip to addresses bellow. It would greatly help me to free more time for improvements as I am working to support family and my time is limited for markets.
ETH: 0xac290B4A721f5ef75b0971F1102e01E1942A4578
BTC: 39p3rKuJYKGqph1Qs35yEfNWoPvpUJBBcy
This will greatly help me to keep update this indicator and give me more time to analyse and sort out all altcoins my their market cap, volume and influence.

Gap finder (gold minds)This tool highlights where gaps happens and outlines in the chart where the gap zones are. If there is a gap up there is a green line, a gap down it is red. The gap zone is highlighted in blue. You can choose the size of your gap with the input menu to the desired size. Feel free to ask comment below. Made for the Gold Minds group

Volume in BTC v2I made this indicator to display the volume in BTC in the top left. I find it useful to quickly get the idea of how much BTC is being traded in each pair. It also showing the 7 candle moving average volume in BTC. This is configurable tho.
Please note, this is my first script, and after activating it you will get two annoying lines on your chart. You will have to open the indicators setting and disable those lines manually until i figure out how to do it in the script. Anyway, its a minor issue. I hope you will still enjoy the indicator. Have a nice day.

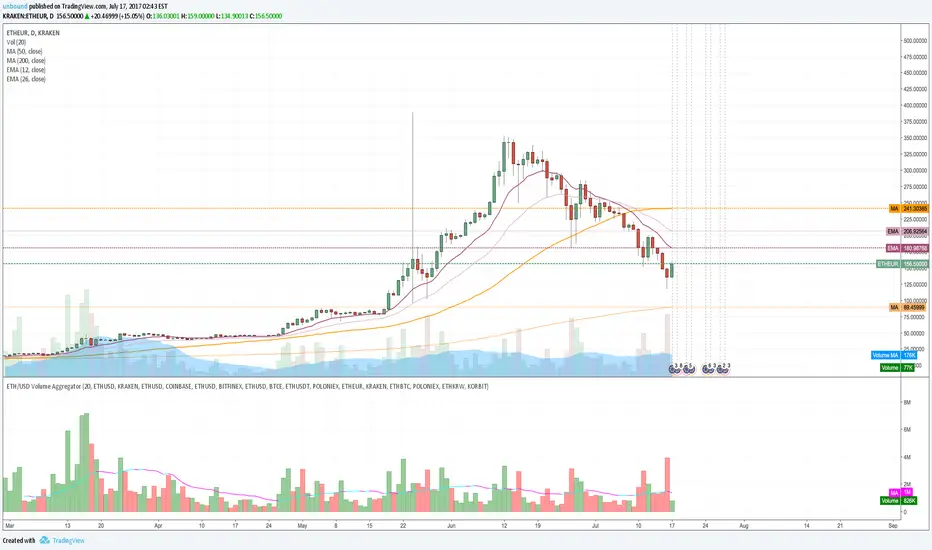
ETH Volume Aggregator
This script aggregates ETH trading volume from 8 major ticker data available on tradingview.