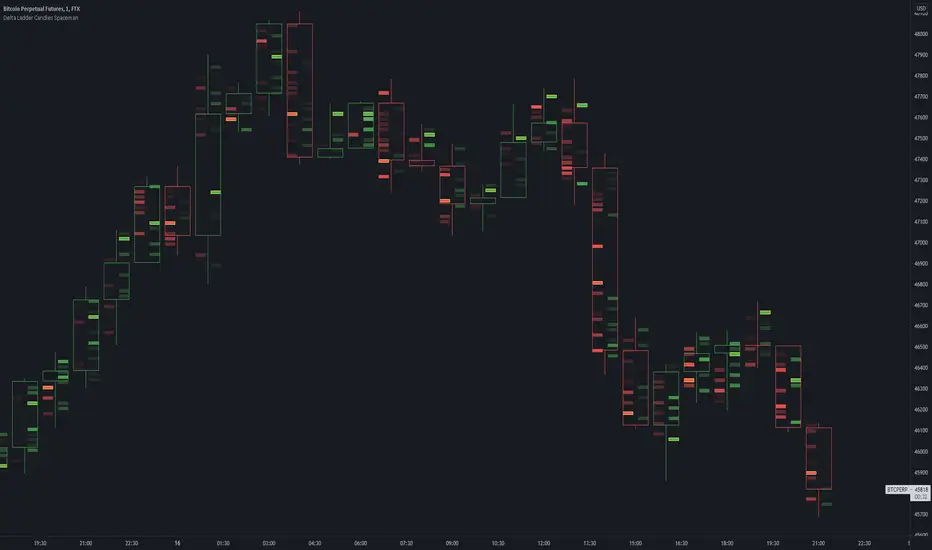
Delta Ladder Candles SpacemanDelta Ladder Candles Spaceman
This is a tool thats very useful for traders primarily a goal to provide all types of traders some confluence to price action trading.
Using calculation of time and volume, the candles are created for the higher timeframe adjusted for buying and selling delta volume.
This tool is useful for determining an increase in buy or sell pressure as well as possibly to show trapped buyers and sellers when near points of extremes such as swing highs and lows.
Auto tick size takes into account exisiting volatility and finding an average to generate a size that is likely applicable to the timeframe selected whilst also allowing
the indicator to generate data accurately on all potential charts.
To generate the data it creates a candle profile essentially with an empty body to allow for a look into the general formation of a candle.
The logic is to provide a simpler version of volume metrics for tv charts without compramising.
TO DO:
Consider a non delta variant setting.
Look back period increase potential, perhaps allow for set periods to create candles on ignoring all other data points.
Potetial intrabar state component to give a more accurate buy/sell delta
Delta
China to Derivateves DeltaCONCEPT
This indicator shows the delta between the Chinese market and the Derivatives, which implies the ability to track how China is trading.
FEATURES
USDT fixed Delta
Absolute Delta
Tether Desirability
TRADING
It's simple when USDT Fixed C2D, Absolute C2D and Tether Desirability are negative – this signals an increased pressure from sellers from China, also vice versa.
If you want access send me a private message so we can discuss it.
Cheers.

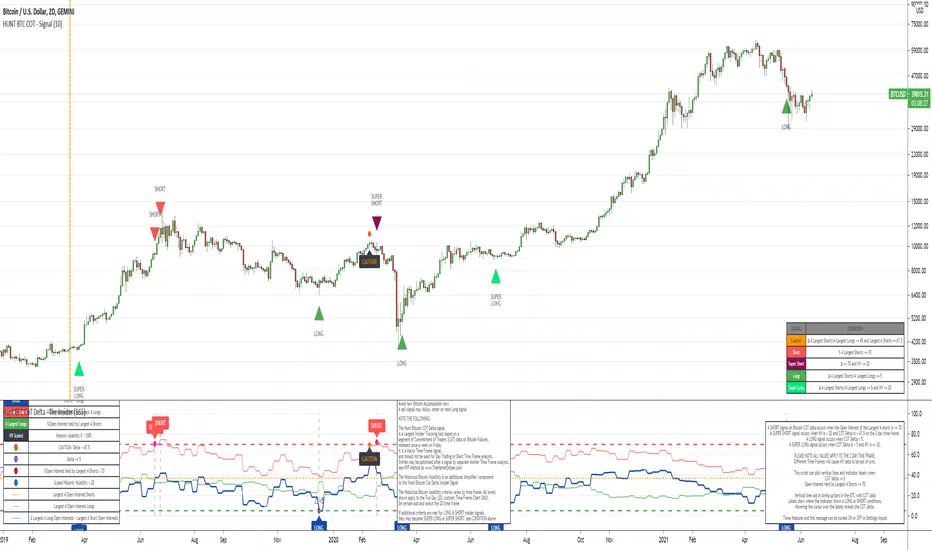
The Insider - Hunt Bitcoin CoT DeltaThe Insider - Hunt Bitcoin CoT Delta
The gift of the Squeeze in the Largest 4 open Interest Shorts vs Longs.
Why Bother another CoT signal?
Its different & focused on the Insider's.
Performance -
This Indicator provided a
1. Signal 1 = 26th March 2019 = SUPER LONG at $4,500 that saw a near $14,000 run up
2. Signal 2 = 18th & 24th June 2019 = SHORT at the second & final level $11,700 after repeated attempts & failure in the $13K range, the mini Echo Bitcoin Bull of 2019
3. Signal 3 = 17th December 2019 = LONG $6,900, Bitcoin rallied to Mid $10,500's
4. Signal 4 = 18th Feb 2020 = SUPER SHORT from $9,700's to a final extreme Low of $3,000, calling the CV-19 collapse
5. Signal 5 = 17th March 2020 = LONG from $5,400 no closure point yet
6. Signal 6 = 29th June 2020 = SUPER LONG reiterate from $10,700 no closure sell signal yet
7. Signal 7 = 17th May 2020 = LONG another accumulate LONG with no sell signal yet generated at Post H&S's low of $33,000
Note - This indicator only commences March 2019, as Bitcoin futures were a recent introduction and needed to settle for 6 months in both use and data, no signals were meaningful prior & data was light.
What is Provided. - Please note the need to also add the Hunt Bitcoin Historical Volatility Indicator for full understanding.
We provide 3 things with the 3 indicators.
'Insider' indications from Largest players in the futures market.
1. Bitcoin Macro Buy Signals.
a) The Bitcoin Commitment of Traders results see us focus solely on Largest 4 Short Open Interest & Largest 4 Long Open Interest aspects of the CoT Release data.
When the difference - is tight, a kind of pinch, these have been great Buy signals in Bitcoin.
We call this difference the Delta & When Delta is 5% or less Bitcoin is a Buy.
2. Bitcoin Macro Sells.
a) A sell signal is Triggered in Bitcoin at any point the Largest 4 short OI > or = to 70
3. AMPLIFIER Trade signals 'Super' Longs or Shorts -
Extreme low volatility events leads to highly impulsive & volatile subsequent moves, if either of 1 or 2 above occur, combined with extreme low volatility
a 'Super Long' or 'SUPER SELL' is generated. In the case of the short side, given Bitcoins general expansive and MACRO Bull trend since inception, we seek an additional component
that is an extreme differential/Delta reading between 4 biggest Longs & Shorts OI.
Namely CoT Delta also must be > 47.5%
We also have a Cautionary level, where it is not necessarily a good idea to accumulate Bitcon, as a better opportunity lower may avail itself, see conditions below.
So the required logic explicitly stated below for all Signals.
1. Long - Hunt Bitcoin CoT Delta < or = 5
2. SUPER Long - Hunt Bitcoin CoT Delta < or = 5; and 2 Day Historical Bitcoin Volatility = or < 20
3. Short - Largest 4 Sellers OI = or > 70
4. SUPER Short - Largest 4 Sellers OI = or > 70; AND..
Hunt Bitcoin CoT Delta = or > 47.5 AND 2 Day Historical BTC Volatility = or < 20
5. Caution - Largest 4 Sellers OI = or > 67.5 AND Hunt Bitcoin CoT Delta = or > 45
WARNING SEE Notes Below
Note 1 - = Largest 4 Open Interest Shorts
Note 2 - = Largest 4 Open Interest Longs
Note 3 - = Hunt Cot Delta = (Largest 4 sellers OI) -( Largest 4 Buyers OI)
Caution = Avoid new Bitcoin Accumulation Right Now, A sell signal might follow Enter on next Long
Note 4 - The Hunt Bitcoin COT Delta signal is a Largest 'Insider' Tracking tool based on a segment of Commitment of Traders data on Bitcoin Futures, released once a week on a Friday.
It is a Macro Timeframe signal , and should not be used for Day trading and Short Timeframe analysis , Entries may be optimised after a Hunt Bitcoin CoT Signal is generated by separate shorter Timeframe analysis.
Note 5 - The Historical Bitcoin Volatility is an additional 'Amplifier' component to the 'Hunt Bitcoin Cot Delta' Insider Signal
Note 6 - The Historical Bitcoin Volatility criteria varies by timeframe, the above levels are those applying on a Two Day TF Chart, select this custom timeframe in Trading View.
if additional criteria are met for LONG & SHORT insider signals, they may become 'Super Longs/Shorts', see conditions box above.
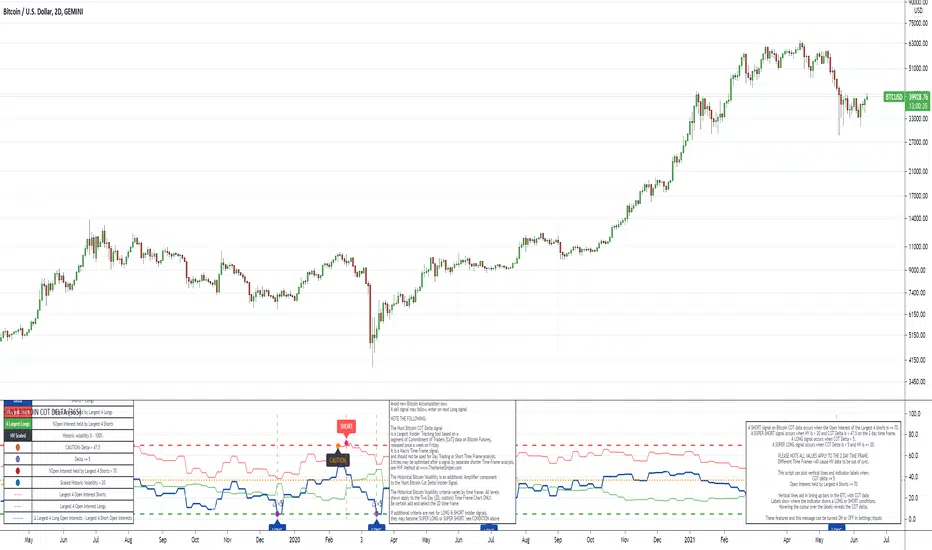
The Signal - Hunt Bitcoin CoT Buy/SellThe Signal - Hunt Bitcoin CoT Buy/Sell
Why Bother with another CoT signal?
Its different & focused on the Insider's. The Largest 4 Open Interest Seller and the Largest 4 open Interest Longs, plus the distance they are apart, the Delta, what does high percentage of Largest 4 sellers mean with a low 4 OI Buyers. , what when the usually higher Sellers are low and the largest 4 buyers almost the same value , Time to track the insiders Delta..
Performance -
This Indicator provided a
1. Signal 1 = 26th March 2019 = SUPER LONG at $4,500 that saw a near $14,000 run up
2. Signal 2 = 18th & 24th June 2019 = SHORT at the second & final level $11,700 after repeated attempts & failure in the $13K range, the mini Echo Bitcoin Bull of 2019
3. Signal 3 = 17th December 2019 = LONG $6,900, Bitcoin rallied to Mid $10,500's
4. Signal 4 = 18th Feb 2020 = SUPER SHORT from $9,700's to a final extreme Low of $3,000, calling the CV-19 collapse
5. Signal 5 = 17th March 2020 = LONG from $5,400 no closure point yet
6. Signal 6 = 29th June 2020 = SUPER LONG reiterate from $10,700 no closure sell signal yet
7. Signal 7 = 17th May 2020 = LONG another accumulate LONG with no sell signal yet generated at Post H&S's low of $33,000
Note - This indicator only commences March 2019, as Bitcoin futures were a recent introduction and needed to settle for 6 months in both use and data, no signals were meaningful prior & data was light.
What is Provided. - Please note the need to also add the Hunt Bitcoin Historical Volatility Indicator for full understanding.
We provide 3 things with the 3 indicators.
'Insider' indications from Largest players in the futures market.
1. Bitcoin Macro Buy Signals.
a) The Bitcoin Commitment of Traders results see us focus solely on Largest 4 Short Open Interest & Largest 4 Long Open Interest aspects of the CoT Release data.
When the difference - is tight, a kind of pinch, these have been great Buy signals in Bitcoin.
We call this difference the Delta & When Delta is 5% or less Bitcoin is a Buy.
2. Bitcoin Macro Sells.
a) A sell signal is Triggered in Bitcoin at any point the Largest 4 short OI > or = to 70
3. AMPLIFIER Trade signals 'Super' Longs or Shorts -
Extreme low volatility events leads to highly impulsive & volatile subsequent moves, if either of 1 or 2 above occur, combined with extreme low volatility
a 'Super Long' or 'SUPER SELL' is generated. In the case of the short side, given Bitcoins general expansive and MACRO Bull trend since inception, we seek an additional component
that is an extreme differential/Delta reading between 4 biggest Longs & Shorts OI.
Namely CoT Delta also must be > 47.5%
We also have a Cautionary level, where it is not necessarily a good idea to accumulate Bitcon, as a better opportunity lower may avail itself, see conditions below.
So the required logic explicitly stated below for all Signals.
1. Long - Hunt Bitcoin CoT Delta < or = 5
2. SUPER Long - Hunt Bitcoin CoT Delta < or = 5; and 2 Day Historical Bitcoin Volatility = or < 20
3. Short - Largest 4 Sellers OI = or > 70
4. SUPER Short - Largest 4 Sellers OI = or > 70; AND..
Hunt Bitcoin CoT Delta = or > 47.5 AND 2 Day Historical BTC Volatility = or < 20
5. Caution - Largest 4 Sellers OI = or > 67.5 AND Hunt Bitcoin CoT Delta = or > 45
WARNING SEE Notes Below
Note 1 - = Largest 4 Open Interest Shorts
Note 2 - = Largest 4 Open Interest Longs
Note 3 - = Hunt Cot Delta = (Largest 4 sellers OI) -( Largest 4 Buyers OI)
Caution = Avoid new Bitcoin Accumulation Right Now, A sell signal might follow Enter on next Long
Note 4 - The Hunt Bitcoin COT Delta signal is a Largest 'Insider' Tracking tool based on a segment of Commitment of Traders data on Bitcoin Futures, released once a week on a Friday.
It is a Macro Timeframe signal , and should not be used for Day trading and Short Timeframe analysis , Entries may be optimised after a Hunt Bitcoin CoT Signal is generated by separate shorter Timeframe analysis.
Note 5 - The Historical Bitcoin Volatility is an additional 'Amplifier' component to the 'Hunt Bitcoin Cot Delta' Insider Signal
Note 6 - The Historical Bitcoin Volatility criteria varies by timeframe, the above levels are those applying on a Two Day TF Chart, select this custom timeframe in Trading View.
if additional criteria are met for LONG & SHORT insider signals, they may become 'Super Longs/Shorts', see conditions box above.

Hunt Bitcoin CoT Open Interest DeltaWhy Bother another CoT signal?
Its different & focused on the Insider's.
Performance -
This Indicator provided a
1. Signal 1 = 26th March 2019 = SUPER LONG at $4,500 that saw a near $14,000 run up
2. Signal 2 = 18th & 24th June 2019 = SHORT at the second & final level $11,700 after repeated attempts & failure in the $13K range, the mini Echo Bitcoin Bull of 2019
3. Signal 3 = 17th December 2019 = LONG $6,900, Bitcoin rallied to Mid $10,500's
4. Signal 4 = 18th Feb 2020 = SUPER SHORT from $9,700's to a final extreme Low of $3,000, calling the CV-19 collapse
5. Signal 5 = 17th March 2020 = LONG from $5,400 no closure point yet
6. Signal 6 = 29th June 2020 = SUPER LONG reiterate from $10,700 no closure sell signal yet
7. Signal 7 = 17th May 2020 = LONG another accumulate LONG with no sell signal yet generated at Post H&S's low of $33,000
Note - This indicator only commences March 2019, as Bitcoin futures were a recent introduction and needed to settle for 6 months in both use and data, no signals were meaningful prior & data was light.
What is Provided. - Please note the need to also add the Hunt Bitcoin Historical Volatility Indicator for full understanding.
We provide 3 things with the 3 indicators.
'Insider' indications from Largest players in the futures market.
1. Bitcoin Macro Buy Signals.
a) The Bitcoin Commitment of Traders results see us focus solely on Largest 4 Short Open Interest & Largest 4 Long Open Interest aspects of the CoT Release data.
When the difference - is tight, a kind of pinch, these have been great Buy signals in Bitcoin.
We call this difference the Delta & When Delta is 5% or less Bitcoin is a Buy.
2. Bitcoin Macro Sells.
a) A sell signal is Triggered in Bitcoin at any point the Largest 4 short OI > or = to 70
3. AMPLIFIER Trade signals 'Super' Longs or Shorts -
Extreme low volatility events leads to highly impulsive & volatile subsequent moves, if either of 1 or 2 above occur, combined with extreme low volatility
a 'Super Long' or 'SUPER SELL' is generated. In the case of the short side, given Bitcoins general expansive and MACRO Bull trend since inception, we seek an additional component
that is an extreme differential/Delta reading between 4 biggest Longs & Shorts OI.
Namely CoT Delta also must be > 47.5%
We also have a Cautionary level, where it is not necessarily a good idea to accumulate Bitcon, as a better opportunity lower may avail itself, see conditions below.
So the required logic explicitly stated below for all Signals.
1. Long - Hunt Bitcoin CoT Delta < or = 5
2. SUPER Long - Hunt Bitcoin CoT Delta < or = 5; and 2 Day Historical Bitcoin Volatility = or < 20
3. Short - Largest 4 Sellers OI = or > 70
4. SUPER Short - Largest 4 Sellers OI = or > 70; AND..
Hunt Bitcoin CoT Delta = or > 47.5 AND 2 Day Historical BTC Volatility = or < 20
5. Caution - Largest 4 Sellers OI = or > 67.5 AND Hunt Bitcoin CoT Delta = or > 45
WARNING SEE Notes Below
Note 1 - = Largest 4 Open Interest Shorts
Note 2 - = Largest 4 Open Interest Longs
Note 3 - = Hunt Cot Delta = (Largest 4 sellers OI) -( Largest 4 Buyers OI)
Caution = Avoid new Bitcoin Accumulation Right Now, A sell signal might follow Enter on next Long
Note 4 - The Hunt Bitcoin COT Delta signal is a Largest 'Insider' Tracking tool based on a segment of Commitment of Traders data on Bitcoin Futures, released once a week on a Friday.
It is a Macro Timeframe signal , and should not be used for Day trading and Short Timeframe analysis , Entries may be optimised after a Hunt Bitcoin CoT Signal is generated by separate shorter Timeframe analysis.
Note 5 - The Historical Bitcoin Volatility is an additional 'Amplifier' component to the 'Hunt Bitcoin Cot Delta' Insider Signal
Note 6 - The Historical Bitcoin Volatility criteria varies by timeframe, the above levels are those applying on a Two Day TF Chart, select this custom timeframe in Trading View.
if additional criteria are met for LONG & SHORT insider signals, they may become 'Super Longs/Shorts', see conditions box above.
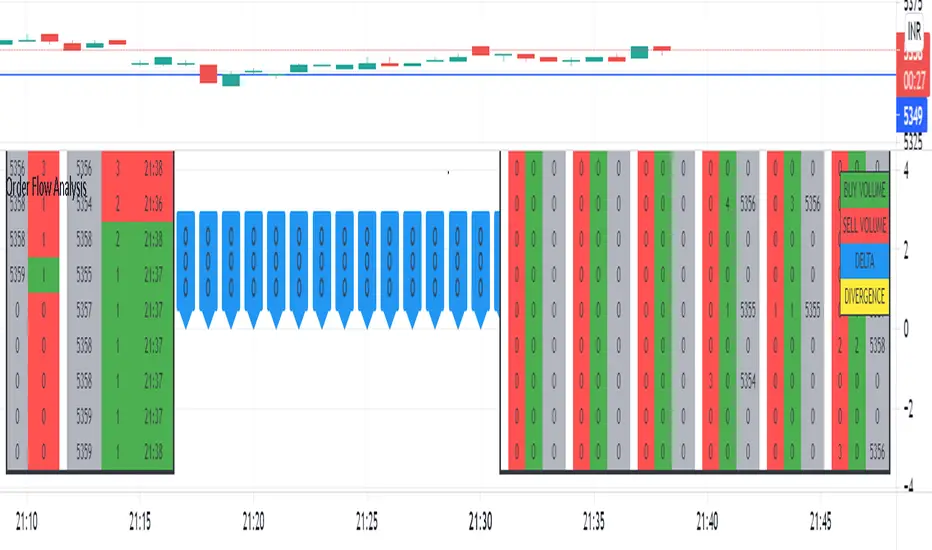
Order Flow AnalysisThe script plots the order flow clusters for the last six candles in the middle right.
The cluster contains buy volume, sell volume and the price range of the volume.
It calculates uptick volume as buy volume and down tick volume as sell volume and calculates the delta(shown in labels). Recent ATR is considered to determine each cell price range in the cluster.
At the left side, the top volume ticks and the live ticks are displayed.
Please note this works only during market trading hours.
Do not refresh the browser tab and do not change the timeframe, which will cause a reset of numbers.
Tape [LucF]█ OVERVIEW
This script prints an ersatz of a trading console's "tape" section to the right of your chart. It displays the time, price and volume of each update of the chart's feed. It also calculates volume delta for the bar. As it calculates from realtime information, it will not display information on historical bars.
█ FEATURES
Calculations
Each new line in the tape displays the last price/volume update from the TradingView feed that's building your chart. These updates do not necessarily correspond to ticks from the originating broker/exchange's matching engine. Multiple broker/exchange ticks are often aggregated in one chart update.
The script first determines if price has moved up or down since the last update. The polarity of the price change, in turn, determines the polarity of the volume for that specific update. If price does not move between consecutive updates, then the last known polarity is used. Using this method, we can calculate a running volume delta accumulation for the bar, which becomes the bar's final volume delta value when the bar closes (you can inspect values of elapsed realtime bars in the Data Window or the indicator's values). Note that these values will all reset if the script re-executes because of a change in inputs or a chart refresh.
While this method of calculating volume delta is not perfect, it is currently the most precise way of calculating volume delta available on TradingView at the moment. Calculating more precise results would require scripts to have access to bid/ask levels from any chart timeframe. Charts at seconds timeframes do use exchange/broker ticks when the feeds you are using allow for it, and this indicator will run on them, but tick data is not yet available from higher timeframes, for now. Also note that the method used in this script is far superior to the intrabar inspection technique used on historical bars in my other "Delta Volume" indicators. This is because volume delta here is calculated from many more realtime updates than the available intrabars in history.
Inputs
You can use the script's inputs to configure:
• The number of lines displayed in the tape.
• If new lines appear at the top or bottom.
• If you want to hide lines with low volume.
• The precision of volume values.
• The size of the text and the colors used to highlight either the tape's text or background.
• The position where you want the tape on your chart.
• Conditions triggering three different markers.
Display
Deltas are shown at the bottom of the tape. They are reset on each bar. Time delta displays the time elapsed since the beginning of the bar, on intraday timeframes only. Contrary to the price change display by TradingView at the top left of charts, which is calculated from the close of the previous bar, the price delta in the tape is calculated from the bar's open, because that's the information used in the calculation of volume delta. The time will become orange when volume delta's polarity diverges from that of the bar. The volume delta value represents the current, cumulative value for the bar. Its color reflects its polarity.
When new realtime bars appear on the chart, a ↻ symbol will appear before the volume value in tape lines.
Markers
There are three types of markers you can choose to display:
• Marker 1 on volume bumps. A bump is defined as two consecutive and increasing/decreasing plus/minus delta volume values,
when no divergence between the polarity of delta volume and the bar occurs on the second bar.
• Marker 2 on volume delta for the bar exceeding a limit of your choice when there is no divergence between the polarity of delta volume and the bar. These trigger at the bar's close.
• Marker 3 on tape lines with volume exceeding a threshold. These trigger in realtime. Be sure to set a threshold high enough so that it doesn't generate too many alerts.
These markers will only display briefly under the bar, but another marker appears next to the relevant line in the tape.
The marker conditions are used to trigger alerts configured on the script. Alert messages will mention the marker(s) that triggered the specific alert event, along with the relevant volume value that triggered the marker. If more than one marker triggers a single alert, they will overprint under the bar, which can make it difficult to distinguish them.
For more detailed on-chart analysis of realtime volume delta, see my Delta Volume Realtime Action .
█ NOTES FOR CODERS
This script showcases two new Pine features:
• Tables, which allow Pine programmers to display tabular information in fixed locations of the chart. The tape uses this feature.
See the Pine User Manual's page on Tables for more information.
• varip -type variables which we can use to save values between realtime updates.
See the " Using `varip` variables " publication by PineCoders for more information.

Average Directional Index + ΔDI± (Delta)Average Directional Index (ADX) and Difference between DI+ and DI- (ΔDI±), I call it Delta for short.
The idea explained:
ADX is a common indicator for analysing trend strength. Values over 25 usually indicate the symbol is in "trend mode", meaning there is a lot of momentum, upwards or downwards, - while values under 25 suggest it is in "range mode", the price moves sideways, lacking energy. Note that this indicator is not volume-based.
I moved the graph (red) down 25 points; this version shows positive values in "trend mode" (>25), and negative values in "range mode" (<25). The line sits at 0. The underlying code for the ADX is basically identical to the official TradingView built-in version.
Now the exciting part: DI+ and DI- are used to calculate the ADX. They are sometimes included in the ADX indicator chart, I included a version that shows them in the graphic, at the bottom. Traditionally, DI+ (green) crossing DI- (dark red) from below shows the beginning of an upward trend, and therefore a good LONG entry position. However, I noticed that this is usually not the case: this method responds very slowly to the actual price movement. At the point the indicator tells you to enter, the trend is usually already exhausted.
I found a better way to use this data; instead of waiting for both graphs to cross, meaning the difference in their respective values is 0, we look for the greatest possible difference. That is what the purple graph of my indicator shows (ΔDI±). It utilizes the zero-line we already created for the ADX. High positive values declare that the DI+ is much greater than the DI-, and vice versa. Delta is the greek letter used in mathematics for difference, so that is what I call this indicator.
How to use it:
When you look at the graph, low Delta values seem to be good entry points for LONG positions, high Delta values good exits. This is similar to how RSI and CCI work, which is why included them in the chart above (). However, this is only reliable, when the ADX is above 25, or 0 in this version, indicating the symbol is in "trend mode". This is important .
When you look at the examples in the chart, you can confirm that. The marked candles show good entry and exit points, with Delta being notably low/high (±25 seems to be a good threshold, the dashed lines sit at +30/-30), and the ADX above 0 (25). Now, you might have noticed that around mid-december the Delta actually registers the highest value for this symbol in the given time frame, indicating a strong SHORT after a steep climb. But, importantly , the ADX is not in "trend mode" as required for a clear signal, it is in "range mode": the price discovers this new level and takes a few days to get used to it. It does not fall. This shows why only the combination of both Delta and ADX gives desirable results.
I noticed that this seems to work best for 1D and 1H candles; if you find any other time frames or scenarios, let me know!
PLEASE NOTE THAT THIS IS BASED ON PERSONAL, EMPIRICAL OBSERVATIONS. PAST RESULTS DO NOT GUARANTEE SUCCESS IN THE FUTURE. DO NOT TAKE THIS AS INVESTMENT ADVICE!
Thanks to TradingView and robertkowalski for providing the basis on which the code is built. Credit goes to the appropriate developers/owners.
()
Let me know if you make any other observations, or find other ways to use the data!

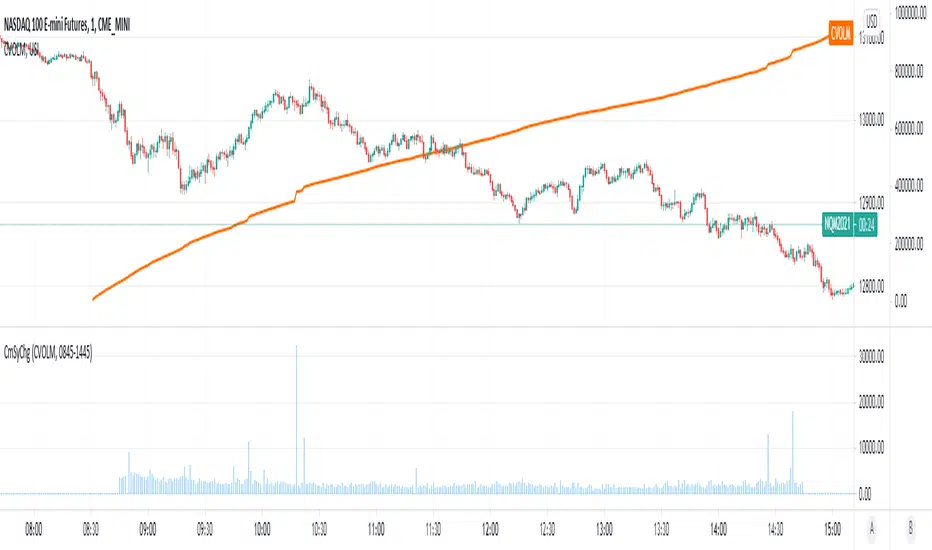
Cumulative Symbol ChangeSome symbols in trading view are cumulative - meaning they increment continuously throughout the trading day and are reset to 0 at the new trading day.
For example USI:CVOLM (Call Volume in Miami).
This script subtracts the current cumulative value from the prior cumulative value, so the change/delta in the cumulative value can be determined bar-by-bar.
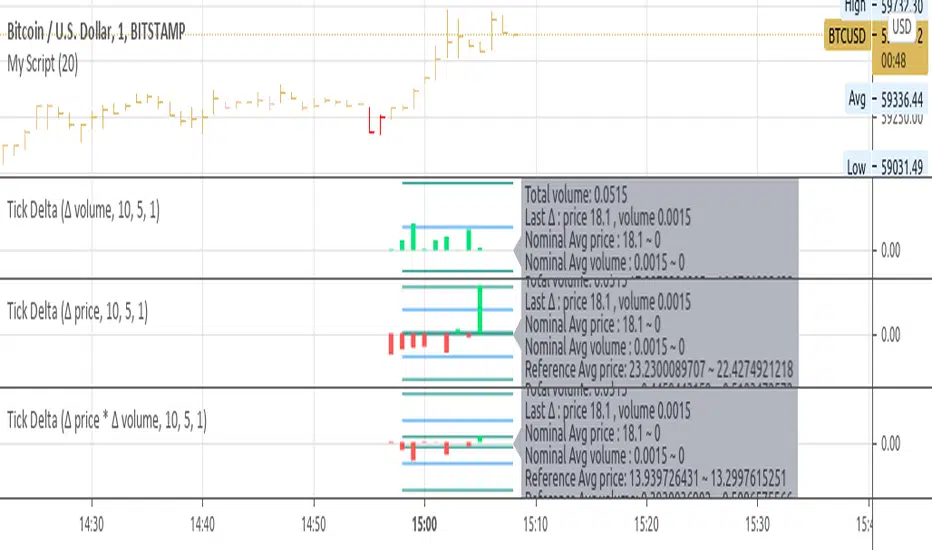
Tick Delta VolumeExperimental:
this script only works on live updating bars(market open and live), the longer it runs the more accurate it will be.
displays:
- total intrabar volume processed(may not be equal to volume).
- last delta tick change in volume.
- this bar delta avg and stdev per tick.
- a overall of all live candles processed avg and stdev of the deltas processed.
Cumulative Volume DeltaCumulative Delta Volume is one of the key analysis in figuring out the Volume Price Action dependencies
Its very Intuitive in nature,
The below image shows how it is computed!
Enjoy

[co.n.g] - Simple CVD over MAThis Single Volume Delta (SVD), respectively Cumulative Volume Delta (CVD) is a really simple script computing the difference of the volume of the actual in comparison the the volume of the "Calculation Bars Threshold", calculated by smoothing through a simple moving average - the "CVD MA Smoothing".
Therefore, if the "Calculation Bars Threshold" and the "CVD MA Smoothing" are set to 1, the script will display the difference of the actual compared to the previous candle;
furthermore, if the "Calculation Bars Threshold" is set to 3 and the "CVD MA Smoothing" is set to 14, then the indicator will display the the summed difference of the past 3 values, smoothed over a period of 14 candles.
This indicator may also be set to a different time frame, allowing multi time frame analysis; f.e. if you're going to set a lower time frame than the actual, the deltas of the lower time frame will be displayed and will be showing the volume trend of the lower time frame; if you're going to set a higher time frame, this is respectively working as described.
To understand volume and price action, it is - imho - especially helpful to display the volume of higher time frames to visualize the "Where the heck am I and what are the big players doing?"
This indicator is coloring the histogram in green as positive, red as negative and gray as indecisive CVD.
Hopefully, this will be helpful in your VSA and your trading decisions.
Cheers,
Constantine
p.s.: I am also working on a far more sophisticated version of SVD/CVD, so stay tuned!

RSI+BB -=[ CryptDude ]=-RSI+BB
RSI + Bollingerbands
Credits
First of all I'd like to credit my trading pal, Vitaly905 who is a fellow Whale Crew associate for discovering this approach via another FOREX YouTuber, and turned me onto the general strategy. I created my own style template of the combo with the transitional trend color changes. My scripting skill were a little rusty at the time, so spoke with another trading friend in Whale Crew, MartyMcFly, and he put the script together for it and I generally went through, changed some nomenclature and touched some of the code as well. My other Whale Crew partner, Sydnet helped configure the alerts.
We're proud of it and hope you enjoy it. Just wanted to give credit to the collaborative effort.
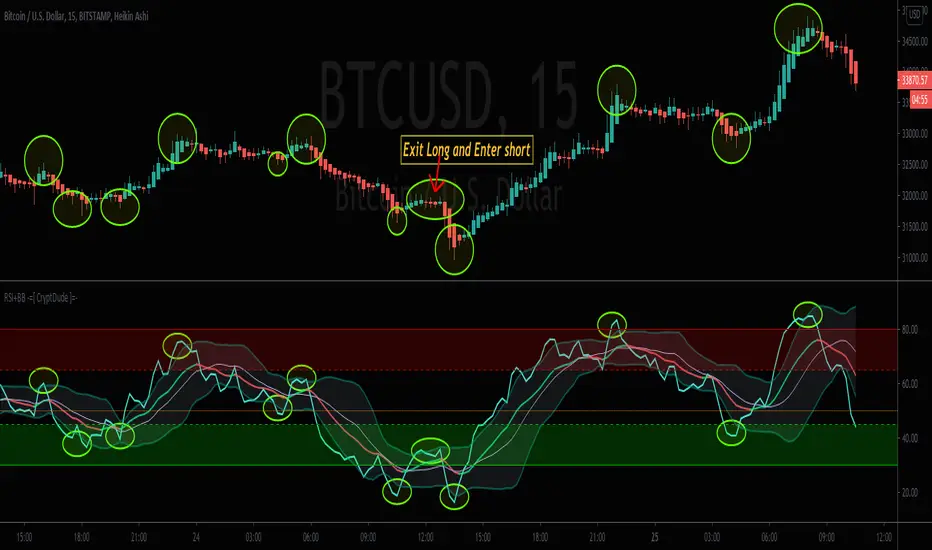
The Strategy
The key to this strategy is to look for when the RSI gets very close or crosses above or below the Bollinger bands as indications of potential pivot ranges. You can also set Alerts for when the Bollinger Bands are crossed
Things to be aware of
(1) During the RSI peaks, be aware that most of them have a double hump or double tops on the RSI when they are close to or have breached the BB. Sot that means there's likely going to be an interval of time after the firs peak or dip before it finally pivots. This takes a little adjustment, but after a while you start to recognize the pattern. They almost look like an "M" on the tops and a "W" shape on the bottom; tilted in one direction or the other.
(2) Also during those peaks or dips, the RSI may move some, but price can move quite a bit more. So it's up to you, the trader, to trust your own analysis, by checking other known confluent momentum indications as to WHEN you should execute your entry, accordingly.
(3) There is a lot of consistency in this strategy after you spend more time getting intimate with it.
(4) I may ad convergence indication to it later, but It may pollute the chart more than being useful, as I don't have issue finding convergence.
(5) Set your own rules as to what constitutes an entry confirmation, which can be a confluence of other momentum indicators along with the RSI+BB.
Below is an example of the strategy with the price action
Happy trading!!
Your trading pal,
~ CryptDude
Volume+DeltaIndicator shows Volume and Delta, if Delta is positive - its green, if negative - its red

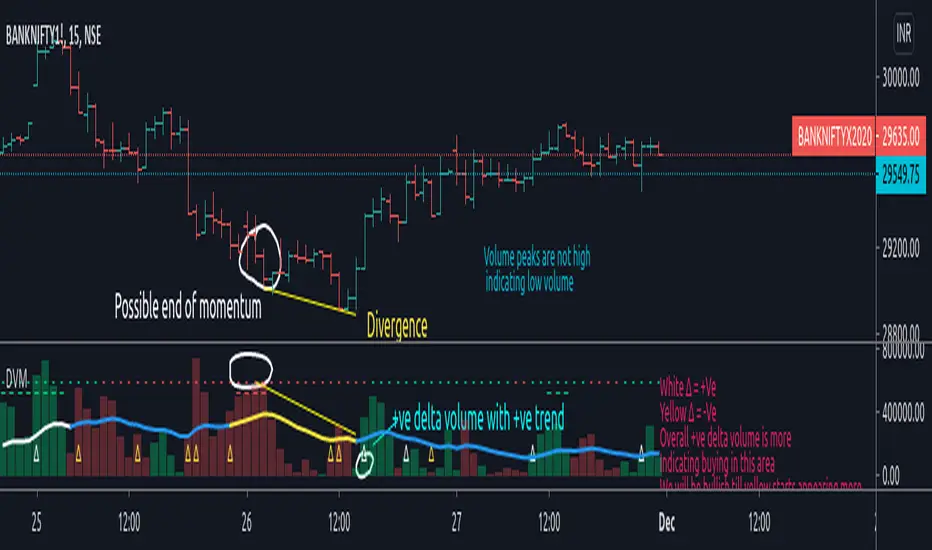
Delta Volume Moves Today I propose an indicator to measure volume trend and change in buying and selling pressure (Delta). This is a synthetic mechanism to derive delta volume and then formulate rest so its not like typical delta volume indicator either.
So what is it exactly?
Indicator first calculates the cumulative delta volume , then filters it through filters applied in the calculation to identify major volume changes/pressure change, it also keeps track of overall trend based on 20 SMA filter as basis and 2 stdv movement from it applied on cumulative delta volume . This is plotted on top side of the indicator with "-" and "_" plots. Color lime indicates bullish trend and color red indicates bearish trend .
Delta filter is dependent on the factor input which is user defined, here by default it is 1.5, which will indicate overall significant change in pressure in volume in that particular direction, please note that higher the number lower the delta plots you will have to count it, and number below 1 would be useless as it would not be measuring "increase" in delta volume but decrease. So it is advised to keep it around 1.5 to be reasonably useful measure. This is plotted with "∆" character on the volume bars.
How can we use this to our advantage?
As you can see on chart, its able to identify possible reversal or tops/bottoms of the price action, while this is the primary use it is also worth noting that in comparison to the regular volume indicator which is dependent on the candle price close with respect to its open, this is much better visual representation of the sell or buy volume .
When you apply delta filters and trend filters to an already easy to read volume indicator, it is making significant impact on indicators ability to identify major volume changes and trend changes with respect to cumulative delta volume .
Authors note:
Please note that this study is experimental and published for the educational purpose, if you decide to use it to monitor market it is advised that you put in some time to observe correlations between this and price action before you start trading it.
Also, while on chart this is showing impressive tendency to identify tops and bottoms, its a very limited view. Please keep in mind to check this across different scripts which have good qty of volume .
Author takes no responsibility of your loss or profit from this.
Past performance is no assurance of future performance.
Regards.
Delta Volume Weighted - IntradayResets at the start of the day's session (9:50 am on the ASX).
Takes the first candle and checks if its a green candle (close > open), and adds the volume to a total (which starts at 0 at the start of the day).
Subtracts it if the candles in red.
Continues to do this along with all the candles.
The volume is also multiplied by the difference between open and close so that large candles with large volume have more weight and move the indicator more.

Perp vs Spot Delta (Bybit-CB)Simple script showing the delta of Bybit BTCUSD perp vs Coinbase BTCUSD spot. Orange positive candles show bybit is higher, blue negative candles show Coinbase is higher.

[A618] Liquidity Tracker and Iceberg Detector V2 ProIntroduction
We all know markets and market makers work over liquidity concepts, Liquidity is what makes market cyclic and drives it!
The aim of this experimental Indicator is to identify the liquidation points and levels where the big players are actually playing.
When you’re trading financial markets, liquidity needs to be considered before every position is opened or closed. This is because a lack and increase of liquidity is often associated with increased risk.
You need to be able to put probabilities in your favour, understanding liquidity levels in the market is always a good to know thing for one to judge / estimate whether the market is behaving according to the analysis or not.
How Can you Get this Indicator
Just send me up a private message, (Please use comment box only for constructive comments, and community improvement)
What are icebergs
If you see the DOM data, you will see lots of orders on both side (buyers/sellers), Its just the tip of the iceberg that we are able to see in the order flow, the aim of the iceberg detection concept over here is to estimate when a large order is executed and in what direction.
What is the Use of Trendlines
Trendlines basic configuration is 50 back pivot levels, you can also configure it to 20, 10 depending on how fast you wanna track things
Use trendlines to detect the icebergs happening above and below it conjure it with your study.
Provision for Alerts
You can configure alerts over iceberg detection
Which market it will work and on what timeframes
This indicator will work for any liquid market,
Stocks, forex, Bitcoins etc
Since the order flow dynamics remains pretty much the same everywhere,
For efficient utilisation, use these timeframes
15s, 30s, 1 min, 3 min, 5 min, 15 min, 30 min, 1Hr

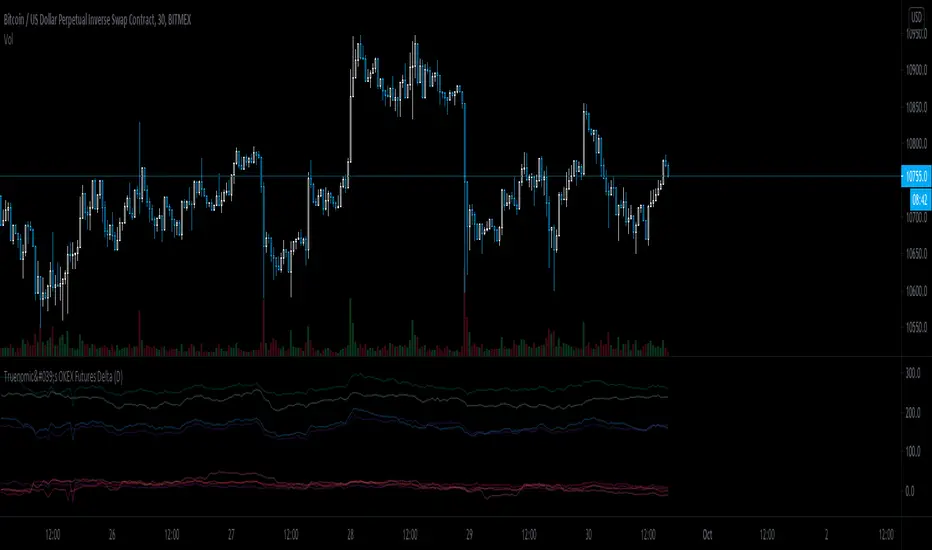
Truenomic's OKEX Futures DeltaA very simple and basic indicator for tracking the delta of all futures from the OKEX exchange.
Delta Volume v2.1 by kernel_phiOld Version:
The source code of this script is now open. Feel free to modify it.
*** Not real-time. The indicator will be calculated only after a bar is closed. ***

Delta Divergence(modified)Modified Volume Delta Divergence indicator originally made by @dutta.anupam.02, with some visual modifications. First numbers show delta others are bid and ask volume

Futures/Perpetuals DeltaBackwardation/Contango of OKEX, HUOBI, BITMEX, DERIBIT futures compared to XBTUSD.
Results indicate that backwardation can mark bottoms in price action.

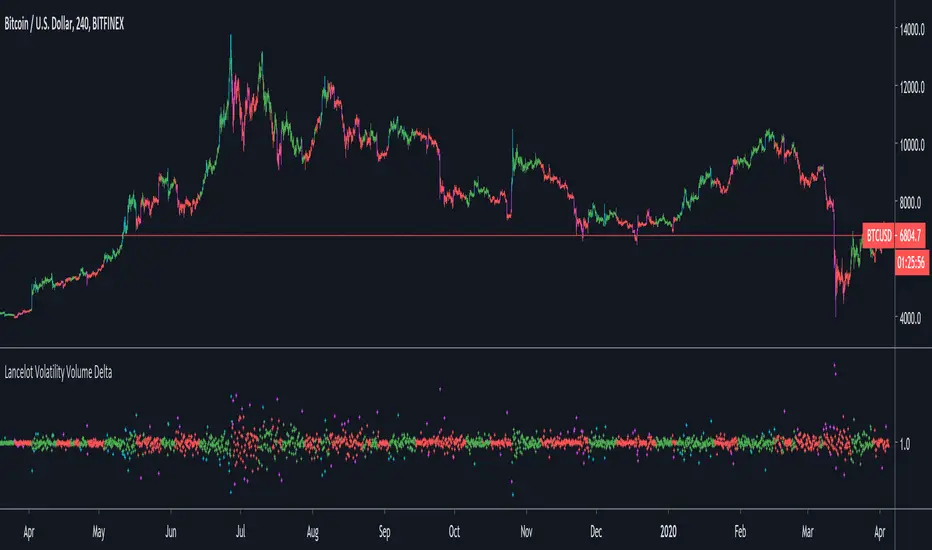
Lancelot Volatility Volume DeltaThis indicator calculate the delta of the volatility adjusted on-balance volume.
This could be use as a filter or trigger in a system.