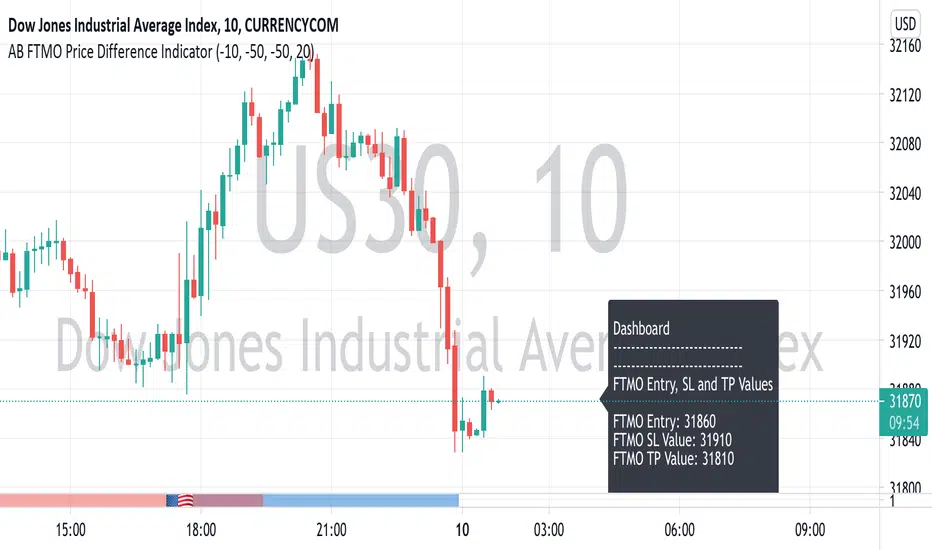
AB FTMO Price Difference IndicatorI know, it was a hassle, calculating each SL and TP values on your MT4 or MT5, after you decide to enter a trade on FTMO (or any other broker really).
Especially if your broker values are way off from your TradingView chart.
Here's a dynamic dashboard that shows you your entry, stop loss and your take profit values for your trading platform.
Just enter the current price difference in pips and your SL/TP values on the settings page, then let your dashboard do the rest.
It shows you the values based on the last closed candle.
Enjoy.
Dynamic
Dynamic EnvelopeA dynamic envelope is designed to build an actual envelope that consider the volatility of a trading instrument.
A dynamic envelope is an ideal counter-trend indicator, it takes into account the nature of the movement of the instrument. At the same time, it does not require adjustment of parameters over time, it adjusts itself to volatility.
The indicator can be effectively used on any markets and instruments.
Динамический конверт предназначен для построения актуального конверта, который учитывает волатильность торгового инструмента.
Динамический конверт - это идеальный контртрендовый индикатор, он учитывает характер движения инструмента. При этом он не требует подгонки параметров со временем, он сам подстраивается под волатильность.
Индикатор можно эффективно использовать на любых рынках и инструментах.

Hullk Autobot
HULLK AUTOBOT
• Long entry positions
• Profit targets
• Stop loss targets
Description
The Fast Signal Line is an extremely fast and smooth moving average indicator, designed to eliminate
the lag typically associated with traditional moving average indicators.
When the price is trending upward the Fast Signal Line is colored light grey then turns orange when
price is trending downward.
How to Trade
It is good practice to assess multiple timeframes to ensure you are mindful of the larger picture. The
15 minute and 4-hour charts are worthy of note.
In addition to displaying the current macro trend, the Fast Signal Line can also be used for judging
entries and exits from trades.
Aggressive traders may choose to trade based on the first touch of the Fast Signal Line whereas
conservative traders may wait for the signal line to be broken and established as a line of support or
resistance before taking action.
Indicator Configuration
The Fast Signal Line’s display and colors can be changed by modifying the ‘Fast Signal’ options in
the indicator’s style settings;
Volume Line
Description
The Volume Line uses short-term historic volume data to determine the balance between demand
and supply.
When volume is supporting price the Volume Line is colored yellow then turns red when the volume is
rejecting the price.
How to Trade
While the Volume Line can indicate support and resistance levels, it is best used to confirm bias
when using the Fast Trend Line indicator to enter or exit trades and can also be used by traders for
stop-loss or take profit entries.
Indicator Configuration
The Volume Line’s display and colors can be changed by modifying the ‘Volume’ options in the
indicator’s style settings;
Trend Line
Description
The Trend Line is a Weighted Moving Average indicator based on a fixed period and is used to
identify the current trend of the market.
When supporting the price, the Trend Line is colored green then turns red when rejecting the price.
How to Trade
Timeframes of 4H and above are best used to determine the current trends, while shorter timeframes
can be used for entering and exiting trades when the trendline is turning in the relevant direction.
Indicator Configuration
The Trend Line’s display and colors can be changed by modifying the ‘Volume’ options in the
indicator’s style settings;
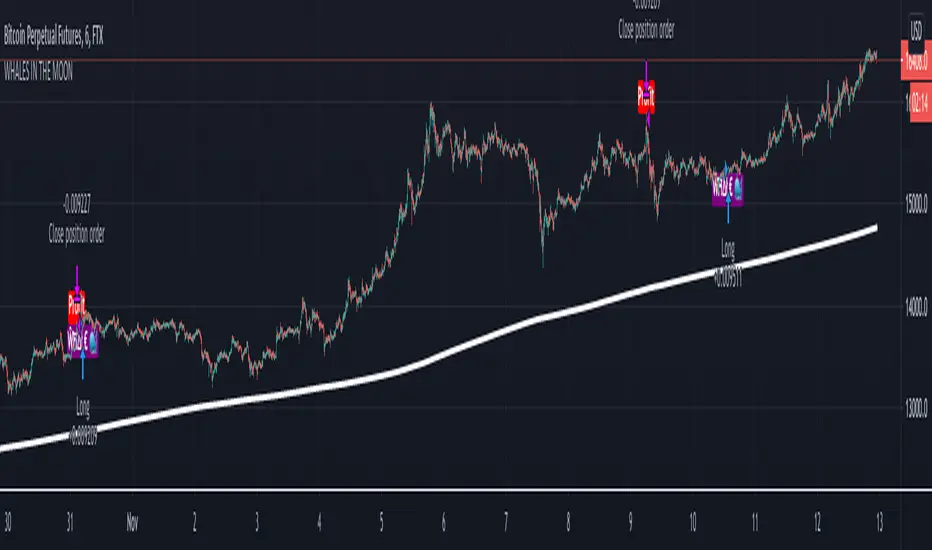
Whales Volume Line
Description
The Whales Volume Line uses long-term historic volume data to determine the balance between
demand and supply dictated by large/institutional traders in the market.
When volume is supporting price the Volume Line is colored yellow then turns red when the volume is
rejecting the price.
How to Trade
While the Whale Volume Line can indicate support and resistance levels, it is best used to confirm
bias when using the Fast Trend Line indicator to enter or exit trades and can also be used by traders
for stop loss or take profit entries.
Indicator Configuration
The Whales Volume Line’s display and colors can be changed by modifying the ‘Whales Volume’
options in the indicator’s style settings;
Trendline Direction Line
Description
The Direction Line is a Weighted Moving Average indicator based on a longer period than the Trend
Line and is used to identify the current direction of the market.
The Direction Line indicator is colored purple when the market direction is up trending and red when
downtrend.
How to Trade
Timeframes of 4H and above are best used to determine current trend, while shorter timeframes
can be used for entering and exiting trades when the trendline is turning in the relevant direction.
Indicator Configuration
The Trendline Direction’s display and colors can be changed by modifying the ‘Trendline Direction’
options in the indicator’s style settings;
Channel Line
Description
The Channel Line is a Least Squares Moving Average indicator based on a fixed period and is used as
a crossover signal to identify bullish or bearish trends ahead of traditional simple or exponential
moving averages.
The Channel Line indicator is colored cyan when the market direction is up trending and red when
downtrend.
How to Trade
When the Channel Line changes to an uptrend along with a recovery in price, traders can use this as a
signal to enter a long position. If the signal changes to a downtrend along with a fall in price, traders
can use this to enter a short position.
Indicator Configuration
The Channel Line’s display and colors can be changed by modifying the ‘Channel’ options in the
indicator’s style settings;
Dip & Pop Signals
Description
Dip and Pop signals occur when the price is likely to make a counter-trend movement before continuing
its direction.
In a bullish trend, a Dip signal suggests that price will move down to test support before continuing,
whereas a Pop signal suggests that price will move up. In a bearish trend, a Pop signal suggests that
price will move up to test resistance before continuing, whereas a Dip signal would suggest price is
likely to continue the trend.
How to Trade
Dip and Pop signals should be used as notification for preparation rather than a call to action as the price
can move unpredictably during volatility.
Indicator Configuration
The Dip & Pop’s display and colors can be changed by modifying the ‘PoP’ & ‘DIP’ options in the
indicator’s style settings;
Entry & Exit Signals
Description
Entry and Exit Signals are indications of when to open and close trades but should be used in
conjunction with other indicators to interpret their meaning.
How to Trade
While Entry and Exit signals can be interpreted as simple long and short entries, their meaning does
change based on trend circumstance. An Entry signal is typically printed price is starting to see a
positive reaction after a drop.
When the Fast Signal, Trend, and Trend Direction lines are indicating an upward trend an Entry signal
signifies a good place to enter a long or exit a short position. However, if the lines are not suggesting
an upward trend then a long signal indicates that any long order should be exited as any new long
orders in this scenario are risky as you would be opening a position at resistance.
Likewise, when indicator lines are indicating a downward trend and an Exit signal is received this
signifies a good place to enter a short or exit a long position. However, if the signal is against the
trendlines then this is a riskier short into support.
Indicator Configuration
The Entry & Exit’s display and colors can be changed by modifying the ‘Entry’ & ‘Exit’ options in the
indicator’s style settings;
If you have any questions or are looking for access please send me a private message.
Thx for your time and support

DMT 369 DRAGRONFLY StudyDragonfly Study version plus statistics panel
Successful traders trade with a fixed plan and without emotion, but this a lot harder than many new traders think. Many never master this skill and suffer continual drawdowns on their accounts as they overtrade high leverage positions in volatile markets.
ĐΜŦ Autobot resolves this issue by taking the human element out of the equation, allowing full automation of trades using TradingView alerts to trigger your favourite trading bot, such as Alertatron or 3Commas.
Being a Trend Reversal Indicator based on Volatility & Average True Range , ĐΜŦ Autobot is designed to identify spots in the market that offer suitable scalp and swing trade opportunities.
Due to popular demand we have expanded our ĐΜŦ Autobot product line to include the new ĐΜŦ Autobot Dragonfly 3-6-9 Edition which combines DMT with 3-6-9 Vortex mathematics, our Titan indicator and a multi-ladder scalping strategy to ensure you maintain a preferable average entry when price action moves against your position.
Indicator View
It its default state the DMT Autobot Dragonfly indicator displays key signal information, such as:
• Support & resistance range lines
• Titan Body Small & Large Time Frame lines
• Long & Short entry positions
• Long & Short position ladders
• Profit targets
Dragonfly displays a range between resistance (upper line) and support (lower line) on the chart.
Once the price is granted support in the range the lower line will turn green. As price action develops it will make repeated attempts to test support. If support holds price will attempt to test the resistance line (red).
When resistance is broken and the price is above the upper line, the line will turn blue confirming the bullish momentum and provide a potential buy opportunity.
Price action will make attempts to test the upper line as support and will keep rising while support is granted.
Once support is lost the upper line will become red once more. As price action develops it will make repeated attempts to test resistance. If resistance holds, the price will attempt to test the support line (green).
When support is broken and the price goes below the lower line, the line will turn red confirming the bearish momentum and provide a potential selling opportunity.
Price action will make attempts to test the lower line as resistance and will keep dropping while resistance is granted.
Titan Body
The Titan Body Small & Large time frame options in the indicator add additional trendlines to the chart to provide further clarity and confirmation to the Support & Resistance range indication.
Once price is granted support by the Small Time Frame trend line the line will turn green. As price action develops it will make repeated attempts to test the Small Time Frame support. Once the price is below the Small Time Frame trend line , the line will turn red and can act as resistance in a trend reversal.
When price is granted support by the Large Time Frame trend line the line will turn cyan. As price action develops it will make repeated attempts to test the Large Time Frame support. Once the price is below the Large Time Frame trend line , the line will turn orange and can act as resistance in a trend reversal.
The Titan Body enabled and customized in the indicator’s style settings,
Alert indicators
DMT Autobot Dragonfly Edition generates signals that can be used to scalp trade a volatile asset.
Signals are enabled and customized in the indicator’s input settings Additional options can be found in the options, but it is recommended that these are left at the default, as shown below. The indicator generates many
Entry and Profit levels can be disabled or customized in the indicator’s style settings,
Tradingview Alerts
Using Tradingview alerts, DMT Autobot Dragonfly signals can be used to trigger a trading bot.
To trigger a long or short position, set the Tradingview Alert Condition to DMT 369 Dragonfly and select the long or short option.
It is recommended that long or short positions are configured to trigger Once Per Bar Close
Ladders can also be triggered using alerts. To trigger a ladder order, set the Tradingview Alert Condition to DMT 369 Dragonfly and select the appropriate Long or Short ADD option that is to be triggered by the relevant values defined in the indicator’s configuration.
It is recommended that ladder orders are configured to trigger Once Per Bar,
To trigger a take profit order, set the Tradingview Alert Condition to DMT 369 Dragonfly and select the Long or Short TP option that is to be triggered by the relevant values defined in the indicator’s configuration.
Take profit orders can be configured as Once Per Bar Close or Once Per Minute.
If you wish to trigger a take profit signal immediately when the indicator’s defined take profit value is achieved, then use the Once Per Bar option.
Selecting Once Per Bar Close to generate a take profit signal is a gamble as the candle may close far away from the defined profit target – positive or negative.
While stops can be used, they are not applicable to the recommended ladder strategy.
Ladder Strategy
The DMT Autobot Dragonfly indicator always turns an underwater position into a win by utilizing a ladder strategy.
By using the recommended defaults, the indicator will trigger ladder orders at 3%, 6% & 9% using increasing order sizes,
Order sizes increase exponentially to ensure a good average price is maintained. If you are not using DMT Autobot Dragonfly signals to trigger ladder or take profit orders, please ensure your trading bot is configured to recalculate the new ladder entry and profit target based on the new average position entry price as each ladder is filled.
If you are using DMT Autobot Dragonfly on a leveraged asset, please ensure the leverage position is configured suitably so that your position is not liquidated if the price rapidly moves against you.
If u are looking for more information or access to the script please private msg me in trading view chat thx for support

DMT 369 DRAGRONFLY STRATSuccessful traders trade with a fixed plan and without emotion, but this a lot harder than many new traders think. Many never master this skill and suffer continual drawdowns on their accounts as they overtrade high leverage positions in volatile markets.
ĐΜŦ Autobot resolves this issue by taking the human element out of the equation, allowing full automation of trades using TradingView alerts to trigger your favourite trading bot, such as Alertatron or 3Commas.
Being a Trend Reversal Indicator based on Volatility & Average True Range, ĐΜŦ Autobot is designed to identify spots in the market that offer suitable scalp and swing trade opportunities.
Due to popular demand we have expanded our ĐΜŦ Autobot product line to include the new ĐΜŦ Autobot Dragonfly 3-6-9 Edition which combines DMT with 3-6-9 Vortex mathematics, our Titan indicator and a multi-ladder scalping strategy to ensure you maintain a preferable average entry when price action moves against your position.
Indicator View
It its default state the DMT Autobot Dragonfly indicator displays key signal information, such as:
• Support & resistance range lines
• Titan Body Small & Large Time Frame lines
• Long & Short entry positions
• Long & Short position ladders
• Profit targets
Dragonfly displays a range between resistance (upper line) and support (lower line) on the chart.
Once the price is granted support in the range the lower line will turn green. As price action develops it will make repeated attempts to test support. If support holds price will attempt to test the resistance line (red).
When resistance is broken and the price is above the upper line, the line will turn blue confirming the bullish momentum and provide a potential buy opportunity.
Price action will make attempts to test the upper line as support and will keep rising while support is granted.
Once support is lost the upper line will become red once more. As price action develops it will make repeated attempts to test resistance. If resistance holds, the price will attempt to test the support line (green).
When support is broken and the price goes below the lower line, the line will turn red confirming the bearish momentum and provide a potential selling opportunity.
Price action will make attempts to test the lower line as resistance and will keep dropping while resistance is granted.
Titan Body
The Titan Body Small & Large time frame options in the indicator add additional trendlines to the chart to provide further clarity and confirmation to the Support & Resistance range indication.
Once price is granted support by the Small Time Frame trend line the line will turn green. As price action develops it will make repeated attempts to test the Small Time Frame support. Once the price is below the Small Time Frame trend line, the line will turn red and can act as resistance in a trend reversal.
When price is granted support by the Large Time Frame trend line the line will turn cyan. As price action develops it will make repeated attempts to test the Large Time Frame support. Once the price is below the Large Time Frame trend line, the line will turn orange and can act as resistance in a trend reversal.
The Titan Body enabled and customized in the indicator’s style settings,
Alert indicators
DMT Autobot Dragonfly Edition generates signals that can be used to scalp trade a volatile asset.
Signals are enabled and customized in the indicator’s input settings Additional options can be found in the options, but it is recommended that these are left at the default, as shown below. The indicator generates many
Entry and Profit levels can be disabled or customized in the indicator’s style settings,
Tradingview Alerts
Using Tradingview alerts, DMT Autobot Dragonfly signals can be used to trigger a trading bot.
To trigger a long or short position, set the Tradingview Alert Condition to DMT 369 Dragonfly and select the long or short option.
It is recommended that long or short positions are configured to trigger Once Per Bar Close
Ladders can also be triggered using alerts. To trigger a ladder order, set the Tradingview Alert Condition to DMT 369 Dragonfly and select the appropriate Long or Short ADD option that is to be triggered by the relevant values defined in the indicator’s configuration.
It is recommended that ladder orders are configured to trigger Once Per Bar,
To trigger a take profit order, set the Tradingview Alert Condition to DMT 369 Dragonfly and select the Long or Short TP option that is to be triggered by the relevant values defined in the indicator’s configuration.
Take profit orders can be configured as Once Per Bar Close or Once Per Minute.
If you wish to trigger a take profit signal immediately when the indicator’s defined take profit value is achieved, then use the Once Per Bar option.
Selecting Once Per Bar Close to generate a take profit signal is a gamble as the candle may close far away from the defined profit target – positive or negative.
While stops can be used, they are not applicable to the recommended ladder strategy.
Ladder Strategy
The DMT Autobot Dragonfly indicator always turns an underwater position into a win by utilizing a ladder strategy.
By using the recommended defaults, the indicator will trigger ladder orders at 3%, 6% & 9% using increasing order sizes,
Order sizes increase exponentially to ensure a good average price is maintained. If you are not using DMT Autobot Dragonfly signals to trigger ladder or take profit orders, please ensure your trading bot is configured to recalculate the new ladder entry and profit target based on the new average position entry price as each ladder is filled.
If you are using DMT Autobot Dragonfly on a leveraged asset, please ensure the leverage position is configured suitably so that your position is not liquidated if the price rapidly moves against you.
If u are looking for more information or access to the script please private msg me in trading view chat thx for support

Chonky Floating R:RVisualize the floating R:R of an active position.
Input the stop loss and target to return live R:R

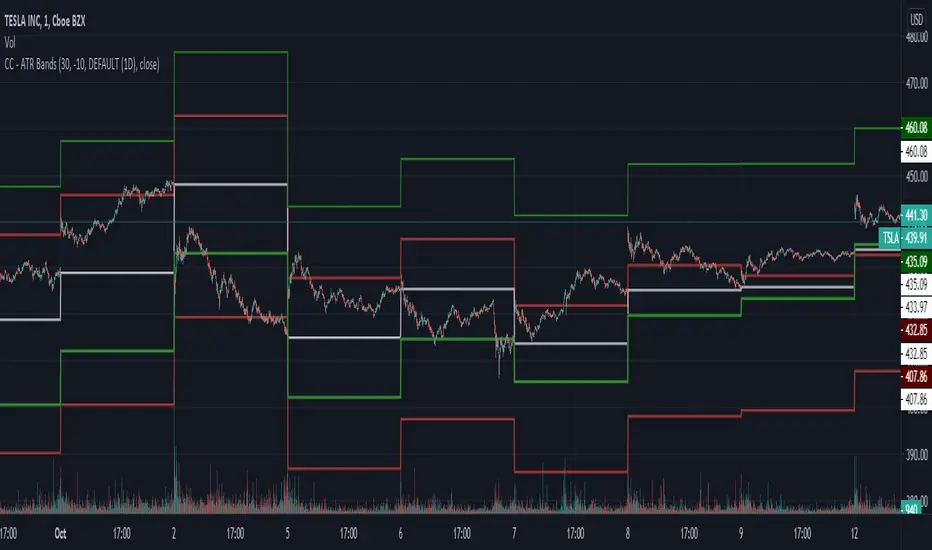
CC - ATR BandsPlots ATR bands around candles at any HTF resolution you desire, taken in through the inputs. The white line represents the open of the HTF, the red and green the expected boundaries. You can use the risk tolerance slider up/down to adjust how risky you want to be with the ATR bands.
I am not responsible for outcomes using this method, indicator or anything else. Please do your own due diligence.
WMA DynamicDemonstration of a new feature that allows to change lookback period dynamically, used with WMAs. Rather than WMA any one can be used here (SMA, Alma,...) as long as its second argument supports dynamic change. If not, you have to use your own implementation of MA.

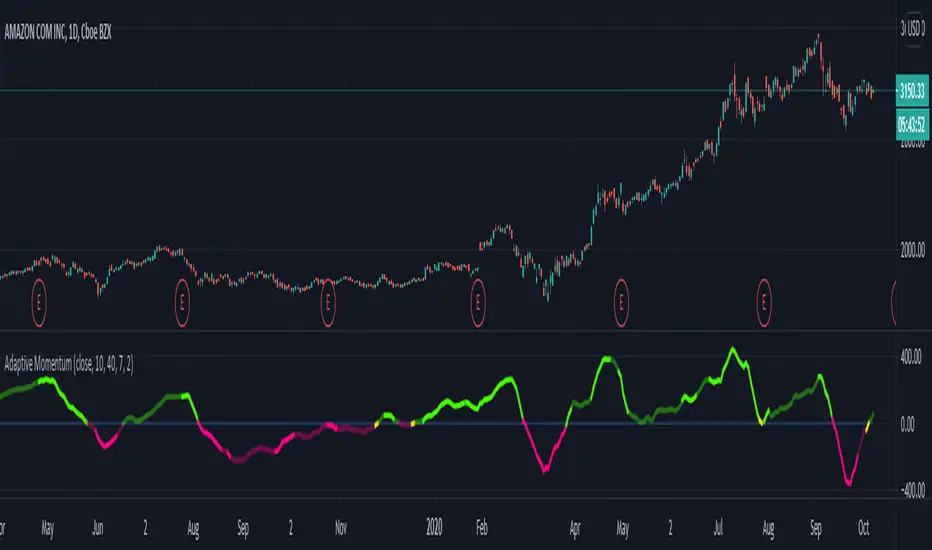
Adaptive MomentumAdaptive momentum indicator that uses the NEW Dynamic Length Arguments! Shows how to use volatility to shorten or lengthen the momentum period.
Based on pinescript blog example but with my own modifications.
Bright Green: Sharp movement above zero line
Bright Red: Sharp movement below zero line
Light Green: Slower movement above zero line
Light Red: Slower movement below zero line.
Yellow: Reversal might occur (near the zero line either side).
Thumb rule: Below zero line - SELL. Above zero line - BUY
McGinley Dynamic (Improved) - John R. McGinley, Jr.For all the McGinley enthusiasts out there, this is my improved version of the "McGinley Dynamic", originally formulated and publicized in 1990 by John R. McGinley, Jr. Prior to this release, I recently had an encounter with a member request regarding the reliability and stability of the general algorithm. Years ago, I attempted to discover the root of it's inconsistency, but success was not possible until now. Being no stranger to a good old fashioned computational crisis, I revisited it with considerable contemplation.
I discovered a lack of constraints in the formulation that either caused the algorithm to implode to near zero and zero OR it could explosively enlarge to near infinite values during unusual price action volatility conditions, occurring on different time frames. A numeric E-notation in a moving average doesn't mean a stock just shot up in excess of a few quintillion in value from just "10ish" moments ago. Anyone experienced with the usual McGinley Dynamic, has probably encountered this with dynamically dramatic surprises in their chart, destroying it's usability.
Well, I believe I have found an answer to this dilemma of 'susceptibility to miscalculation', to provide what is most likely McGinley's whole hearted intention. It required upgrading the formulation with two constraints applied to it using min/max() functions. Let me explain why below.
When using base numbers with an exponent to the power of four, some miniature numbers smaller than one can numerically collapse to near 0 values, or even 0.0 itself. A denominator of zero will always give any computational device a horribly bad day, not to mention the developer. Let this be an EASY lesson in computational division, I often entertainingly express to others. You have heard the terminology "$#|T happens!🙂" right? In the programming realm, "AnyNumber/0.0 CAN happen!🤪" too, and it happens "A LOT" unexpectedly, even when it's highly improbable. On the other hand, numbers a bit larger than 2 with the power of four can tremendously expand rapidly to the numeric limits of 64-bit processing, generating ginormous spikes on a chart.
The ephemeral presence of one OR both of those potentials now has a combined satisfactory remedy, AND you as TV members now have it, endowed with the ever evolving "Power of Pine". Oh yeah, this one plots from bar_index==0 too. It also has experimental settings tweaks to play with, that may reveal untapped potential of this formulation. This function now has gain of function capabilities, NOT to be confused with viral gain of function enhancements from reckless BSL-4 leaking laboratories that need to be eternally abolished from this planet. Although, I do have hopes this imd() function has the potential to go viral. I believe this improved function may have utility in the future by developers of the TradingView community. You have the source, and use it wisely...
I included an generic ema() plot for a basic comparison, ultimately unveiling some of this algorithm's unique characteristics differing on a variety of time frames. Also another unconstrained function is included to display some the disparities of having no limitations on a divisor in the calculation. I strongly advise against the use of umd() in any published script. There is simply just no reason to even ponder using it. I also included notes in the script to warn against this. It's funny now, but some folks don't always read/understand my advisories... You have been warned!
NOTICE: You have absolute freedom to use this source code any way you see fit within your new Pine projects, and that includes TV themselves. You don't have to ask for my permission to reuse this improved function in your published scripts, simply because I have better things to do than answer requests for the reuse of this simplistic imd() function. Sufficient accreditation regarding this script and compliance with "TV's House Rules" regarding code reuse, is as easy as copying the entire function as is. Fair enough? Good! I have a backlog of "computational crises" to contend with, including another one during the writing of this elaborate description.
When available time provides itself, I will consider your inquiries, thoughts, and concepts presented below in the comments section, should you have any questions or comments regarding this indicator. When my indicators achieve more prevalent use by TV members, I may implement more ideas when they present themselves as worthy additions. Have a profitable future everyone!

Dynamic Range here comes open source version of notorious JFT Indicator ( the indicator access you can get in some bucks ) on various telegram channels however they will not give code.
Now how it works
1. 2 ranges derived from indicator are supposed to be a consolidation zone and any close above or below is supposed to give a good move.
2. I personally consider it as may be addition to price analysis. ( i don't believe much in indicators,even simple MA gives fruitful results when there is good move in market )
3. Range can be drawn on chart with various resolution ( Daily/Monthly/Weekly )
PS: I coded myself based on data analysis shown by access only indicator. In case you use it for your publication don't forget to give credits.
Thanks,
daytraderph

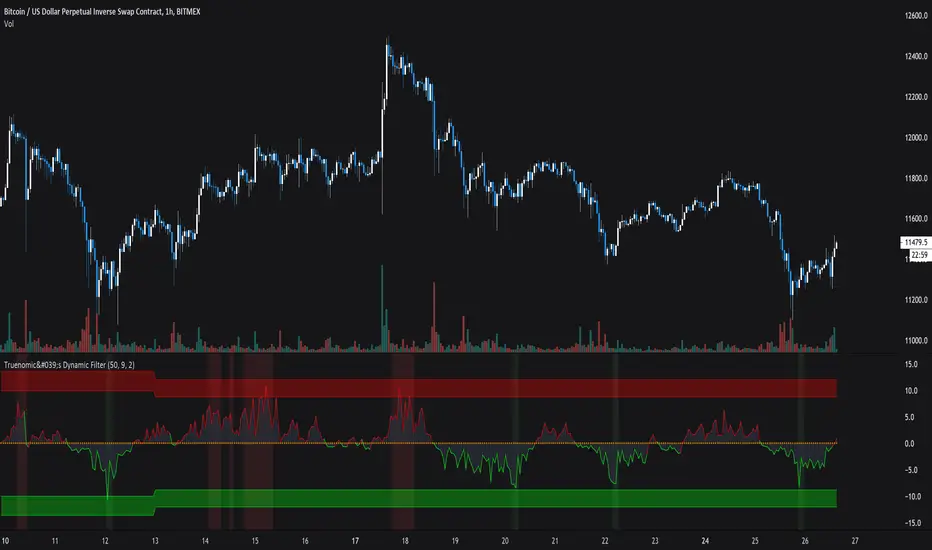
Truenomic's Dynamic FilterThis indicator is based on the deviation of the average price value given the dynamics of the volume.
Thus, receiving a negative value, the mood becomes more bullish. But when a colored background appears, it signals an even more amplified signal. The colored background is based on an abnormality.
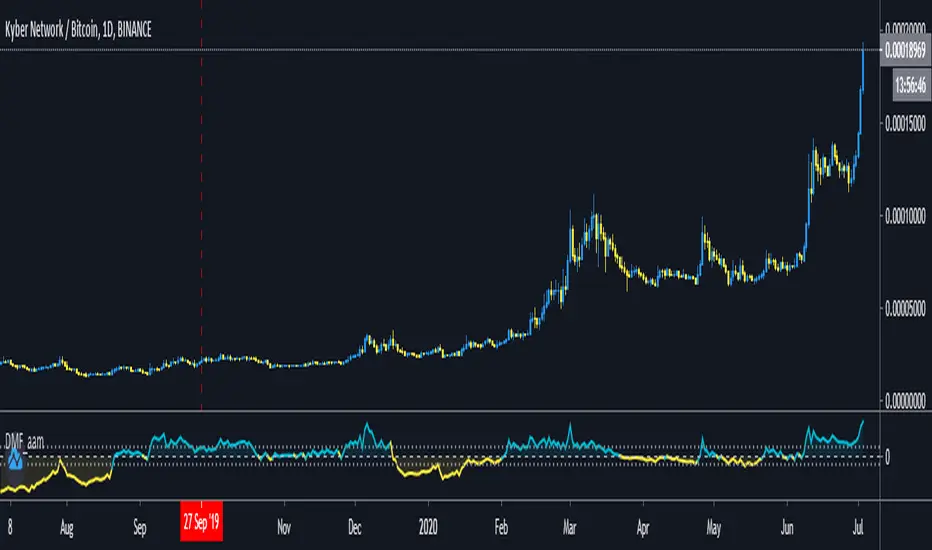
Dynamic Money Flow with color switch [aamonkey]"Dynamic Money Flow is a volume indicator based on Marc Chaikin's Money Flow with a few improvements.
It can be used to confirm break-outs and trends." (RezzaHmt)
This is the script from RezzaHmt called "Dynamic Money Flow".
All I did is the color change of the line because I find it easier to read that way.
Here you can find the original script explaining the theory behind this indicator:
Vicious Cycle 1.2 [CR] - Enhanced█ OVERVIEW
Vicious Cycle 1.2 is an advanced oscillator-based momentum indicator designed to identify high-probability reversal and continuation setups. This new version features adaptive threshold technology, visual trend state classification, and a higher timeframe alignment system to filter low-quality signals.
The indicator analyzes multiple timeframe components and market dynamics to generate a composite momentum score, which is then smoothed and compared against statistical thresholds. Unlike traditional static oscillators, Vicious Cycle adapts its sensitivity zones to current market conditions, reducing false signals during volatile periods and increasing responsiveness during consolidation.
█ FEATURES
Adaptive Threshold System
The indicator employs percentile-based threshold calculations that automatically adjust to recent market behavior. This ensures optimal signal generation across different instruments and market regimes without manual recalibration.
• Toggle between dynamic and fixed threshold modes
• Adjustable lookback period for threshold calculation (50-500 bars)
• Customizable percentile levels for sensitivity tuning
• Separate calibration for overbought and oversold zones
Visual Trend State Classification
Background coloring provides instant visual feedback on market condition strength without requiring analysis of indicator position. The six-state classification system combines oscillator position with signal line relationship to identify:
• Strong bullish momentum
• Moderate bullish bias
• Weak bullish condition
• Weak bearish condition
• Moderate bearish bias
• Strong bearish momentum
Higher Timeframe Trend Alignment
An optional filtering system analyzes higher timeframe trend direction to block counter-trend signals. Two modes are available:
• Single EMA Mode: Uses price position relative to a customizable moving average
• Dual EMA Mode: Employs fast and slow moving average crossover logic
The filter only permits long signals during bullish trends and short signals during bearish trends, significantly improving signal quality in trending markets.
Signal Detection Modes
Multiple signal generation methods accommodate different trading styles:
• Zone-Based Signals: Fires when oscillator crosses key threshold levels
• Signal Line Cross: Generates entries based on oscillator and signal line interaction
Comprehensive Alert System
Pre-configured alert conditions cover all major indicator events:
• Primary signal alerts (zone cross and signal line methods)
• Zone entry and exit warnings
• Extreme level notifications
• Trend filter status changes
• Convenience aggregators for "any long" or "any short" condition
█ HOW TO USE
Initial Configuration
The indicator ships with optimized default settings suitable for most instruments and timeframes. New users should observe the indicator's behavior for at least 50 signals before adjusting parameters.
1 — Add the indicator to your chart and leave default settings unchanged.
2 — Monitor signal generation and background color transitions for several trading sessions.
3 — Set up basic alerts using the "ANY LONG Signal" and "ANY SHORT Signal" conditions.
4 — After observation period, adjust sensitivity based on your instrument's characteristics.
Threshold Configuration
For instruments with higher volatility, increase the percentile values (example: 90/75 instead of 85/65). For ranging or lower volatility instruments, decrease percentile values (example: 80/60 or 75/55).
The lookback period controls how quickly thresholds adapt to changing conditions. Longer lookbacks (150-200) provide smoother adaptation, while shorter lookbacks (50-75) offer more responsive adjustments.
Trend Filter Guidelines
Enable the trend filter in clearly trending markets to reduce whipsaw trades. In ranging or choppy conditions, consider disabling the filter or using a shorter EMA period.
• For position trading: Use 200-period single EMA
• For swing trading: Use 150-period single EMA or 50/200 dual EMA
• For day trading: Use 100-period single EMA or 50/100 dual EMA
If the filter blocks all signals, the market may be ranging near the trend reference level. This is intentional behavior designed to keep you out of low-probability setups.
Signal Interpretation
Primary signals occur when the oscillator crosses threshold zones or intersects the signal line in extreme regions. The strongest setups combine:
• Signal generation in the expected direction
• Background color matching the trade direction (bright colors indicate high conviction)
• Trend filter alignment
• Price action confirmation at key support or resistance levels
█ NOTES
Alert Configuration
Alerts must be manually configured in TradingView and do not activate automatically. Access the alert menu by clicking the indicator name and selecting "Add Alert on Vicious Cycle 1.2...". Choose your desired condition from the dropdown menu and configure notification preferences.
We recommend starting with the aggregated "ANY" alerts rather than subscribing to all individual signal types, as this prevents notification overload during active market periods.
Dynamic Threshold Behavior
The adaptive threshold system requires sufficient historical data (minimum equal to the lookback period setting) to calculate percentiles accurately. During the initial bars, threshold values may appear unusual until adequate history accumulates. This is expected behavior and resolves automatically.
Performance Considerations
The indicator performs percentile calculations on each bar using array operations. While optimized for efficiency, users experiencing performance issues on lower-end devices may reduce the dynamic lookback period or disable the adaptive threshold feature to use fixed thresholds instead.
Compatibility
Vicious Cycle 1.2 is built on Pine Script version 6 and works on all instrument types and timeframes. The indicator does not repaint—all signals finalize at bar close. Historical signals remain stable and do not change with additional price data.
█ RISK DISCLOSURE
This indicator is an analytical tool and does not constitute financial advice. No indicator or trading system guarantees profitable results. Always employ proper risk management, position sizing, and stop-loss protocols. Past performance does not indicate future results. Users are responsible for their own trading decisions and outcomes.

DMT Ladder AutobotDMT Ladder Autobot Study it's unique super trend indicators that measure the volatility from the current price action with ATR recognitions and custom setting
in this version, we can find that DMT Autbot also Ladders long entry and short entry in 4 different steps you can set your calculations depending on your requirements and pair volatility calculations
to recover your entry DMT will turn loosing trading into winning trades with the right risk management.
1 long signals
4 ladder Long add signals
1 short signals
4 ladder short add signals
1 dynamic stop calculated from your average entry price
1 dynamic take profit calculated from your average entry price
Please pm me for access or larger explanations about the script or for full pdf tutorial
thx for your support
@Shenlong

TDI Traders Dynamic Index Alerts v1 - BonavestTo add this indicator to your charts:
Click the 'Add to Favorite Scripts' button down below this description.
This indicator places BUY and SELL tags on the chart using the Trader's Dynamic Index Indicator created by Dan Malone. This indicator is RSI based and is best used with ranging markets and will tend to create a trail of false signals (colored tags) when price is at it's extremes for a long period of time. Utlizing some other indicator such as a volume based one will assist in optimizing signals.
I have used this indicator with success for a few years, however I do not plan to support users of this indicator. It is offered as-is.
I use this indicator for:
Counter Trend Trading (colored tags)
Detecting Best Entries to Follow Trend (gray tags)
Trading Extreme Overbought/Oversold Price Areas (bright colored tags)
Detecting RSI Divergences (circles)
SETTINGS
Custom Timeframe - Default current chart timeframe. Custom selection only works when selecting a smaller timeframe than what is on the chart.
Lengthrsi - RSI Period
Lengthband - TDI Band Length
Lengthrsipl - TDI Price Line Length
Lengthtradesl - TDI Signal Line Length
There are 5 Built-In Notifications already created for you and are available by simply right clicking in the indicator area and selecting:
Condition: TDI Alerts v1
Then 1 of the 5 Alerts:
BUY Signal - All Green colored tags
SELL Signal - All Red colored tags
Gray BUY signal - All Gray BUY tags
Gray SELL signal - All Gray SELL tags
All Signals - All colored and gray tags
This adaptation was based off of the original code from the talented LazyBear.

Automatic Fibonacci Pivot Point S/R LevelsThis is a great tool to find confluences between Fibonacci Pivot point on various time frames.
Fib Pivots used
23.6%
38.2%
50%
61.8%
76.4%
100%
127.2%
141.4%
161.8%
200%
If price is between two levels on the update the lines shift
Yearly Pivots shown on 1m - Daily timeframes
PIvots recalculate on every day
Monthly pivots show on 1m - 60m timeframes
Pivots recalculate every hour
Weekly pivots show on 1m - 15m timeframes
Pivots recalculate every 30m
There is a lot of code but it got the job done.
It would easy to interchange if you prefer different types of pivots
It would be easy to add an on/off if you dont want so many levels on your smaller time frames
If anyone can streamline it please do

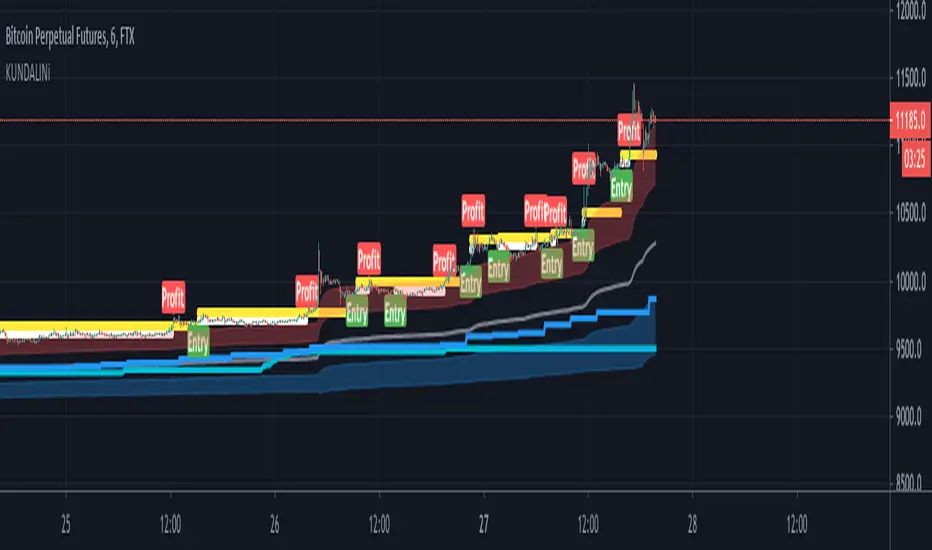
KUNDALINiThis is the STudy Version of The Kundalini is a technical indicator. Based on algorithm calculations, this indicator extrapolates the previous price for the next bar. Plus addition Multi time frame ATR volatility Reading environment for higher conditions
Here is how Dominator is calculated:
1. The study estimates the price projected for the next bar. The estimated price is based on the algorithm method.
2. The study extrapolates this value to find a projected price change for the next bar.
The resulting extrapolated value is shown as a histogram on a lower subgraph. By default, sections of the histogram where the extrapolated value is increasing are shown in green; sections corresponding to the decreasing value are shown in red.
Note: Value projection is purely mathematical as all calculations are based on algorithm averaging of previous values.
additional volatility models clouds on blue and red for bearish and bullish markets
Overlay True
The strategy includes 3 different adjustable levels for the ladder , plus automatic adjustable stop loss and takes profit calculated from your average entry price after each ladder adds.
Adjustable BAcktest Window.
1 long signals
3 ladder long add signals
1 short signals
3 ladder short add signals
1 dynamic stop calculated from your average entry price
1 dynamic take profit calculated from your average entry price
Please Private Msg me if you like more info about the script Full pdf available or if you need access to it
thx for your time and support
Dominator Ladder STUDYThis is the Study version of The Dominator is a technical indicator. Based on algorithm calculations, this indicator extrapolates the previous price for the next bar.
Here is how Dominator is calculated:
1. The study estimates the price projected for the next bar. The estimated price is based on the algorithm method.
2. The study extrapolates this value to find a projected price change for the next bar.
The resulting extrapolated value is shown as a histogram on a lower subgraph. By default, sections of the histogram where the extrapolated value is increasing are shown in green; sections corresponding to the decreasing value are shown in red.
Note: Value projection is purely mathematical as all calculations are based on algorithm averaging of previous values.
Overlay True
The Study includes 4 different adjustable levels for the ladder, plus automatic adjustable stop loss and takes profit calculated from your average entry price after each ladder adds.
Adjustable BAcktest Window.
1 long signals
4 ladder Long add signals
1 short signals
4 ladder short add signals
1 dynamic stop calculated from your average entry price
1 dynamic take profit calculated from your average entry price
Please pm me for access or larger explanations about the script or for full pdf tutorial
thx for your support

KundaliniThe Kundalini is a technical indicator. Based on algorithm calculations, this indicator extrapolates the previous price for the next bar. Plus addition Multi time frame ATR volatility Reading environment for higher conditions
Here is how Dominator is calculated:
1. The study estimates the price projected for the next bar. The estimated price is based on the algorithm method.
2. The study extrapolates this value to find a projected price change for the next bar.
The resulting extrapolated value is shown as a histogram on a lower subgraph. By default, sections of the histogram where the extrapolated value is increasing are shown in green; sections corresponding to the decreasing value are shown in red.
Note: Value projection is purely mathematical as all calculations are based on algorithm averaging of previous values.
Overlay True
The strategy includes 3 different adjustable levels for the ladder , plus automatic adjustable stop loss and takes profit calculated from your average entry price after each ladder adds.
Adjustable BAcktest Window.
1 long signals
3 ladder long add signals
1 short signals
3 ladder short add signals
1 dynamic stop calculated from your average entry price
1 dynamic take profit calculated from your average entry price
Please Private Msg me if you like more info about the script Full pdf available or if you need access to it
thx for your time and support
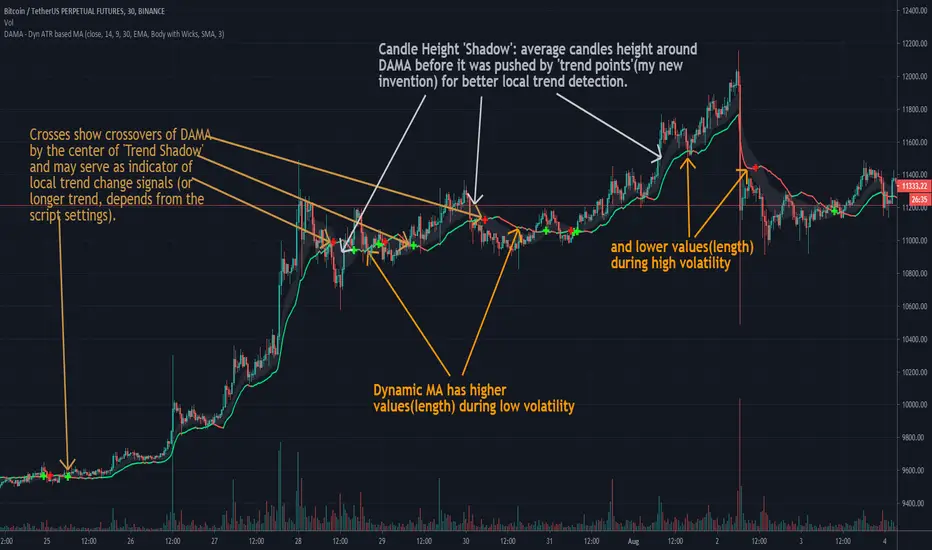
DAMA - Dyn ATR based MAEnglish description:
This is my approach to self fixing moving average that uses ATR to establish which MA length to use, considering current price volatility.
It has four settings values:
- ATR Length
- MA Length From
- MA Length To
- Choose Moving Average (2 options: SMA and EMA)
This script is invite-only for the members of our trading group (info in signature).
---------------------------------------------------------------------------------------------------
Polish description:
Niniejszy skrypt jest moim podejściem do zaprogramowania automatycznie ustalającej się średniej kroczącej, która przy wykorzystaniu ATR ustala z ilu świec wstecz obliczać cenę średnią, biorąc pod uwagę zakres zmienności ceny z danego okresu.
Skrypt posiada cztery ustawienia:
- ATR Length (długość Average True Range)
- MA Length From
- MA Length To
- Choose Moving Averaga (2 opcje: SMA i EMA)
Skrypt jest publikowany na zasadzie invite-only(konieczność przydzielenia dostępu na TradingView), a zatem dostępny jest tylko dla aktywnych użytkowników naszej grupy traderskiej, do której link można znaleść w mojej sygnaturze poniżej.
Dominator Ladder StrategyThe Dominator is a technical indicator. Based on algorithm calculations, this indicator extrapolates the previous price for the next bar.
Here is how Dominator is calculated:
1. The study estimates the price projected for the next bar. The estimated price is based on the algorithm method.
2. The study extrapolates this value to find a projected price change for the next bar.
The resulting extrapolated value is shown as a histogram on a lower subgraph. By default, sections of the histogram where the extrapolated value is increasing are shown in green; sections corresponding to the decreasing value are shown in red.
Note: Value projection is purely mathematical as all calculations are based on algorithm averaging of previous values.
Note: lower subgraph it's just for you to understand and view the waves during the Strategy process Study it's not included in this strategy.
Overlay True
The strategy includes 3 different adjustable levels for the ladder , plus automatic adjustable stop loss and takes profit calculated from your average entry price after each ladder adds.
Adjustable BAcktest Window.
1 long signals
3 ladder long add signals
1 short signals
3 ladder short add signals
1 dynamic stop calculated from your average entry price
1 dynamic take profit calculated from your average entry price

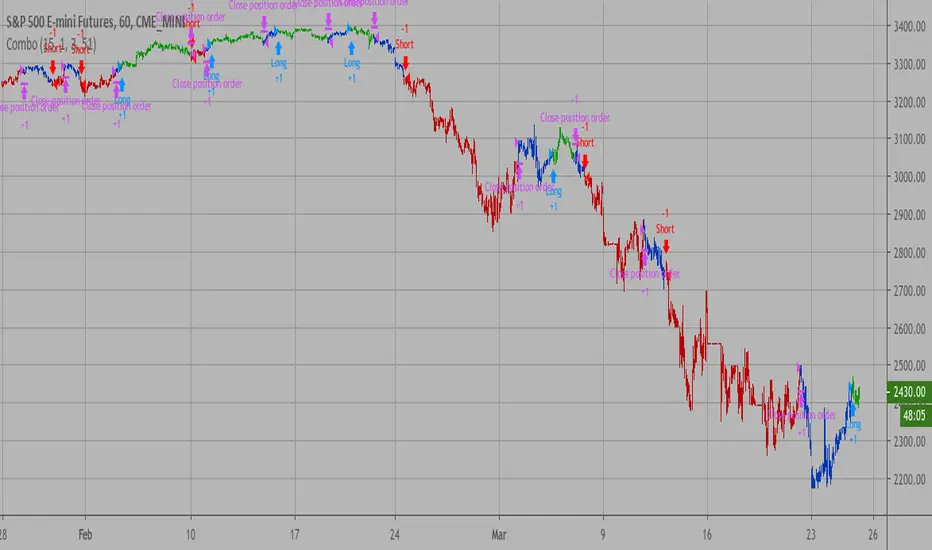
Combo Backtest 123 Reversal & Dynamic Pivot Point This is combo strategies for get a cumulative signal.
First strategy
This System was created from the Book "How I Tripled My Money In The
Futures Market" by Ulf Jensen, Page 183. This is reverse type of strategies.
The strategy buys at market, if close price is higher than the previous close
during 2 days and the meaning of 9-days Stochastic Slow Oscillator is lower than 50.
The strategy sells at market, if close price is lower than the previous close price
during 2 days and the meaning of 9-days Stochastic Fast Oscillator is higher than 50.
Second strategy
This Pivot points is calculated on the current day.
Pivot points simply took the high, low, and closing price from the previous period and
divided by 3 to find the pivot. From this pivot, traders would then base their
calculations for three support, and three resistance levels. The calculation for the most
basic flavor of pivot points, known as ‘floor-trader pivots’, along with their support and
resistance levels.
WARNING:
- For purpose educate only
- This script to change bars colors.