Dynamic Supply & Demand with 20,50 & 200 EMADynamic Supply & Demand with 20, 50 & 200 EMA is an intraday trend-following indicator designed for traders who want to identify key support and resistance levels along with trend direction.
Features:
Plots 20, 50, and 200 EMAs to indicate short, medium, and long-term trends.
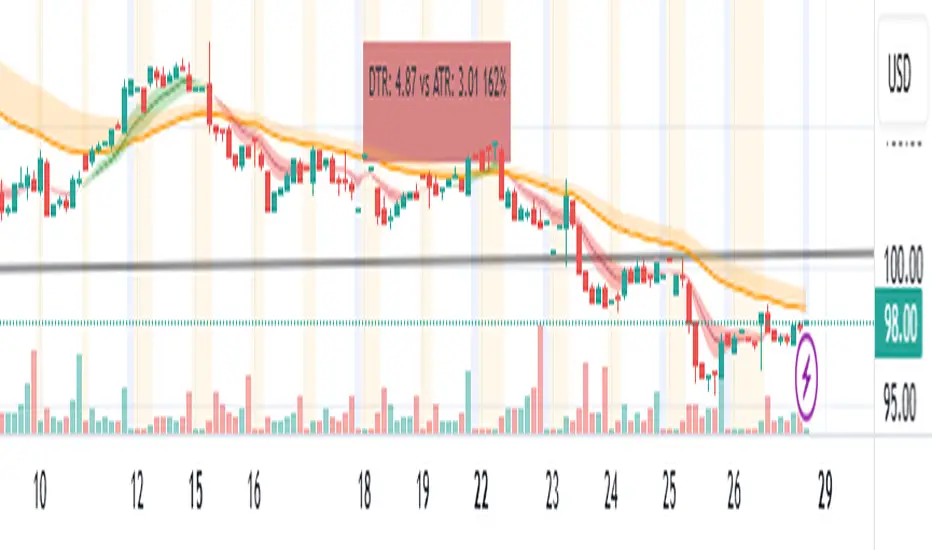
Calculates supply (resistance) and demand (support) zones dynamically based on recent price action and ATR for better accuracy.
Highlights bullish and bearish conditions using EMA alignment and RSI filter.
Includes a fixed bottom-right watermark to display author identity (@solomonselvam).
Fully compatible with Pine Script v5 and optimized for intraday charts.
How to use:
Use EMA alignment (20 > 50 > 200) and RSI > 55 for bullish setups.
Use EMA alignment (20 < 50 < 200) and RSI < 45 for bearish setups.
Look for price interaction with supply/demand zones for potential entries or exits.
Note: This indicator is best used in combination with proper risk management and price action confirmation.
Pine Script® indicator