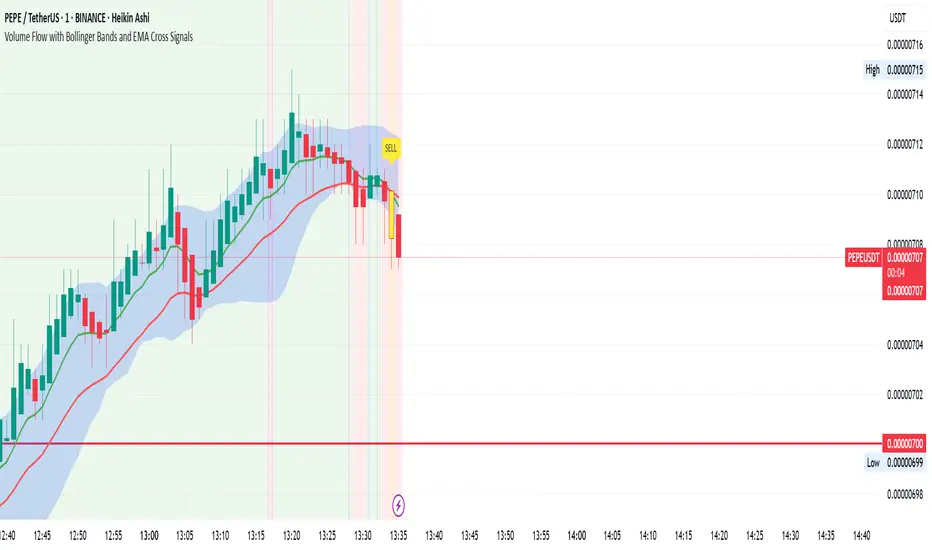
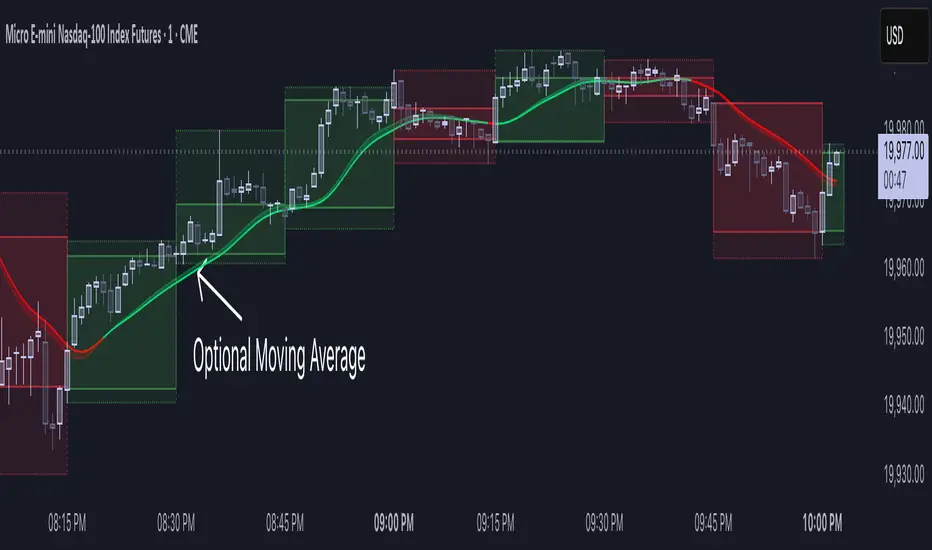
Visualisation tendancesThis script allows you to visualize the current trend of a financial asset.
It has two colors:
- Green for bullish phases
- Red for bearish phases
This allows you to instantly position yourself in the direction of the trend.
It also integrates Bollinger Bands, a volatility indicator.
This allows you to display two different indicators in a single indicator.
Pine Script® indicator