Boltzmann Weighted Moving average ( BWMA )Overview:
Introducing the Boltzmann Weighted Moving Average (BWMA) – a novel approach that draws inspiration from statistical mechanics to emphasize recent market data more than older data. By applying an exponential decay governed by a “temperature” parameter, BWMA provides a unique perspective on price trends and enhances noise filtering. An EMA-based smoothing is then applied for an even cleaner, more stable signal.
Key Features:
Boltzmann Weighting: The BWMA assigns weights to each data point based on a Boltzmann-like formula, giving more influence to recent bars and reducing the impact of older ones. This creates a dynamic, adaptive moving average that can quickly respond to market changes.
Adaptive Temperature Control: Users can adjust the “Temperature” (T) parameter. A lower T puts a stronger emphasis on the most recent data, while a higher T makes the weight distribution more uniform across the chosen period.
EMA Smoothing: After computing the weighted average, an EMA is applied to smooth out short-term noise, resulting in a cleaner trend indication.
Color-Coded Trend Indicator: The BWMA line changes color depending on its slope, allowing traders to quickly identify bullish (green) or bearish (red) conditions at a glance.
Parameters:
Period: Defines the lookback window over which the Boltzmann weights are calculated.
Temperature (T): Controls the steepness of the weight decay. Lower T emphasizes recency, while higher T spreads weights more evenly.
Alpha (Energy Scale): Adjusts how quickly “Energy” (and thus weight decay) increases with older data points.
Smoothing Period: Determines the EMA length for reducing noise after weighting, providing a more stable signal.
How It Works:
The BWMA calculates a weighted average of recent prices, where the weight for each data point i is given by:
weight = math.exp(-energy / (k_B * T))
Energy_i: Increases as the data point is further back in time.
k_B: A scaling constant, set to 1 for simplicity.
T: "Temperature" parameter that controls how quickly the weights decay. A lower T emphasizes more recent data strongly, while a higher T spreads out the emphasis more evenly.
Visuals:
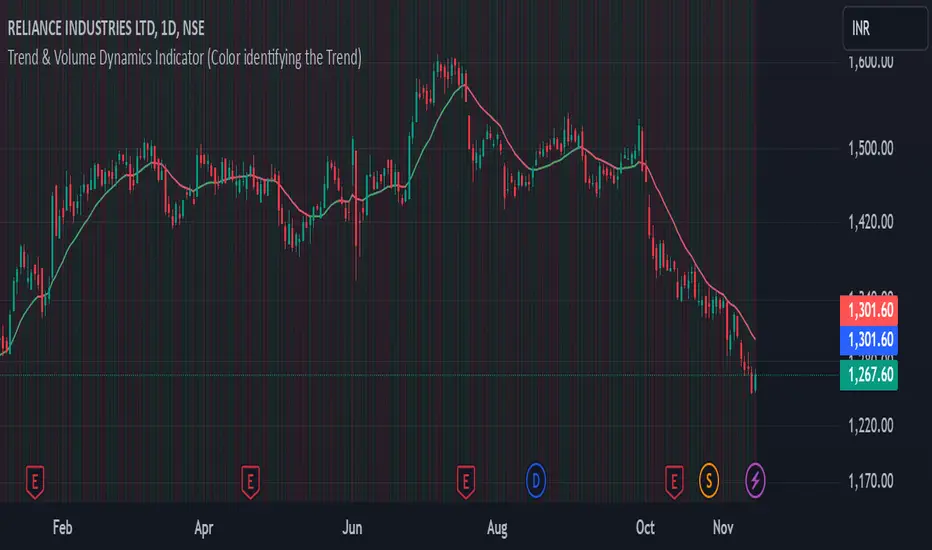
BWMA Line: Plotted as a smooth line that changes color based on trend direction.
Green: BWMA is rising (bullish trend).
Red: BWMA is falling (bearish trend).
Usage:
The BWMA can be used similarly to traditional moving averages but offers greater flexibility and adaptability:
Adjust T and Alpha: Fine-tune the weighting profile to match your trading style, whether you prefer rapid response to recent changes or a more balanced view.
Trend Confirmation: Use color changes to confirm bullish or bearish momentum.
Filtering Noise: The combination of Boltzmann weighting and EMA smoothing can help reduce the impact of sudden price spikes and yield clearer trend signals.
By blending the concepts of statistical mechanics with classic technical analysis techniques, the Boltzmann Weighted Moving Average provides traders with an innovative tool for revealing underlying market trends.
Pine Script® indicator