[RS]Channel Projection V1EXPERIMENTAL:
note: angle calculation is not correct.
added optional time calculation and bar calculation
Experimental

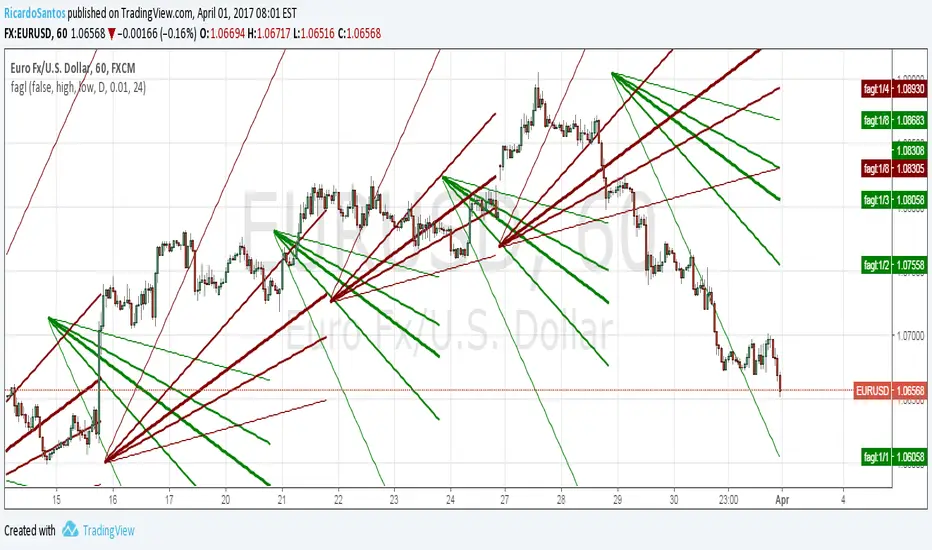
[RS]Fractal Auto Gann LinesEXPERIMENTAL:
GANN lines projection based on zigzag tops/bottoms, use at your own risk.
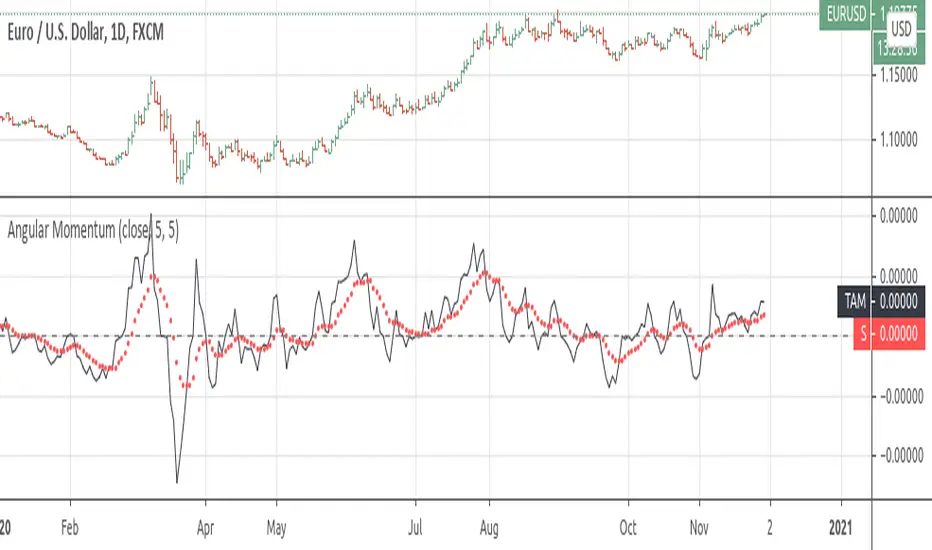
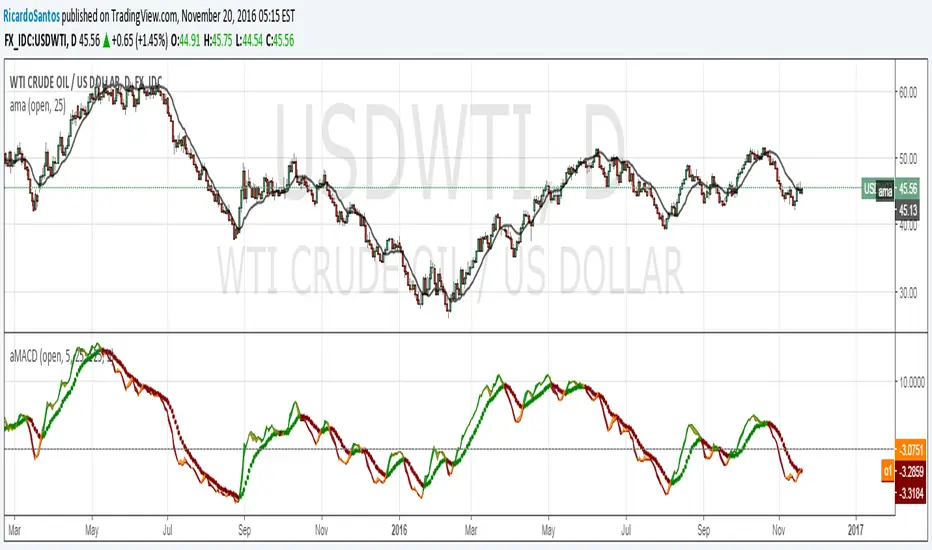
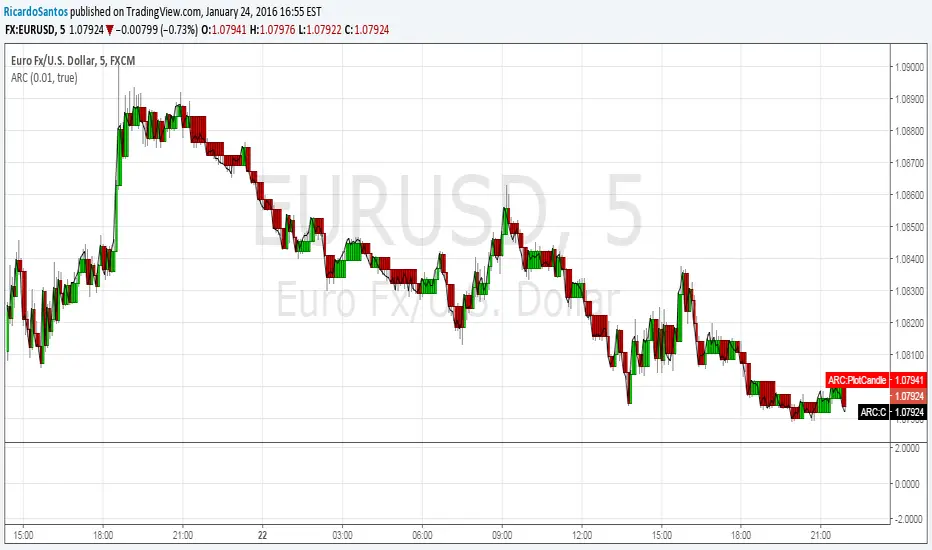
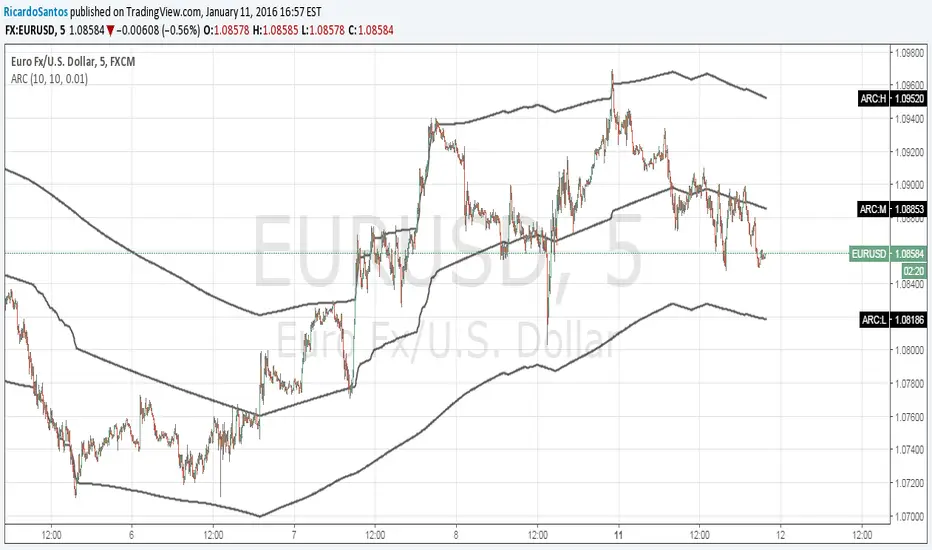
Angular MomentumEXPERIMENTAL:
Returns a smoothed non lagging(peaks are convergent time wise) angular motion.
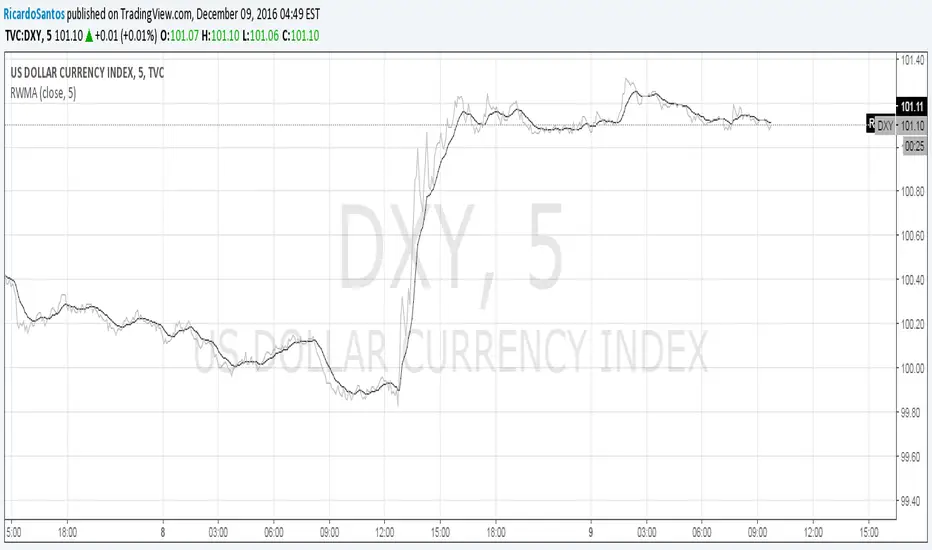
Function - Regressively Weighted Moving AverageEXPERIMENTAL:
Weights its self value by X against 1 time the current price.
Function Savitzky Golay Filter with 7 Vectors V0EXPERIMENTAL:
updated code for duo, triple and multipass

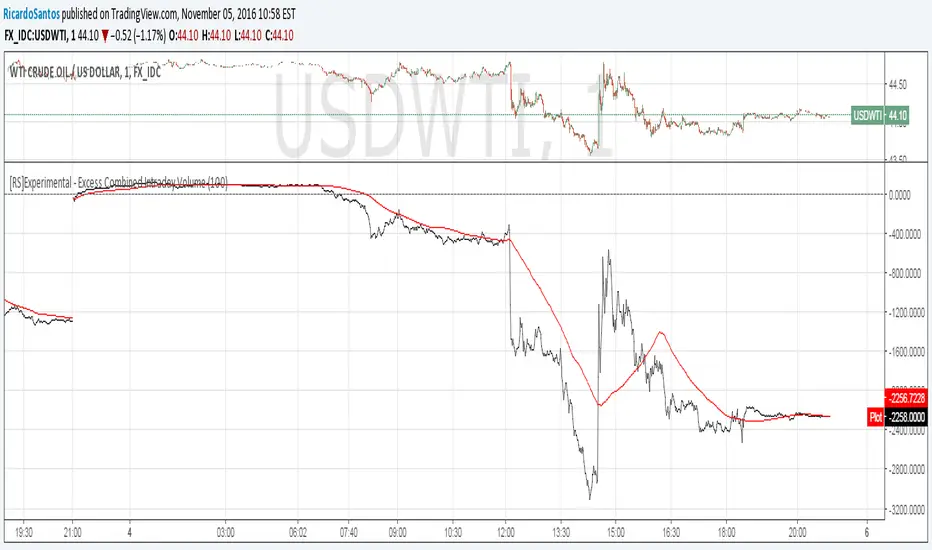
[RS]Experimental - Excess Combined Intraday VolumeEXPERIMENTAL:
Use at your discretion.
A different way to look at volume information from a time flowing perspective.
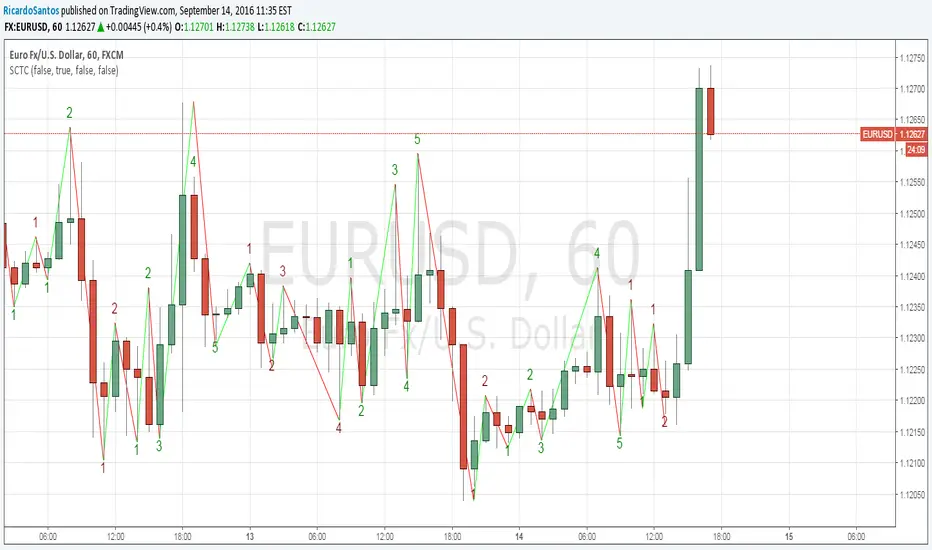
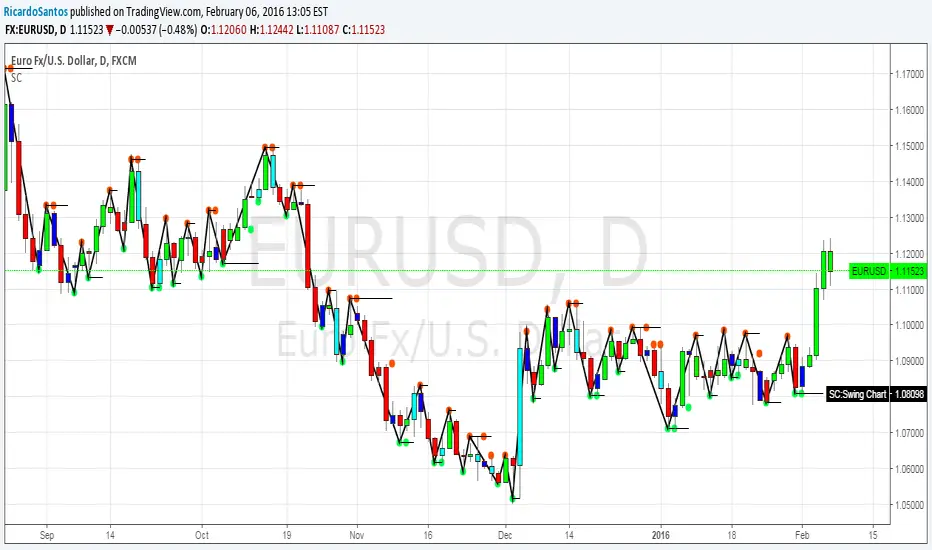
[RS]Swing Charts V0 Trend Counter V0EXPERIMENTAL:
wave counting using swing charts, use at your own discretion.
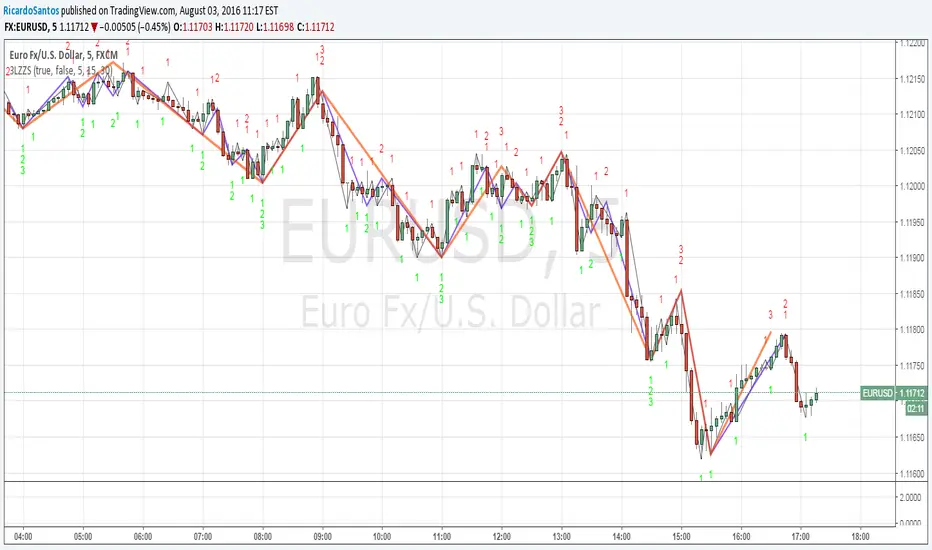
[RS]3 Level ZigZag Semafor V0EXPERIMENTAL:
request for CharanTejaM
zigzag may be adjusted to use other methods.
zigzag repaints, use at your own discretion.
[RS]Volatility Explosive Measure V0EXPERIMENTAL:
Measures the volatility range of current price range, can help detect squeezes as well explosive moves

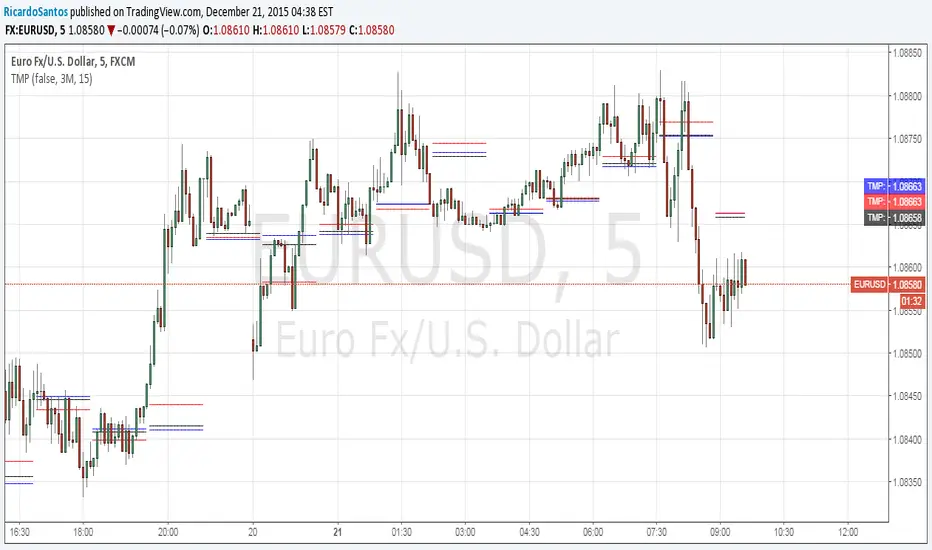
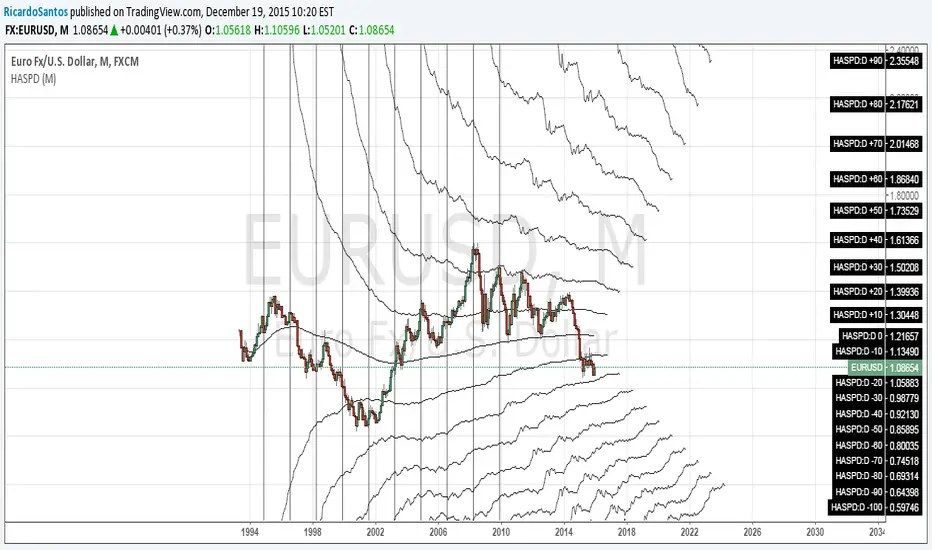
[RS]Time Based Thermal Support and Resistance V0EXPERIMENTAL:
theres a bug where certain dates dont work for the loop, returning a out of index error, please review..


[STRATEGY][RS]ZigZag PA Strategy V4.1EXPERIMENTAL:
WARNING: this strategy repaints after reloading and results are heavily curve fitted, use at your own discretion.
UPDATE: (AleksanderThor) add option for a 2nd target, to use you need to activate pyramiding with a setting of 1 manually (not possible to change programatically) .
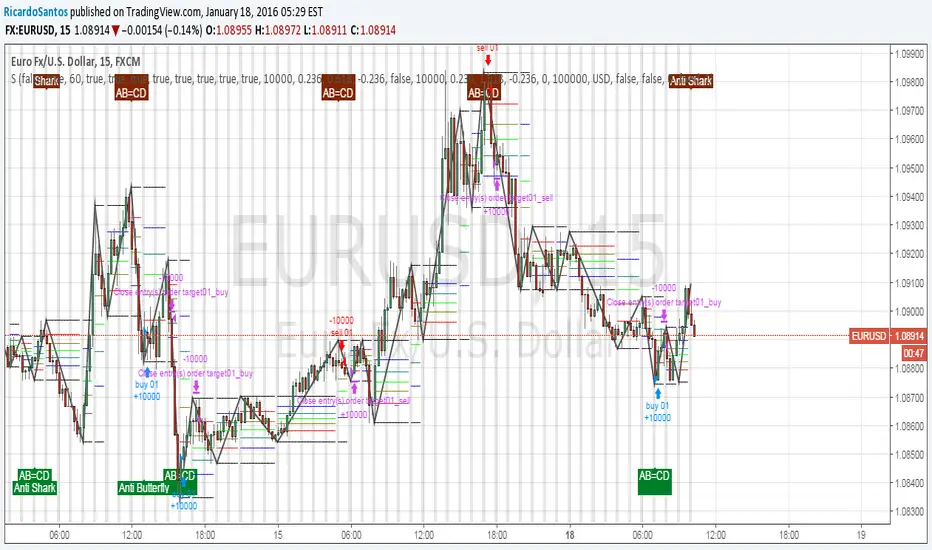
[STRATEGY][RS]ZigZag PA Strategy V4EXPERIMENTAL:
WARNING: highly curve fitted results, if you dont know whats going on stay away.

[RS]Temporal Median Price V1EXPERIMENTAL: previous custom time window median price and current time window open price in a neat package :p
(JeanLouisHardy) added option for bar count system, also added a donchian average.
[RS]Linear Regression Bull and Bear Power Accumulation V1EXPERIMENTAL:
Bull and Bear power based on linear regression (this is a non lagging oscillator, the parameter are for the lookup window for the donchian extremes)
this indicator can also be used for convergence/divergence.
(accidentjev2) added multi timeframe support (indicator may repaint values)


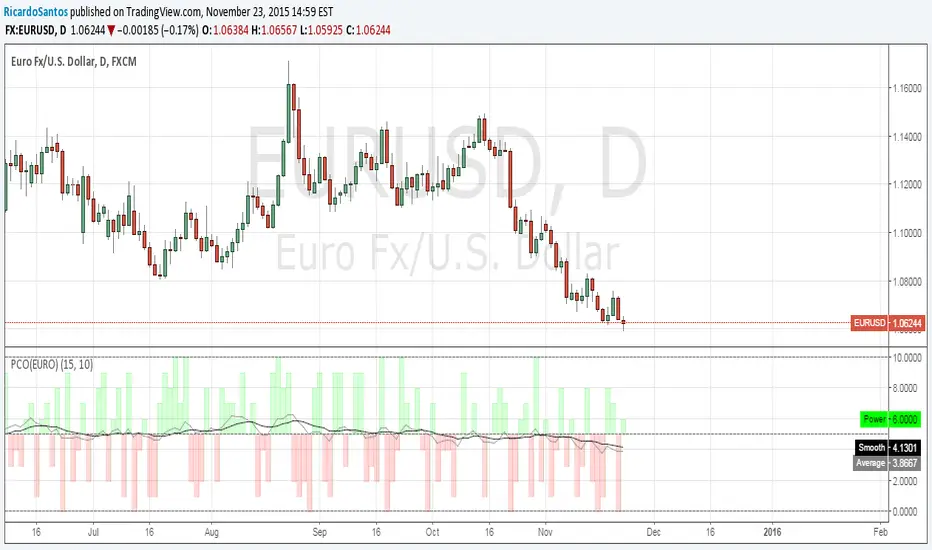
[RS]Power Correlation Oscillator (EURO) V1EXPERIMENTAL:
Added Smoother avg for a better visualization of the trending strength.
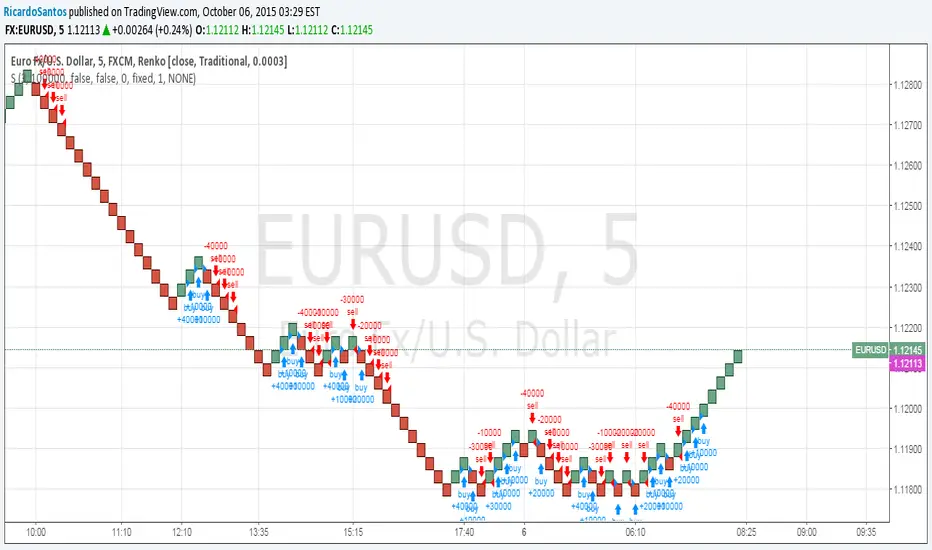
[STRATEGY][RS]The Illusion Strategy V0EXPERIMENTAL:
WARNING: this strategy does not work!!
one of the fallacy's of backtesting, renko chars signals usually will give signals when price is allready out of range.