DPD INDICATOR (DEMA PRICE DİFFERENCE PERCENTAGE )I use DEMA and Price difference in many strategies and and trade.
Finally , ı wanted to build an indicator for relation between them.
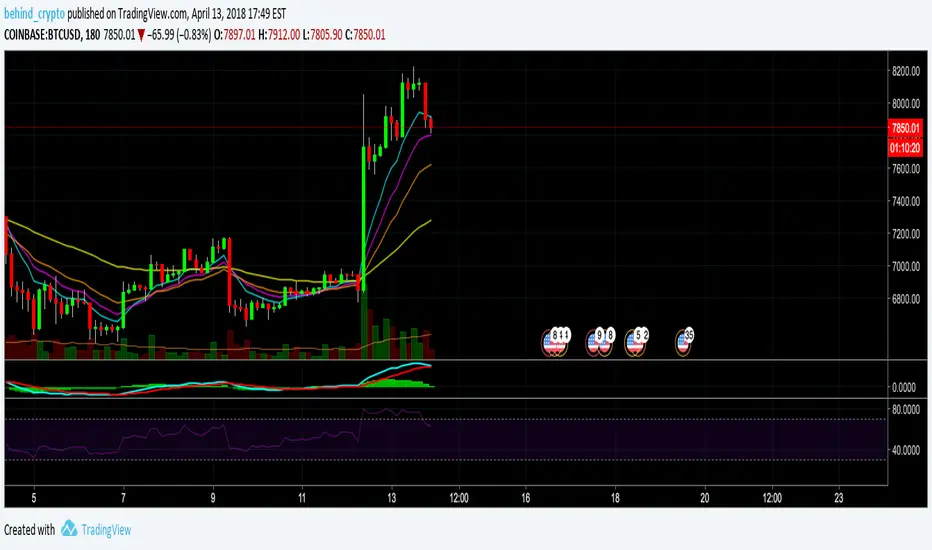
It calculates the percentage of difference between price and dema and estimates deviation from the main trend.
Formula = (price-dema)/price*100
There is some parameters;
DEMA Length is length of dema , ı think 50 is good enough,
there is upper and lower band for DPD Score .
You can change it based on volatilities of your pairs to find an optima.
and use it to be sure about your entry point.
I will developed and combine DPD with some other indicators and build strategies with it.
You can be part of that , I am waiting for your feedback.
Stay in Touch :)
Exponentialmovingaverages

Philakone 4EMAs + 3MAs (200+100+50)Hi guys ^^
This script combine all Philakone EMAs plus i added death and golden cross MAs which is ( 200 MA + 50 MA ) plus 100 MA
You can fully customize all moving averages MA EMA show or hide or change color or thickness and ofc 0.79% play with source code :)
BTC tip :
3BMEXA9mJMhMBJR9MR3t7othh7BijxUNW7
Thanks ^^

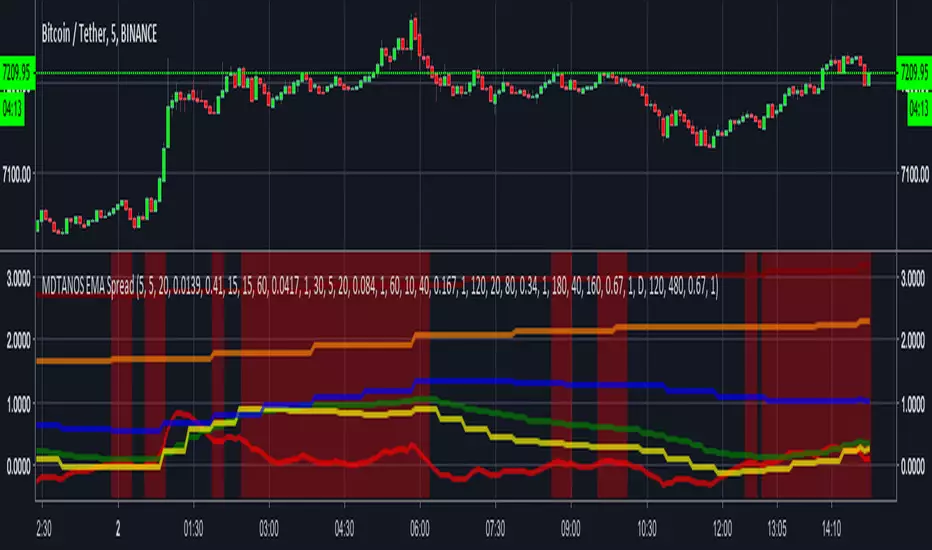
MDTANOS EMA Spread Indicator [v2018-09-01]Built an indicator providing buy / sell signals for MDTANOS from the
ProfitTrailer discord discord.gg as an educational exercise to
show him and the rest of the profit trailer community how to create an indicator
on TradingView using PineScript.
He requested:
i would like to know how to see on tradingview a combination of EMASPREADS
on 5 min and 15 min time frame is it possible?
i have a buy strategy from A to D that combines several time frames
all using EMASPREAD
and the bot buys when all them are true
each of them uses a different time frame
5 min, 15 min, 30 min, 1hour 2 hours 4 hours and 1 day
is there a way to visualize thid condition on tradingview?
Rather than build directly to the requested strategy I made this a
generic and more flexible indicator that can be used and configured
to work on any market, timeframe and trading pair.
Note it is using the timeframes defined for the CandlePeriod parameter
rather than the chart resolution.
I first published the basis of this indicator on the ProfitTrailer discord.
The script uses an EMA spread as its main signal and displays the
spread values as lines on the indicator based on whatever input
criteria you provide.
Based on the buy value and buy limit values it works out buy signals.
The display of the buy signals is optional as displaying them altogether
would not be particularly useful.
This software is provided under a commercial license that grants
personal use only, please refer:
github.com
Copyright (c) 2018, Grant Cause aka CryptoCoyn
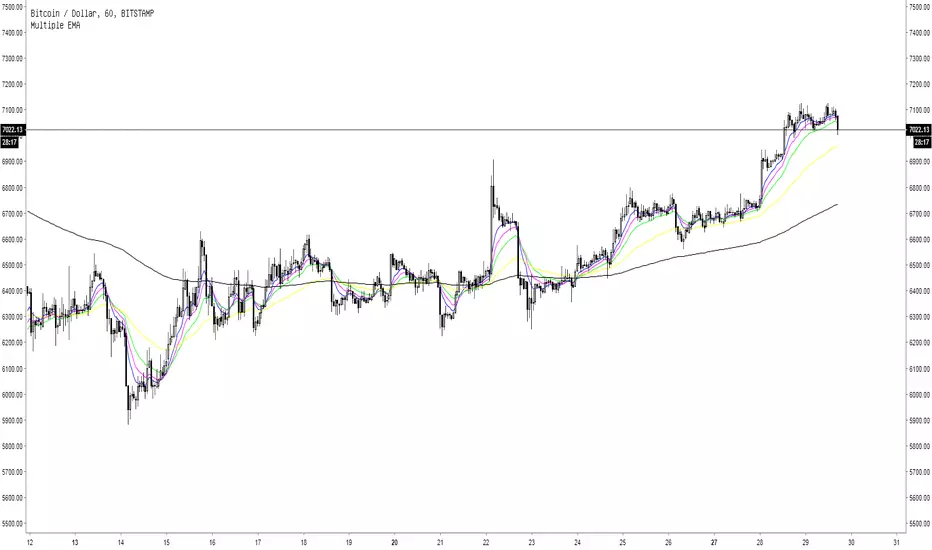
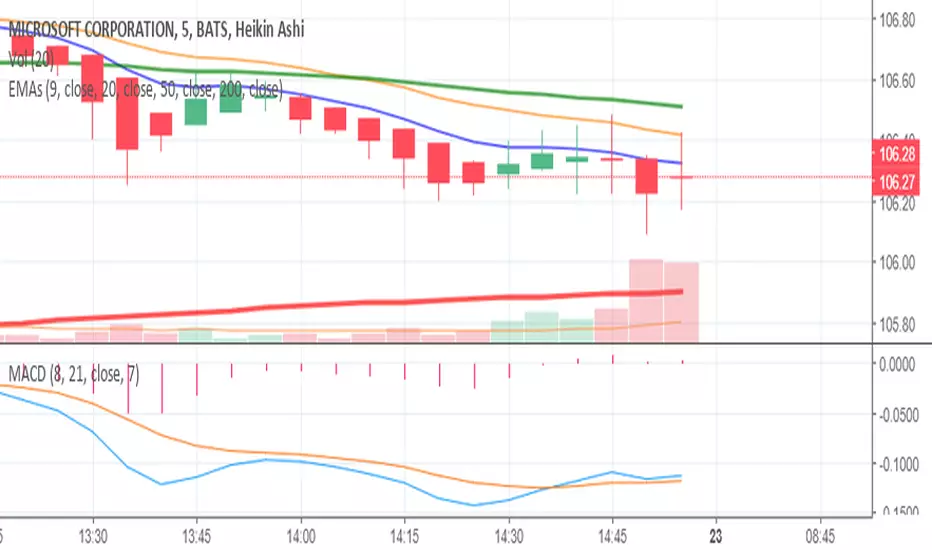
Multiple EMA5 Exponential Moving Averages
EMA 1: length 8, blue line
EMA 2: length 13, pink line
EMA 3: length 21, green line
EMA 4: length 55, yellow line
EMA 5: length 200, black line
(JS) Ultimate Multi Time Frame Moving AveragesSick of having to pull up tons of charts to check the moving averages on various time frames? Me too, so I decided to make the "Ultimate Multi Time Frame Moving Averages" overlay.
So what's it do? Simple. It allows you to plot moving averages from other time frames on your current chart. There's a bunch of built in MA's, and I also added space for two custom SMAs and three custom EMAs.
The custom moving averages can be set to any length or time frame that you desire.
The ones that come built in include:
5 Day SMA
10 Day SMA
20 Day SMA
50 Day SMA
100 Day SMA
200 Day SMA
5 Week SMA
10 Week SMA
20 Week SMA
50 Week SMA
100 Week SMA
200 Week SMA
Now you can simply check or un-check any of the following to see where these MAs fall on your current chart, no more flipping back and forth! Enjoy!

08-18 EMA Watson [ALERT SETUP][INDICATOR]Hello here is the Alert Setup of my Strategy EMA Watson, I published a backtest version on my profile two days ago.
The big triangles correspond to the buy/sell alerts.
I give access for free, just leave a comment.
More info about the script, such as inputs description, how to configure the script, strategy explanation, alert configuration can be found here : blockchainfiesta.com
--------------------------------------------------------------------------------------------------------------
Commission Work: TradingView development, Reverse Engineering, Pine Script. contact@blockchainfiesta.com.. You can also send me a message in TradingView or Discord
If you have too much crypto and want to help me out:
BTC -2.19% address: 19sVQvCDmVfEACq7BiMnWSMqFPZ8qfSQ2K
ETH address: 0xc8a5d3a63a05db0c2363ea1c08b37a01cce9ebfb

6 EMA Crypto InvestidorExponential Moving Averages - 6 EMA Crypto Investidor
Indicator developed to facilitate the use of 6 EMAs in a single indicator.
EMAs: 9, 13, 21, 55, 100 and 200 Periods
Developed by Diego do Youtube Channel Crypto Investor

EMAs Crypto InvestidorExponential Moving Averages - EMAs Crypto Investor
Indicator developed to facilitate the use of 5 EMAs in a single indicator.
EMAs: 17, 34, 72, 100 and 200 Periods
Developed by Diego do Youtube Channel Crypto Investor

Exponential Moving AveragesCreated by using the Simple Moving Average indicator created by stocksinboxx
Plots four Exponential Moving Averages on a chart. (9, 20, 50, 200)
EMA Cross - Indicator OnlySimple Indicator for Automated Trading Based on EMA Cross.
Displays the BUY/SELL.
Best used with the ALERTS Script.
PM for use.

EMA Cross Alerts /w Take Profit and StoplossSimple Alert for Automated Trading Based on EMA Cross.
Also includes the ability to add Take Profit, Stoploss, and Trailing.
PM for use.


Double Exponential SmoothingSingle Exponential Smoothing ( ema ) does not excel in following the data when there is a trend. This situation can be improved by the introduction of a second equation with a second constant gamma .
The gamma constant cant be lower than 0 and cant be greater than 1, higher values of gamma create less lag while preserving smoothness.Higher values of length must be followed by higher values of gamma in order to keep the lag low.
The first smoothing part consist of a classic ema but we add s-s1 to the previous smoothed value, this will help decrease lag.The second smoothing part then updates the trend, which is expressed as the difference between the last two values.

3 Moving Average ExponentialSince I noticed there was no Script with actually 3 EMA together (all the ones I found said it was Exponential, but actually was Simple), i created this one.
The lengths, 17 72 305, are based on the phi cube theory, introduced by Bo Williams. The slow length (305) indicate a likely strong support/resistance and the region between the fast and medium lengths (17, 72) indicate where the price tends to return after a boost or little diversion from the price average.

SS EMA / SMA RibbonColor Change if above or below EMAs / Ribbon
StokedStocks EMA / SMA Ribbon 9 20 25 30 35 40 45 50 55 60 65 70 75 80 85 90 95 100 200
EMAs Color Change if above or below EMAs / Ribbon
Lime : Uptrending; Long Bias
Green : Dip Buy / ReEntry or downtrend reversal warning
Red : Downtrend. Short Bias
Maroon : Short Reentry (sell the peak) or uptrend reversal warning
1st strategy Long when Price crosses above all EMAs
2nd strategy if late is buy first or second pullback to 9 or 20 EMA which are the 1st and 2nd ribbon lines (in an uptrend)
3rd strategy is Short once price crosses UNDER all EMAs
Use Trailing stop % once long or short
Better when shorter time frames line up with Longer time Frames for less risk EXAMPLE Above all EMAs on 5min chart and on Daily Chart

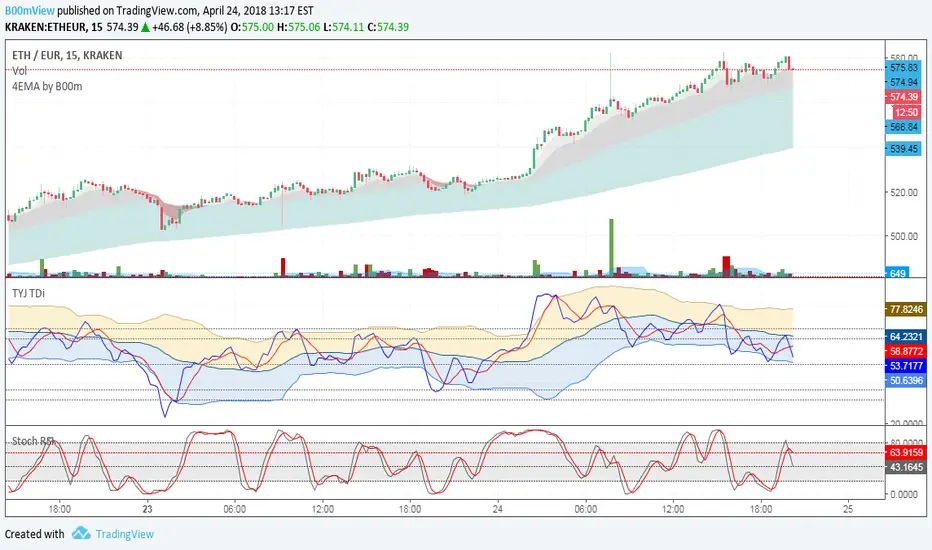
Four Exponential Moving Averages by B00m2tM00nAfter little research I couldn't find a simple 4EMA ribbon that bled when necessary.
Admittedly, nothing new here, use where you think appropriate.
Suggestions welcome!
Fibonacci Exponential Moving Averages ( EMA )Here you can have 4 EMA on one indicator. The inputs are for 8, 13, 21 and 55 previous open&close which are from Fibonacci sequence.
How to : To use the script, click on "Add to Favourite Scripts", then load the script from Indicators on the Chart.
Fibonacci Exponential Moving Averages ( EMA )
Have 8, 13, 21 and 55 EMA on one indicator ! enjoy :)
R.N
Triple Moving Averages - 50ema w/ 100sma & 200sma1st moving average is a Exponential Moving Average - designed to show short-term and medium-term trend quickly
2nd moving average is a Simple Moving Average - designed to show medium-term trend and less susceptible to fakeouts
3rd moving average is a long Simple Moving Average - designed to show the long-term trend and overall trend of the instrument

Multiple Moving AverageThis EMA script has multiple EMA's in one - 4 at the key Fibonacci levels (8,13,21,55) and 2 additional at 100 & 200 period counts. I've found this script to be extremely helpful to determine when to open or close positions - mostly using the 55 EMA as they key indicator and watching for the other 3 Fib MA's to cross over the 55 as a signal of a market shift. The 100 & 200 give additional Support & Resistance indications. The FIB MA's (hard to see on above chart) work better at lower levels for day trading where as the larger 3 lines work at all intervals.

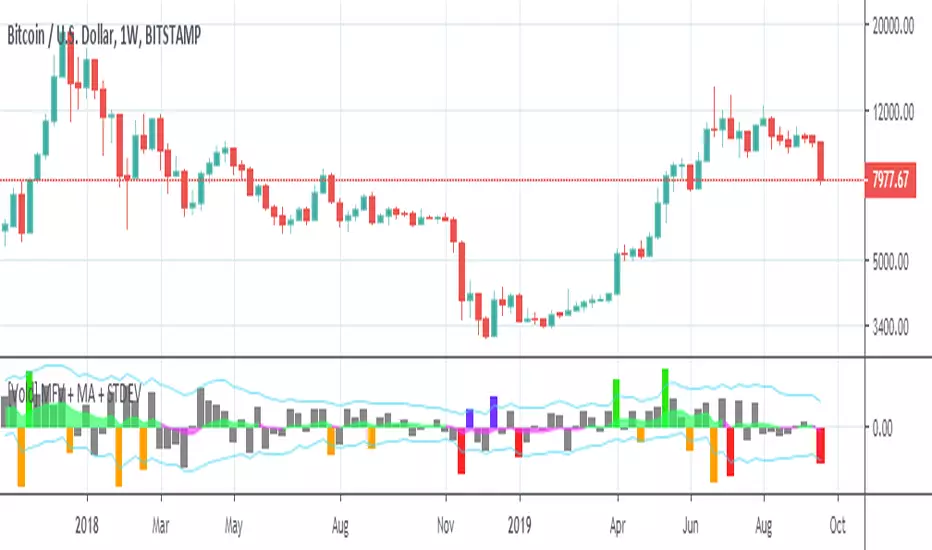
[Vold] MFV + EMA + STDEVThis indicator is a combination of Money Flow Volume with an Exponential Moving Average of the MFV and a Standard Deviation.
The default setup is better suited for the 1H timeframe.
The indicator shows Money Flow Volumes in bars positive and negative, an area which is the EMA of MFV of (20 default) periods, and the STDEV of that EMA (2 default multiplier/factor), when a MFV is greater than the upper limit or lower limit (given by the standard deviation of EMA of MFV), they show an extraordanary behaviour which can be attributed to FOMO (green), OPPORTUNITY (blue), FEAR (yellow), PANIC (RED).
Generally the indicator does not help to make a decision in real time, but it helps to determine what could come next after what is shows in the previous periods, for example:
In the chart there is a MFV bar that shows that a there's a candle that shows a reversal backed by a decent ammount of volume, if it's enough to turn the MFV EMA from fuchsia to green in the next 1-2 candles you can be pretty confident that it was an actual reversal.