rt maax EMA cross strategythis just sample of our strategies we published with open source, to learning our investor the way of trading and analysis, this strategy just for study and learning
in this strategy we use expontial moving avarage 20 , 50 , 200 and the we build this strategy when the price move up ema 200 and ema 20,50 cross up the 200 ema in this conditions the strargey will open long postion
and the oppisit it is true for short postion in this sitation the price should be under ema 200 and the ema 20 , 50 should cross under 200 ema then the strategy will open the short postion
we try this strategy on forex ,crypto and futures and it give us very good result ,, also we try this postion on multi time frame we find the stragey give us good result on 1 hour time frame .
in the end our advice for you before you use any stratgy you should have the knowledg of the indecators how it is work and also you should have information about the market you trade and the last news for this market beacuse it effect so much on the price moving .
so we hope this strategy give you brefing of the way we work and build our strategy
Exponentialmovingaverages

Dynamically Adjusting EMA Crossing
The Exponential Moving Average is the most commonly used indicator in every market. but no one can predict which pair of exponential moving average crossing will work best together. Every instrument require different EMAs crossing. It can be 2 EMA crossings or 3 EMA crossings.
Dynamically Adjusting EMA crossing tries to solve this issue. Algorithm finds the optimal EMA crossing setting for every instrument across all timeframes based on the EMA lengths provided in the settings. It evaluates the most profitable crossing combination for each instrument. The logic backtests the different combinations of EMA crossing based on the EMA lengths provided in the indicator's settings.
There are 3 EMA options in the settings Fact, Slow and Long. Indicator's Settings have the option to choose 2 EMA crossings or 3 EMA crossings.
Default Settings
Fast : 5 to 10
Slow : 13 to 19
Long : 20 to 60
Please do keep in mind that the performance of the indicator reduces as we increase the default settings range.
Please contact me for access

EMA and MACD with Trailing Stop Loss (by Coinrule)An exponential moving average ( EMA ) is a type of moving average (MA) that places a greater weight and significance on the most recent data points. The exponential moving average is also referred to as the exponentially weighted moving average. An exponentially weighted moving average reacts more significantly to recent price changes than a simple moving average simple moving average ( SMA ), which applies an equal weight to all observations in the period.
Moving average convergence divergence ( MACD ) is a trend-following momentum indicator that shows the relationship between two moving averages of a security’s price. The MACD is calculated by subtracting the 26-period exponential moving average ( EMA ) from the 12-period EMA.
The result of that calculation is the MACD line. A nine-day EMA of the MACD called the "signal line," is then plotted on top of the MACD line, which can function as a trigger for buy and sell signals. Traders may buy the security when the MACD crosses above its signal line and sell—or short—the security when the MACD crosses below the signal line. Moving average convergence divergence ( MACD ) indicators can be interpreted in several ways, but the more common methods are crossovers, divergences, and rapid rises/falls.
The Strategy enters and closes the trade when the following conditions are met:
LONG
The MACD histogram turns bearish
EMA7 is greater than EMA14
EXIT
Price increases 3% trailing
Price decreases 1% trailing
This strategy is back-tested from 1 January 2022 to simulate how the strategy would work in a bear market and provides good returns.
Pairs that produce very strong results include XRPUSDT on the 1-minute timeframe. This short timeframe means that this strategy opens and closes trades regularly
In order to further improve the strategy, the EMA can be changed from 7 and 14 to, say, EMA20 and EMA50. Furthermore, the trailing stop loss can also be changed to ideally suit the user to match their needs.
The strategy assumes each order is using 30% of the available coins to make the results more realistic and to simulate you only ran this strategy on 30% of your holdings. A trading fee of 0.1% is also taken into account and is aligned to the base fee applied on Binance.

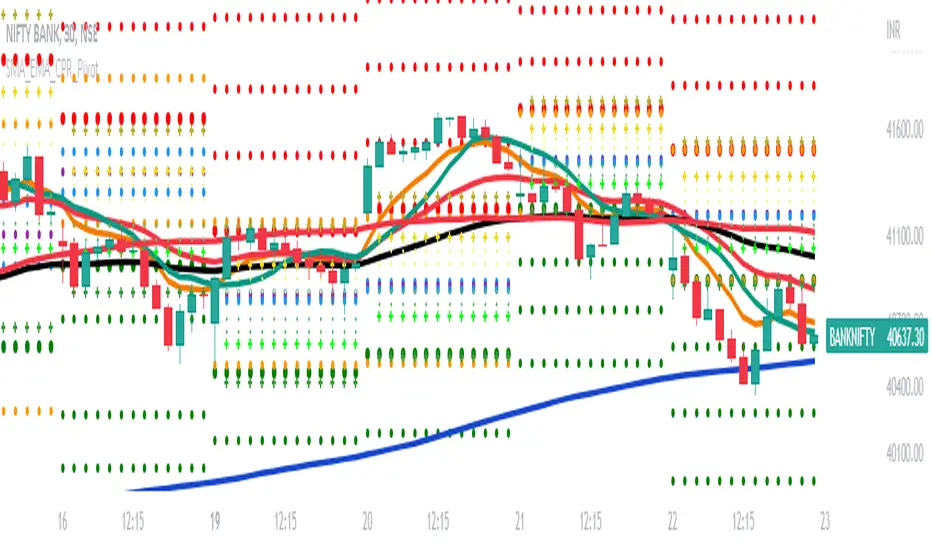
SMA_EMA_CPR_PivotThis Script can do multiple jobs in single indicator.
Like -:
Plot 3 SMA as per your inputs.
Plot 3 EMA as per your inputs.
Plot CPR Levels.
Plot Pivot Levels.
Plot Previous Day High Low.
Indicator can used in Intraday stock trading, Positional Trading and options trading.
Please Enjoy.
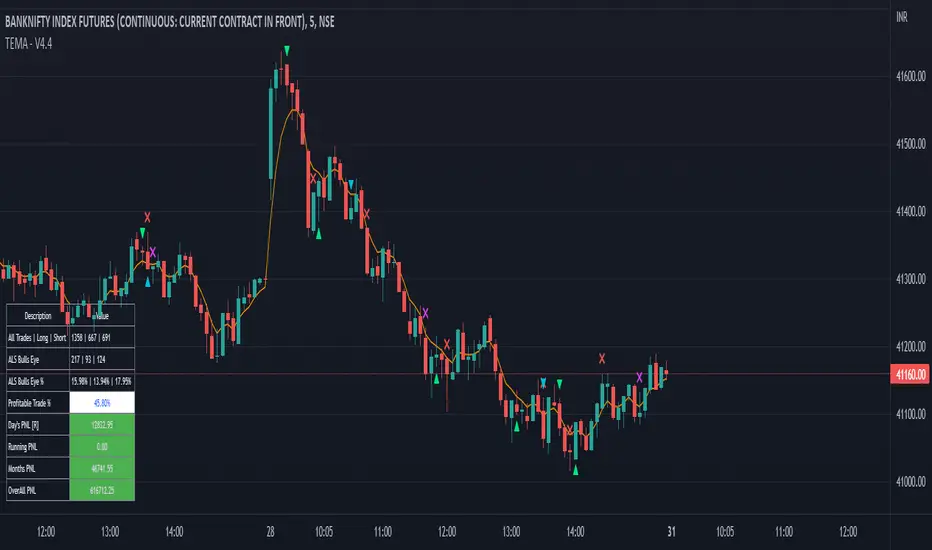
Tripple EMA Strategy - Dhan HQDear Traders,
Here with presenting the new Indicator (Strategy) which is primarily built based on the the EMA moving Average and Candlestick Pattern.
Idea behind this Indicator: I am sure every trader would have traded using Moving average one day or the other. And Moving average is theoretically they are Lagging and the EMA are used in place of Moving average just to avoid a bit of Lag to take advantage of those accuracy while avoiding the Lag. In order to be successful in trading Money Management and Risk Management is very much crucial and should be part of every trade we place.
What this indicator is providing:
Based on the EMA and candlestick patterns and using the inputs provided for RISK and Money Management options, Indicator continuously scans for trading opportunities and provides alerts for possible trades. I have tried to capture some analytical inputs for one to think and take control over the Reward, Risk and Money management parameters to tweak the indicator accordingly.
Below are the Analytical outputs provided:
1. Total Trades taken (History till present) and its profitability % & appx PNL
2. Current Dates & Yesterday's Trades along with its appx PNL
3. Long Trades performance vs Short Trades performance
4. Retrieve PNL values post specified Date in the Input settings.
5. Last 7 Days PNL
6. Month's PNL
Note: There is known BUG in the calculation where the first date of the month for Monthly PNL value is a trading Holiday then Monthly PNL is being displayed as 0. similarly this Bug is flowed for Last 7 Days PNL. This will be addressed in upcoming version along with planned release.
Alerts & Notifications:
There are basically 2 types of Alerts provided one with General Notification and Other with Dhan HQ notifications to support Algo Trades for Dhan HQ Baskets.
Overview for Dhan HQ Trade Alerts:
1. When the Day Beginning (At Session Start) Hedge Position can be placed and shall be squared off post Closing the session
2. During the course of the Day Buy & Sell Baskets shall be executed
3. Can map the Trade Level SL values
4. Can map Daily Limit for SL to avoid excessive Loss. Upon Loss you could stop trades for the complete day or you may restart the trade post completion of X no of hours.
Enjoy!
DISCLAIMER: No sharing, copying, reselling, modifying, or any other forms of use are authorized for our documents, script / strategy, and the information published with them. This informational planning script / strategy is strictly for individual use and educational purposes only. This is not financial or investment advice. Investments are always made at your own risk and are based on your personal judgement. I am not responsible for any losses you may incur. Please invest wisely.
Happy to receive suggestions and feedback in order to improve the performance of the indicator better.
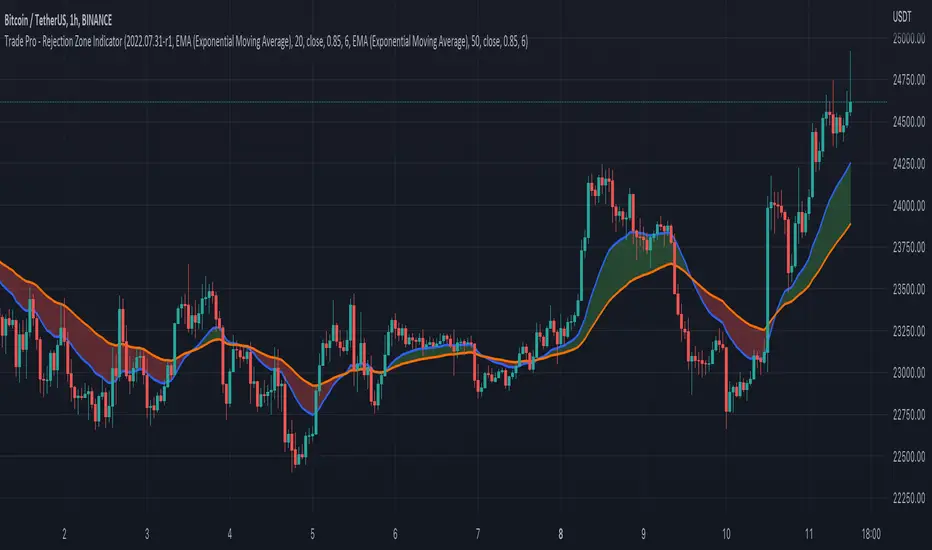
Trade Pro - Rejection Zone IndicatorThe Rejection Zone Indicator can be used to help trend following traders know when to buy dips in up trends, and when to sell pull backs in down trends.
The Rejection Zone Indicator is made up of the 20 and 50 period Exponential Moving Averages. This indicator has colored shading in between these two EMAs, which acts as a nice visual. When the 20 period Exponential Moving Average is below the 50 period Exponential Moving Average, the shaded cloud will be red, and when the 20 EMA is over the 50 EMA the cloud will be green. It is called the Rejection Zone indicator, because often in trends when price pulls back to the colored cloud, it will act as an area of support or resistance.
The suggested use of the Rejection Zone Indicator is to look for long trades when the cloud is green, and once price has pulled back into the green cloud. If the cloud is red one can look for short trading opportunity when price pulls back into the red cloud.
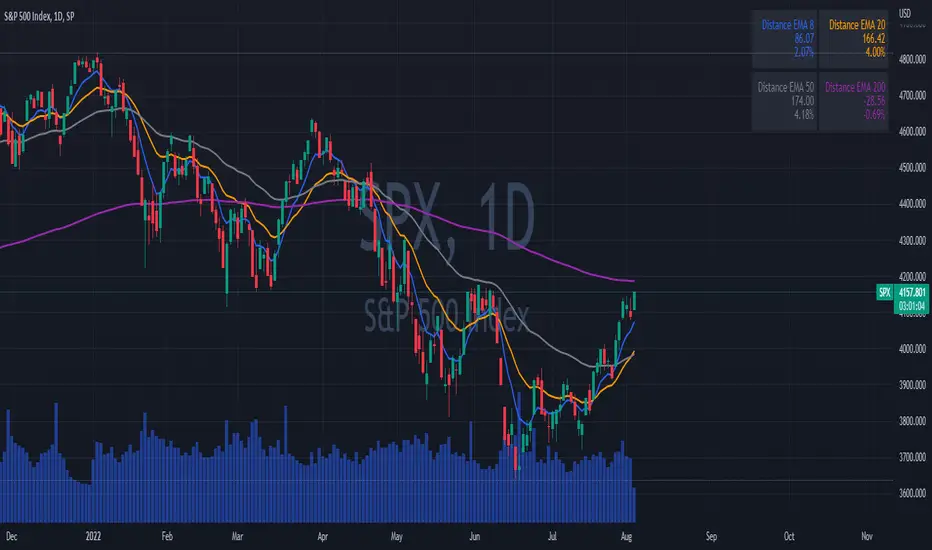
EMAs DistancesThis indicator shows 4 configurable EMAs and the distances (values and percentages) to the last price of the stock, etf or index.
EMA ON MA SETSOORY FOR MY EINGLISH
ITS NOT MY NATIVE AND IM NOT GOING TO GOOGLE TRANSLATE THIS
this is a beuaitful indicator that plot EMA that gat is calc from another ma and length for your choise so you will get an = 'ema on ma '
it can plot you more beautiful results and more smoothing results
i added golden/death cross for all ma
enjoy !
היי חברים זה בעצם אינדיקטור של ממוצע נע על ממוצע נע לנוחיכותכם
הפלט הראשי הוא EMA
הוא לוקח את החישוב שלו ממוצע אחר והאורך שתגדירו
נותן תוצאה יותר חלקה של ממוצעים נעים
הוספתי חתיוכים בין ההמוצעים
תהנו.

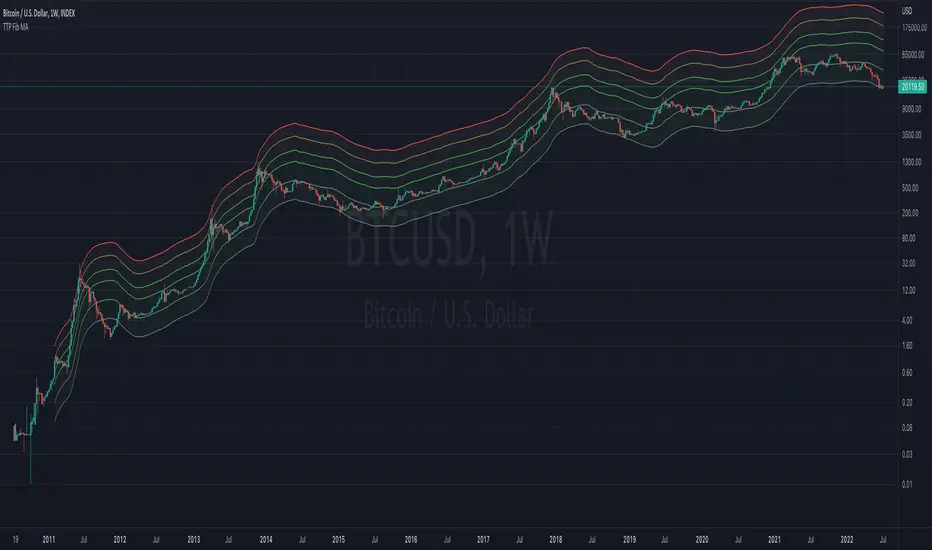
TTP Fibonacci MAThis indicator offers a fibonacci rainbow of moving averages.
Recommended instructions:
- timeframe: daily or weekly
- logarithmic scale
- default MA length for smoother curve
- fib levels used are 0.5,1,2,3,5 and 8, but you can also try with 1,2,3,5,8,13 or 0.33,05,1,2,3 depending on which range you want to cover
- you can render in weekly timeframe and still set the indicator settings timeframe to daily to get more reactive levels
Multi-timeframe EMAThe Multi-timeframe exponential moving average (EMA) indicator visualizes EMAs from 1 minute to 1 quarter on a single chart using the request.security function. Standard and Fibonacci timeframes are available as well as the ability to hide high-timeframe EMAs to keep the chart clean. Cross-overs and arrangement of the EMAs indicate sentiment.
Much love to DumpCap! The script is presented sans secret sauce.
Multi EMA with labels (Any timeframe)This script lets you add up to 8 EMAs (Exponential Moving Averages) that can be set to any timeframe and length. The difference between this and other EMA indicators is that it has a simple label attached to each EMA showing which timeframe it belongs to and what length it is, so you can get that information at a glance while trading without having to remember the specific settings for each EMA.
I was personally looking for something like this because I like clarity on my chart and these labels really help. The existing EMA indicators I found with labels don't support multiple timesframes or if they do, they don't include the timeframe itself in the label, so that's why I created this simple script and shared it in case somebody else is looking for the same. Enjoy.

[CP]Pivot Boss Multi Timeframe CPR Inception with MACD and EMAINTRODUCTION:
This indicator combines multi-timeframe CPR bands with MACD Momentum and EMA trend, all projected on the candlestick chart through a novel visualization.
If you have seen my other indicators on TradingView, you would know that I use floor pivots a lot and “Secrets of a Pivot Boss” is my favorite book. While using floor pivots, time and again I have noticed an interesting price behavior,
Trending moves in price typically start from around the Central Pivot Range (CPR). The CPR could be from ANY timeframe. These moves can easily be caught using simple momentum and trend indicators like MACD and EMA crossovers.
Yes, it is that simple. Follow along to understand how to use this indicator.
INDICATOR SETTINGS:
RANGEBOUND MACD AND EMA MARKINGS:
TradingView limits the max number of labels that can be shown on a chart to 500. Therefore, if you go far back enough, you won't see any markings for the MACD or EMA setups. If you are looking to test the efficacy of this indicator in the past, change the start and end dates to your desired timeframe and then select the ‘Mark MACD and EMA Setups in Range?’ option.
MULTI TIMEFRAME CENTRAL PIVOT RANGE:
Here you can select CPRs and their bands from which timeframes are shown on the chart. I will share my favorite settings later in this description.
CPR CONFIGURATION:
Show CPR Labels: CPRs markings can carry labels, so that you don’t confuse between which line is what. Use this setting to toggle them On/Off.
Show Next Time Period Pivots: Check this option if you want to see the CPR of the next time period. This is typically done to figure out the ’Two Day CPR Relationship’ . Read the book, “Secrets of a Pivot Boss”, to understand more.
EMA TREND:
Show EMA on the Chart: EMAs will be plotted on the chart. Standard stuff.
Mark EMA Crossovers on Chart: EMA crossovers will be marked on the chart in diamond shapes. If you are using EMA crossovers, I recommend setting this option to True.
Rest of the EMA settings are fairly obvious.
MACD MOMENTUM:
Projecting MACD parameters directly on the candlesticks is surely going to give you a new perspective about price action and MACD.
Also, in order to better understand the MACD projections on the chart, you can add a standard MACD indicator on the chart with default settings to figure out what my indicator is actually showing you.
Marking MACD Crossovers on Chart: Marks the MACD signal crossovers on the chart. This visualization was a game changer for me.
Show MACD Histogram on Chart: Projects the complete MACD Histogram in a novel fashion (Try it!). You will be able to visually see the ebbs and flow of momentum in the charts.
Mark MACD Histogram Peaks on Chart: Marks only the MACD peaks instead of the complete histogram. Peaks are a great way to enter an ongoing trend and to play an intraday rangebound market.
Rest of the settings are just the standard settings that you will find in a typical MACD indicator.
ALERTS:
Not shown in the settings panel, but I have added alerts for EMA and MACD Crossovers so that you don’t have to sit in front of the charts or constantly check the price all day long.
If you don’t know how to set alerts in TradingView, then please Google it.
INDICATOR USAGE EXAMPLES:
This indicator can be used in intraday as well as in higher timeframes.
There are quite a few variations possible, I personally prefer to use the EMA crossovers in intraday (5m) and MACD on Daily timeframes.
This is just a matter of personal preference, some people might prefer using EMAs only or MACD only in all timeframes.
Here are my personal settings for the intraday 5-minute timeframe:
Turn on all the CPR pivots starting from Yearly all the way to Daily. You can turn on 6 hourly and 4 hourly as well if you want.
Hourly CPR is mostly used when the price is in a strong trend and you missed the entry and don’t know when to enter. Price will typically experience pullbacks towards the Hourly CPR, before resuming in the direction of the trend. That is your chance to hop onto the bandwagon.
For Intraday, I keep the Bands off. Just a personal preference here.
You can turn ON the Show CPR Labels , if you want.
Turn ON both the options in the EMA TREND section. You would want to see the EMA crossovers marked on the chart as well as the EMAs themselves, as the distance between the two EMAs will give you an idea about the strength of the trend.
Keep rest of the settings in the EMA section as default (you can change the colors if you wish). I keep the same EMAs as the ones kept in the MACD indicator. I like to keep things simple.
In the MACD MOMENTUM section, turn ON Mark MACD Histogram Peaks on Chart and all the other options turned OFF. Leave the other settings as default. By the way, these are the default settings of the standard MACD Indicator.
You can set up EMA Bullcross and Bearcross alarms if you like.
Before checking out the examples, remember one super simple rule:
SOME OF THE BEST TRENDING MOVES IN THE MARKET, BE IT INTRADAY OR OTHERWISE, ORIGINATE IN THE VICINITY OF A LARGER TIMEFRAME PIVOT/CPR.
Look for price settling above/below a pivot, and then a move away from the pivot in any direction is typically a trending move.
You can use hourly pivots or MACD Histogram peaks marked on the chart to enter an existing trend, or add to your positions.
Let’s have a look at a few recent intraday examples from the Crypto, Indian, and US equity markets.
I have added my comments in the charts to make you easily understand what is going on.
Understand that both, moving average crossover and MACD, will give out a lot of signals (chop) every day. But almost 70% of them are going to be fake signals. It is the signals that you get when the price is near a Pivot, that tend to convert into gorgeous trending moves that last.
BTC 5m Charts
NIFTY Futures 5m Charts (good intraday trends are hard to find here, as the market is very efficient)
TSLA 5m Charts
Some important points for using this indicator in higher timeframes:
For higher timeframes, my personal preference is to go with the MACD indicator. I personally find MACD to be lethal on daily and weekly timeframes, if you know how to use it well.
The default settings of the indicator are the settings I use for both, Daily and Weekly, timeframes. Additionally, I turn off the CPR labels.
In theory large trending moves still have a big probability to start near an important pivot level, however, in larger timeframes, trending moves can start from anywhere. They need not start in the vicinity of any important pivot (but they often do!).
Weekly pivots can act as great pullback levels when the price is in strong momentum, when trading on the daily timeframe.
Quarterly Pivots act as great pullback levels when the price is in strong momentum, when trading on the weekly timeframe.
BTC Weekly Chart
BTC Daily Chart
Nifty Weekly Chart
Nifty Daily Chart
NASDAQ Weekly Chart
NASDAQ Daily Chart
FINAL WORDS:
Please understand that I have Cherry Picked the examples to showcase the capability of the indicator and its usage.
DO NOT conflate the accuracy of examples with the accuracy of this indicator.
Biggest catch is the fact that this indicator, like every other indicator out there, will have whipsaws. Some I have also marked in the example charts.
You need to come up with your own technique to avoid whipsaws, one technique I have shared here…… big moves typically start near pivots.
Work on avoiding whipsaws and finding you own edge in the markets.
If you really want to learn how to use Pivots, read the book ’Secrets of a Pivot Boss’ . This book can change your life.

Bogdan Ciocoiu - CoordinatorDescription
The Coordinator is an indicator developed on the back of the RSI algorithm, modified substantially to form a cloud. In addition, the Coordinator uses EMA/SMA to compare the location of the RSI cloud with the chosen moving averages (EMA vs SMA).
This indicator is helpful as it confirms when a trader should enter a position or exit based on the proximity of the RSI cloud to the relevant MA.
Uniqueness
The Coordinator provides unique benefits, including:
It shows the strength of the RSI in the shape of the RSI cloud, using two sets of dimensions (one more long term and one more short-term oriented).
It indicates the positioning of the RSI cloud in conjunction with the relevant moving averages to help traders remain in positions for longer.
It shows the RSI 14 (useful when spotting divergences aligned with the price action).
Open-source
The Coordinator uses the following open-source scripts:
www.tradingview.com

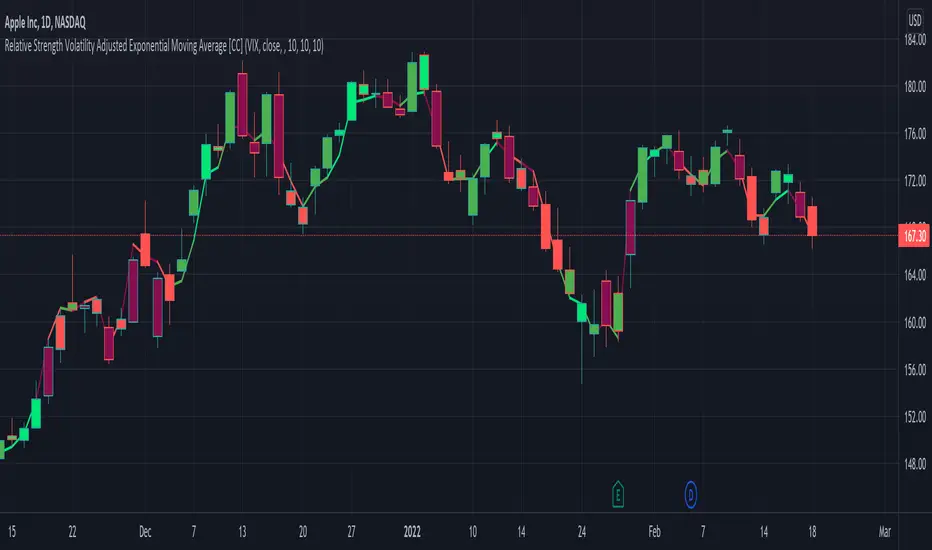
Relative Strength Volatility Adjusted Ema [CC]The Relative Strength Volatility Adjusted Exponential Moving Average was created by Vitali Apirine (Stocks and Commodities Mar 2022) and this is his final indicator of his recent Relative Strength series. I published both of the previous indicators, Relative Strength Volume Adjusted Exponential Moving Average and Relative Strength Exponential Moving Average
This indicator is particularly unique because it uses the Volatility Index (VIX) symbol as the default to determine volatility and uses this in place of the current stock's price into a typical relative strength calculation. As you can see in the chart, it follows the price much closer than the other two indicators and so of course this means that this indicator is best for choppy markets and the other two are better for trending markets. I would of course recommend to experiment with this one and see what works best for you.
I have included strong buy and sell signals in addition to normal ones so strong signals are darker in color and normal signals are lighter in color. Buy when the line turns green and sell when it turns red.
Let me know if there are any other indicators or scripts you would like to see me publish!
NazhoThis is a simple scalping strategy that works for all time frames... I have only tested it on FOREX
It works by checking if the price is currently in an uptrend and if it crosses the 20 EMA .
If it crosses the 20 EMA and its in and uptrend it will post a BUY SIGNAL.
If it crosses the 20 EMA and its in and down it will post a SELL SIGNAL.
The red line is the highest close of the previous 8 bars --- This is resistance
The green line is the lowest close of the previous 8 bars -- This is support
+SuperTrend

T3 + BB
TRES EMAS + BANDAS DE BOLLINGER
INDICADOR 1: TRES EMAS (MEDIA MOVIL EXPONENCIAL)
Con este indicador puede visualizar el promedio de precios con mayor peso a los datos mas recientes.
Se calculan y dibujan tres medias móviles exponenciales: 4, 20 y 200 últimas velas.
-Rápida EMA1 = 4, paso = 1
-Media EMA2 = 20, paso = 2
-Lenta EMA 3 = 200, paso = 10
INDICADOR 2: BANDAS DE BOLLINGER
Con este indicador podrá ver la fuerza y la tendencia del mercado, es decir la mide la volatilidad del precio del activo.
Si el precio sobrepasa la banda superior, el activo está sobrecomprado.
Si el precio sobrepasa la banda inferior, el activo está sobrevendido.
Longitud tendencia - BASE = 20, paso = 1
Desviación Estándar - Multiplicador = 2, paso = 0.2
Estos 2 indicadores sirven para todo tipo de activos: FOREX, CRIPTO, CFD´s, ETC.
------------------------------------------------------------------------------------------------------------------
THREE EMAS + BOLLINGER BANDS
INDICATOR 1: THREE EMAS (EXPONENTIAL MOVING AVERAGE)
With this indicator you can visualize the average of prices with greater weight to the most recent data.
Three exponential moving averages are calculated and drawn: 4, 20 and 200 last candles.
-Fast EMA1 = 4, step = 1
-Average EMA2 = 20, step = 2
-Slow EMA 3 = 200, step = 10
INDICATOR 2: BOLLINGER BANDS
With this indicator you can see the strength and trend of the market, that is, it is measured by the volatility of the asset price.
If the price goes above the upper band, the asset is overbought.
If the price goes above the lower band, the asset is oversold.
Trend length - BASE = 20, step = 1
Standard Deviation - Multiplier = 2, step = 0.2
These 2 indicators are used for all types of assets: FOREX, CRYPT, CFD's, ETC.

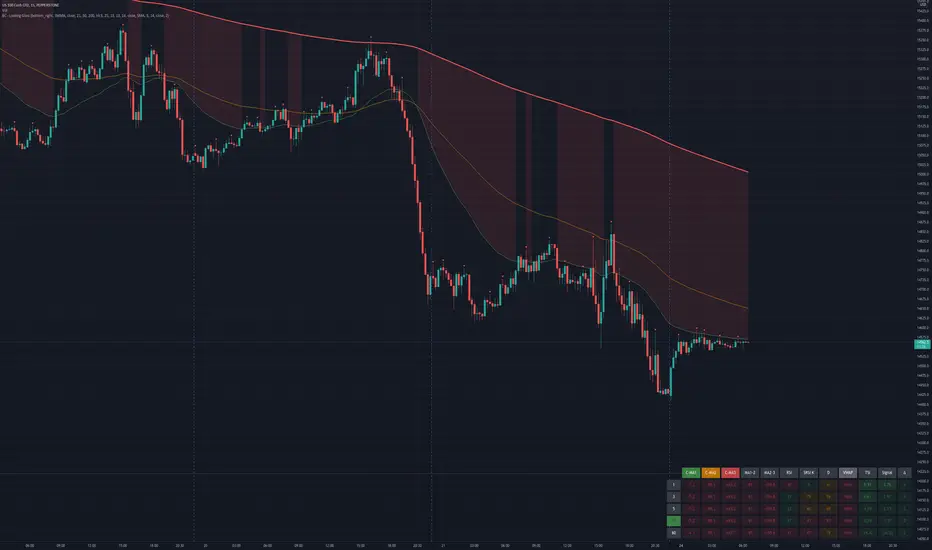
Bogdan Ciocoiu - Looking Glass► Description
The script shows a multi-timeline suite of information for the current ticker. This information refers to configurable moving averages, RSI, Stochastic RSI, VWAP and TSI data. The timeframes reflected in the script vary from 1m to 1h. I recommend the tool for 3m scalping as it provides good visibility upwards.
The headings from the table are:
{Close} - {MA1}
{Close} - {MA2}
{Close} - {MA3}
{MA1} - {MA2}
{MA2} - {MA3}
{RSI}
{Stoch RSI K}
{Stoch RSI D}
{VWAP}
{TSI}
{TSI EMA}
{TSI} - {TSI EMA}
► Originality and usefulness
This tool is helpful because it helps users read a chart much quicker than if they were to navigate between timeframes. The colour coding indicates an accident/descendant trend between any two values (i.e. close vs MA1, MA1-MA2, RSI K vs RSI D, etc.).
► Open-source reuse
www.tradingview.com
www.tradingview.com
www.tradingview.com
www.tradingview.com
www.tradingview.com
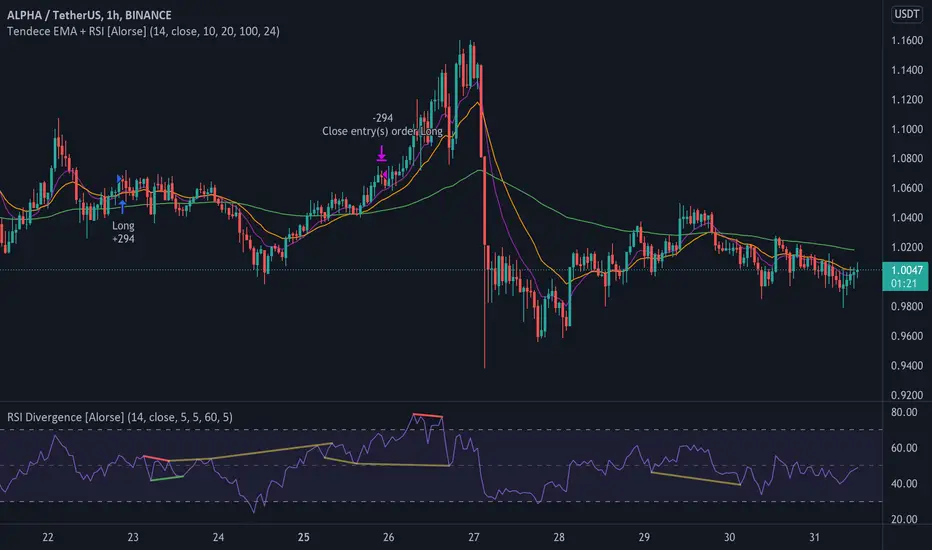
Tendency EMA + RSI [Alorse]A very simple and highly effective strategy LONG & SHORT that combines only 2 indicators:
RSI
3 Moving Average Exponential (EMA)
LONG Entry conditions are:
EMA 20 cross over EMA 10
EMA 10 is above EMA 100
LONG Exit conditions are:
RSI greater than 70
Or when X number of candles have passed and the trade is in profit. (Check Settings)
SHORT Entry conditions are:
EMA 20 cross under EMA 10
EMA 10 is below EMA 100
SHORT Exit conditions are:
RSI is less than 30
Or when X number of candles have passed and the trade is in profit. (Check Settings)
EMA deviation & Range with barcolor changeThis indicator includes an EMA, a range and outer lines similar to the Bollinger Bands, but with a different calculation (which also becomes apparent once you compare the two). This indicator fits very well with the EMA pullback strategy.
The color of the candles changes depending on where it is located.
Above the EMA - green
Below it - red
Inside the range - black
All colors as well as lines are customizable under the Style tab.
The "Deviation" can be set to 0, here there are only slight deviations.
The EMA range can be adjusted in 0.1 steps to achieve the highest possible accuracy of the pullbacks.
If you have any questions, please don't hesitate to contact me.

Fundamental Analysis - Multiple RSI EMAAs the number of crypto currencies is expanding, we need to find the one which will boom in the next months, weeks or even days.
Therefore, I present to you a Fundamental Analysis tool based on RSI built in order to compare the RSI between the diverse cryptocurrencies.
When cryptocurrencies start to trend, become active, minable and especially "buyable", people are investing their money into them.
As a result,the Daily RSI rises and the price of the crypto in question increases steadily.
With "Fundamental Analysis - Multiple RSI EMA" you can :
Follow up to 20 RSI from different exchanges at the same time.
Find easily Increasing/Decreasing RSI as the lines get transparent if their RSI decrease.
You can also select market with high potential of booming as :
Booming Market : 60 < Daily RSI <= 100 (Strong green background)
Potent Market : 55 < Daily RSI <= 60 (Light green background)
Sleepy Market : 50 < Daily RSI <= 55 (Light red background)
Dying Market : 0 < Daily RSI <= 50 (Strong red background)
Futur booming crypto will go from the Potent Market to the Booming Market
Can be used with the following time frames depending on the necessity:
4H
Daily (Preferred)
Weekly
Monthly
Good trades !
Disclaimer (As it should always be one to any script)
***
This script is intended for and only to be used for personal purposes only. No such information provided by it constitutes advice or a recommendation for any investment or trading strategy for any specific person. There is no guarantee presented or implied as to the accuracy of specific forecasts, projections, or predictive statements offered by the script. Users of the script agree that its original developer does not take responsibility for any of your investment decisions. Please seek professional advice before trading.
***

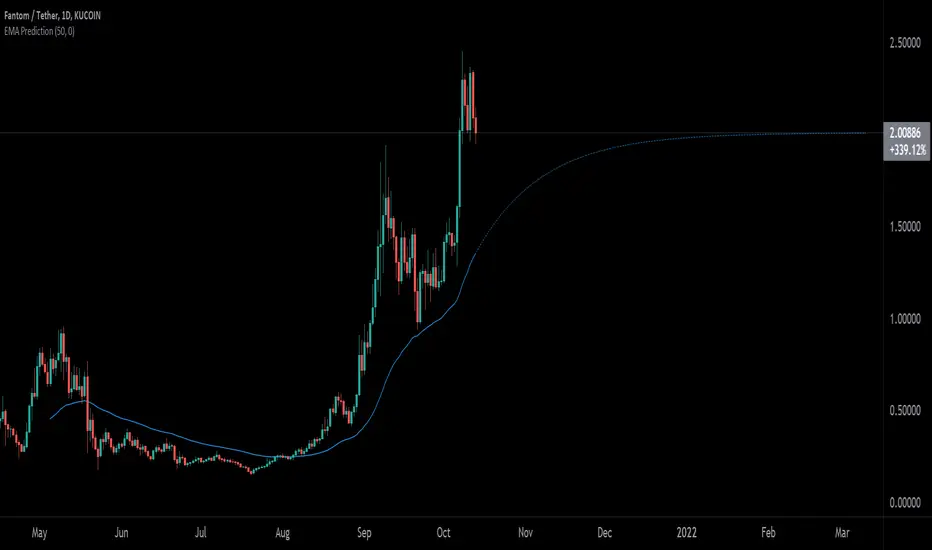
EMA PredictionThis script predicts future EMA values assuming that the price remains as configured (-50% to +50%).
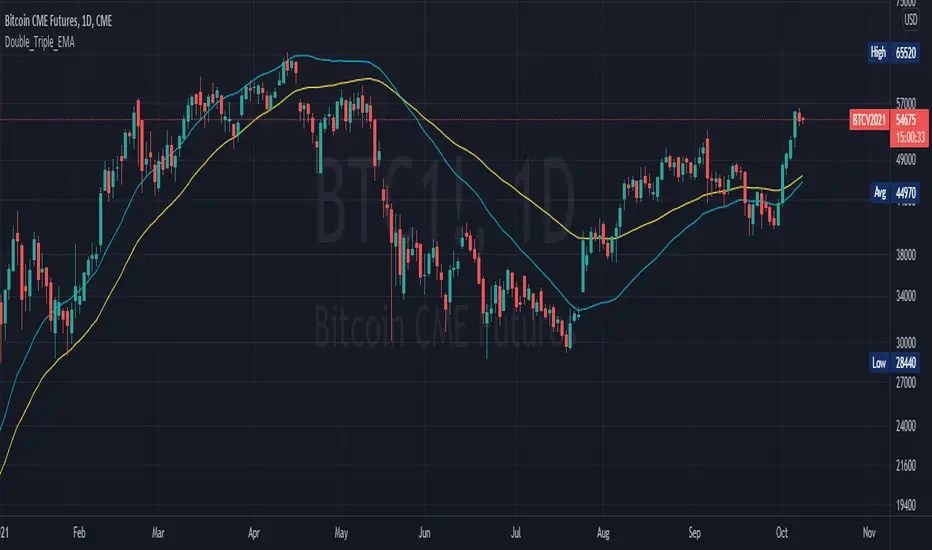
Double_Triple_EMALibrary "Double_Triple_EMA"
Provides the functions to calculate Double and Triple Exponentional Moving Averages (DEMA & TEMA).
dema(_source, _length) Calculates Double Exponentional Moving Averages (DEMA)
Parameters:
_source : -> Open, Close, High, Low, etc ('close' is used if no argument is supplied)
_length : -> DEMA length
Returns: Double Exponential Moving Average (DEMA) of an input source at the specified input length
tema(_source, _length) Calculates Triple Exponentional Moving Averages (TEMA)
Parameters:
_source : -> Open, Close, High, Low, etc ('close' is used if no argument is supplied)
_length : -> TEMA length
Returns: Triple Exponential Moving Average (TEMA) of an input source at the specified input length
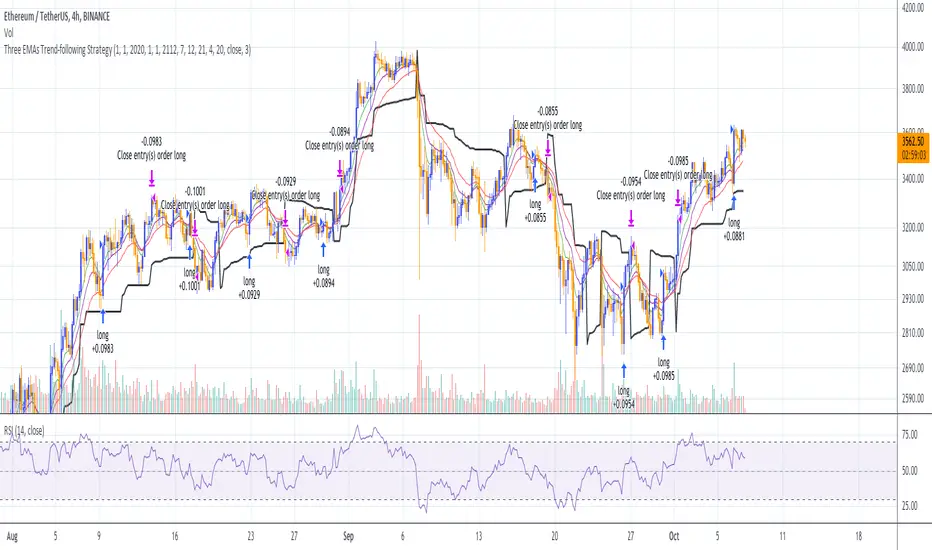
Three EMAs Trend-following Strategy (by Coinrule)Trend-following strategies are great because they give you the peace of mind that you're trading in line with the market.
However, by definition, you're always following . That means you're always a bit later than your want to be. The main challenges such strategies face are:
Confirming that there is a trend
Following the trend, hopefully, early enough to catch the majority of the move
Hopping off the trade when it seems to have run its course
This EMA Trend-following strategy attempts to address such challenges while allowing for a dynamic stop loss.
ENTRY
The trading system requires three crossovers on the same candle to confirm that a new trend is beginning:
Price crossing over EMA 7
Price crossing over EMA 14
Price crossing over EMA 21
The first benefit of using all three crossovers is to reduce false signals. The second benefit is that you know that a strong trend is likely to develop relatively soon, with the help of the fast setup of the three EMAs.
EXIT
The strategy comes with a fixed take profit and a volatility stop, which acts as a trailing stop to adapt to the trend's strength. That helps you get out of the way as soon as market conditions change. Depending on your long term confidence in the asset, you can edit the fixed take profit to be more conservative or aggressive.
The position is closed when:
The price increases by 4%
The price crosses below the volatility stop.
The best time frame for this strategy based on our backtest is the 4-hr. Shorter timeframes can also work well, although they exhibit larger volatility in their returns. In general, this approach suits medium timeframes. A trading fee of 0.1% is taken into account. The fee is aligned to the base fee applied on Binance, which is the largest cryptocurrency exchange.
You can execute this strategy on your favourite exchange at coinrule.com