CBG Rainbow Moving AveragesHere's my Rainbow Moving Average indicator. There are 41 MAs. I also have cross over signals based on 2 separate MAs. I like to use 20 ahd 50 Hull MAs for the signals but you can set those up independently.
Exponentialmovingaverages


DT-21 Moving AveragesI know a lot of people use the free version of TradingView, So I made a script to combine 5 Moving averages as 1 indicator.
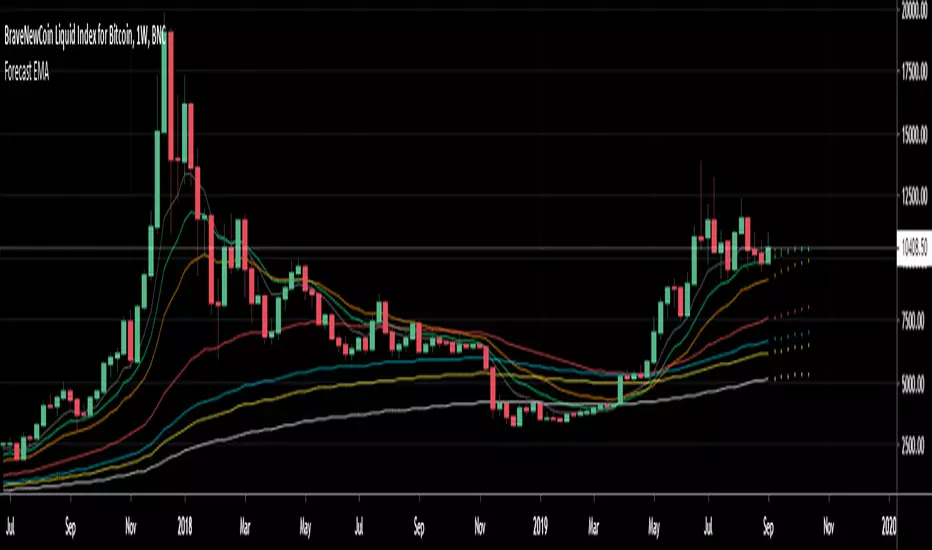
Forecast 7 EMA's 6 periodsForecast 7 EMA's 6 periods
This script is an upgrade of the existing Triple MA Forecast from Yatrader2
To allow the user to display 7 different EMAs and look 6 candles ahead
Default Value
8 ema
13 ema
21 ema
55 ema
100 ema
128 ema
200 ema
Note:
Best to use on high timeframe, if on low timeframe change the forecast maximum to lower
This was made to forecast the 21 ema on weekly timeframe on the upcomming Bitcoin price
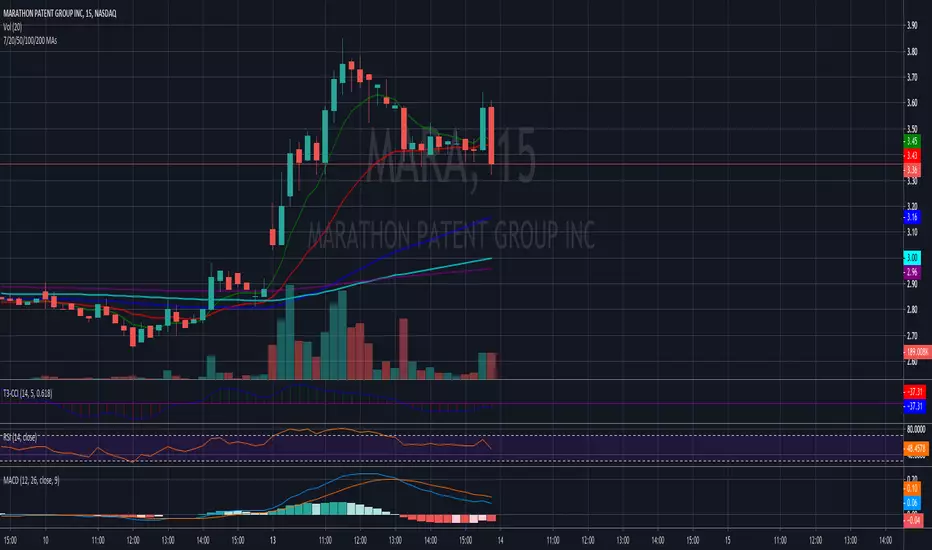
EMA 21,13,8 - scalping3 EMAs will help identify and predict uptrends and downtrends
-If EMAs are all above the candles it a sign to sell & if the EMAs are below its a sign to buy
- If the Green-8 EMA crosses or touches red candle then flips under the other EMAs & candles then it's time to sell
-If the Green-8 EMA crosses or touches green candle then flips above the other EMAs & candles then it's time to buy
- how far is the EMAs from the candle it'll show how strong the trend. combine this strategy with the stochastic oscillator & RSI to get the maximum benefit

4 Fibonacci EMAsAdd 4 Fibonacci EMAs to your charts with one indicator.
Configureable by value, so they don't necessarily have to use Fibonacci numbers, and by colors.

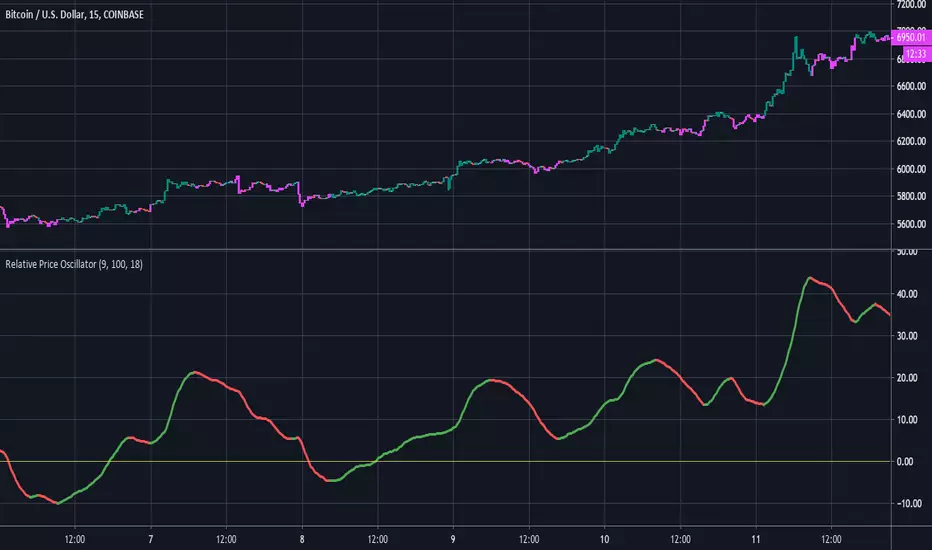
Relative Price OscillatorHere is a new experimental indicator we've been working on. The idea was to compare two EMA's of period midpoints to the actual closing price. The steps that were taken are listed below:
1.Calculate an EMA based on each period's midpoint ((High * Low) /2) for the last 9 periods.
2.Calculate an EMA based on each period's midpoint for the last 100 periods.
3. Divide the difference of the two EMA's by the closing price. ((EMA1 - EMA2) / Close).
4. Smooth the value from step #3 with an 18 period EMA. Multiply by 1000 for better scaling/visibility.
Using:
Bullish when line is green, bearish when line is red. Buy on first green, then sell on first red.
There is also an option to color the candles based on the RPO line.

Double EMA + ATR Trend FollowerThis indicator consists of a fast and slow EMA (default lengths are 50 and 9 periods) and an upper and lower ATR band. When combined, this combination gives traders an accurate picture of both trend strength and direction.
Users can modify the lengths of the fast and slow EMA , as well as the multipliers and length for the upper and lower ATR bands.

Palex 2.0Atualização do SETUP do saudoso Professor Alexandre Fernandes "Palex"
- Bandas de Bolliger (Standard) =
*Banda Superior = Média Móvel Simples (20 dias) + (2 x Desvio Padrão de 20 dias)
*Banda Inferior = Média Móvel Simples (20 dias) – (2 x Desvio Padrão de 20 dias)
- EMA 9 (Média Móvel Exponencial)
- SMA 21 (Média Móvel Simples)
- SMA 200 (Média Móvel Simples) Clássica MA 200 períodos
- SMA 400 (Média Móvel Simples)
- EMA 400 (Média Móvel Exponencial)
- WILD (Média Móvel Welles Wilder)
O mesmo usado pelo nosso grande Mestre PALEX!
Five EMA and Two SMA IndicatorIndicator Modeled After Krowns CrptoCave
-CryptoLumberJack
-BlazkingCryptoJunkies Web Slave Master

24/9 EMA with Bias & SignalsThis is a simple indicator that plots the 24 & 9 EMAs.
It also highlights the potential bias of the market (bull or bear) based on if the 9 EMA is above or below the 24 EMA.
In addition there are signal crosses that you can use for alerts.
This indicator is best used to confirm a particular underlying bias on the 5m, 15M, 1HR, 4HR, and Daily timeframes.
It's important to note on lower timeframes that the bias can be counter trend bias of the overall larger momentum of the instrument you are trading.
For clarity this means that many retraces get going when the 9 crosses the 24. But ultimately the larger timeframe bias will continue after this counter trend retraces.
Combining this indicator with value channels and ATR is what I recommend.

Triple Moving Averages with Bollinger BandsCombines 3 moving averages with Bollinger Bands. Each moving average can be configured to be SMA or EMA.

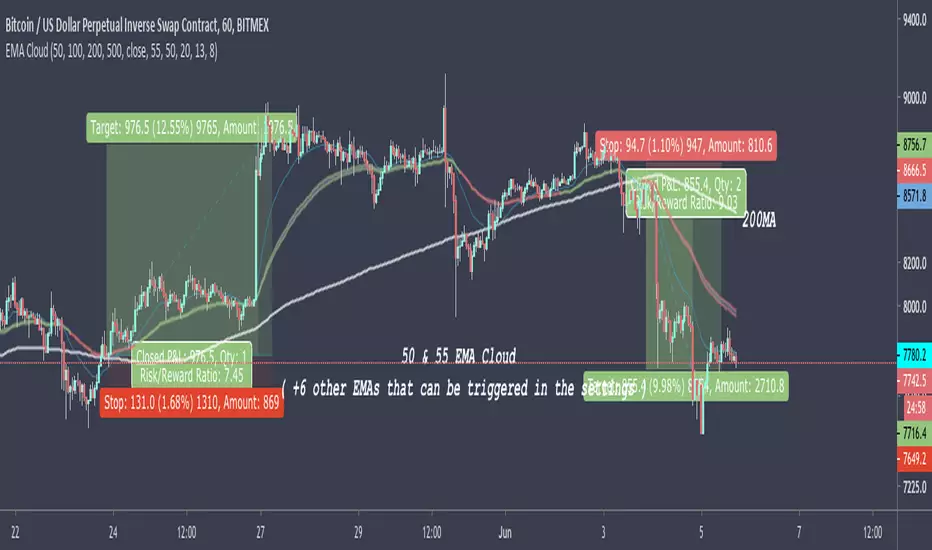
50 & 55 EMA CloudAfter testing thousands of indicators over the years, this simple EMA cloud indicator that I built is still my main weapon. It's always the first one I add to a blank charts and that is not going to change anytime soon.
I find EMAs and MAs are such underrated tools, By observing the price action surrounding these, I can see straight away if it's a good time to get into a trade or not.
As seen here, I also use the 200MA along with the 50/55EMA cloud to find extra strong support and resistances. If price starts to reject both the cloud and the 200MA at the same time/level, then it's a very good indication the price is going to make a big move in that direction as seen here in this chart.
EMA's 5/20/50/200For those who want to use multiple EMA's in a single indicator.
You can also change ema by just editing in pine editor.
For example:
open pine editor and then just alter => "short = ema(close, 5)" to "short = ema(close, 6)"
By doing this your short ema will be changed at your desire.
Just like this you can increase more ema in your script.
For any help you can pm me :)


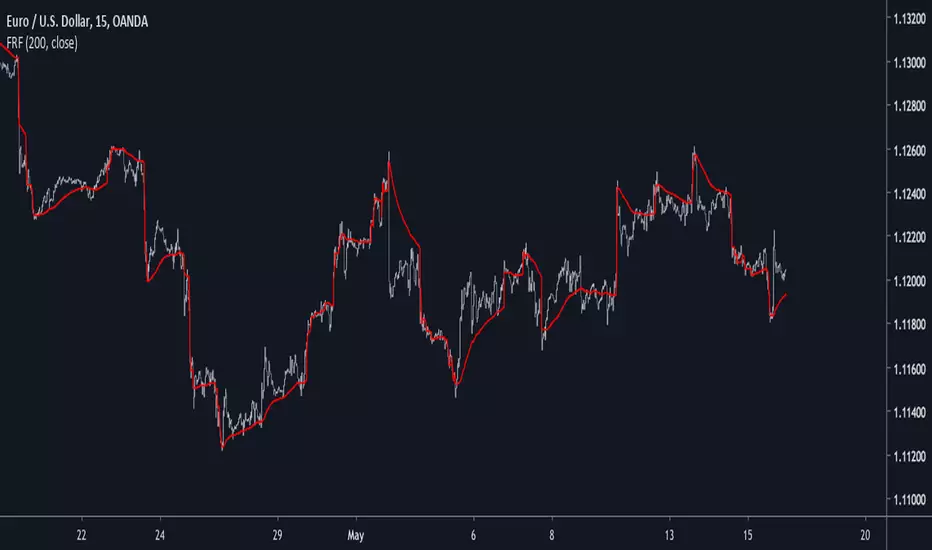
Falling-Rising FilterIntroduction
This is a modification of an old indicator i made. This filter aim to adapt to market trend by creating a smoothing constant using highest and lowest functions. This filter is visually similar to the edge-preserving filter, this similarity can make this filter quite good for MA cross strategies.
On The Filter Code
a = nz(a ) + alpha*nz(error ) + beta*nz(error )
The first 3 terms describe a simple exponential filter where error = price - a , beta introduce the adaptive part. beta is equal to 1 when the price is greater or lower than any past price over length period, else beta is equal to alpha , someone could ask why we use two smoothing variable (alpha, beta) instead of only beta thus having :
a = nz(a ) + beta*nz(error )
well alpha make the filter converge faster to the price thus having a better estimation.
In blue the filter using only beta and in red the filter using alpha and beta with both length = 200 , the red filter converge faster to the price, if you need smoother results but less precise estimation only use beta .
Conclusion
I have presented a simple indicator using rising/falling functions to calculate an adaptive filter, this also show that when you create an exponential filter you can use more terms instead of only a = a + alpha*(price - a ) . I hope you find this indicator useful.
Thanks for reading !
7/20 EMAs 50/100/200 SMAs as One Script.This is one of the scripts I use daily as a full time daytrader. It works well for me to predict MA resistance and support levels and has been very reliable.
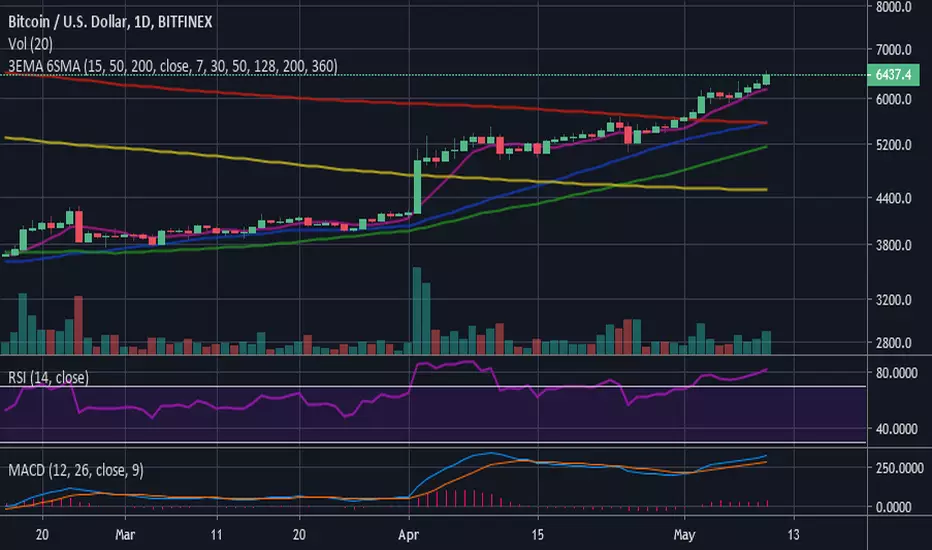
3 EMA (15-50-200) - 6 SMA (7-30-50-128-200-360)3 Moving Average Exponential - 6 Simple Moving Average . Crypto EMA - MA . 7 is a fast support or resistance, 15 confirmation support or resistance. 30 Important support and resistance . 50 institutional support or resistance. 200 institutional general trend, support and resistance , 360 general trend, support and resistance . The use of EMA or MA is according to your liking/trading plan
QEMA - 9 EMAs (10, 20, 50 - 400) / CryptoprospaBy adding this one indicator to your chart, you save time and effort for the EMAs you want.
You can add this and then modify which ones you want visible in the settings.
It covers the 10, 20, 50, 100, 150, 200, 250, 300, 400 EMAs
Enjoy.
Cryptoprospa.

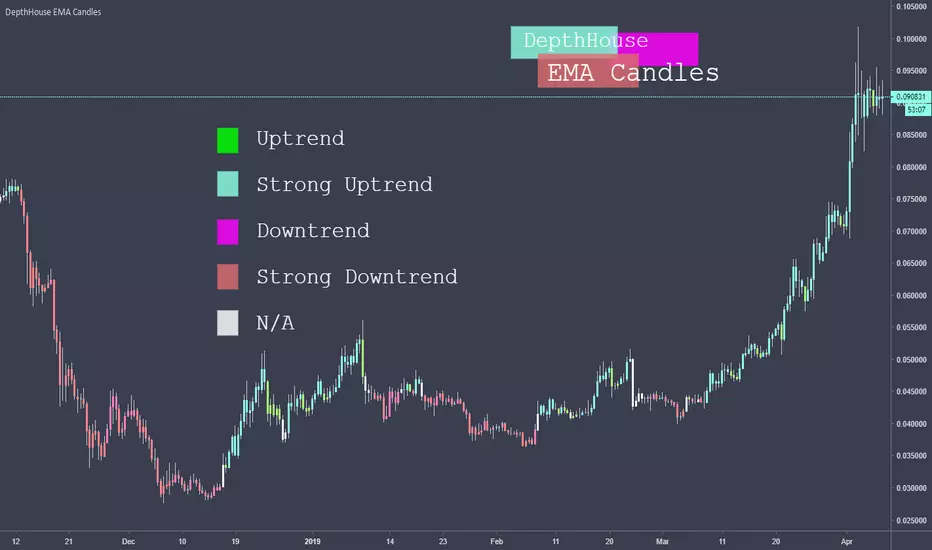
DepthHouse Exponential CandlesThis EMA Candles indicator use the price movement between two user selected Exponential Moving Averages to help determine the current trend.
As of release, there are 5 possible bar color outputs, all of which are shown in the legend above.
The Five Electable Color Outputs:
Uptrend; Strong Uptrend; Downtrend; Strong Downtrend; n/a
I hope you all enjoy!
Please leave your suggestions in the comments below!
Multi Poles Zero-Lag Exponential Moving AverageIntroduction
Based on the exponential averaging method with lag reduction, this filter allow for smoother results thanks to a multi-poles approach. Translated and modified from the Non-Linear Kalman Filter from Mladen Rakic 01/07/19 www.mql5.com
The Indicator
length control the amount of smoothing, the poles can be from 1 to 3, higher values create smoother results.
Difference With Classic Exponential Smoothing
A classic 1 depth recursion (Single smoothing) exponential moving average is defined as y = αx + (1 - α)y which can be derived into y = y + α(x - y )
2 depth recursion (Double smoothing) exponential moving average sum y with b in order to reduce the error with x , this method is calculated as follow :
y = αx + (1 - α)(y + b)
b = β(y - y ) + (1-β)b
The initial value for y is x while its 0 for b with α generally equal to 2/(length + 1)
The filter use a different approach, from the estimation of α/β/γ to the filter construction.The formula is similar to the one used in the double exponential smoothing method with a difference in y and b
y = αx + (1 - α)y
d = x - y
b = (1-β)b + d
output = y + b
instead of updating y with b the two components are directly added in a separated variable. Poles help the transition band of the frequency response to get closer to the cutoff point, the cutoff of an exponential moving average is defined as :
Cf = F/2π acos(1 - α*α/(2(1 - α)))
Also in order to minimize the overshoot of the filter a correction has been added to the output now being output = y + 1/poles * b
While this information is far being helpful to you it simply say that poles help you filter a great amount of noise thus removing irregularities of the filter.
Conclusion
The filter is interesting and while being similar to multi-depth recursion smoothing allow for more varied results thanks to its 3 poles.
Feel free to send suggestions :)
Thanks for reading