Cypher Harmonic Pattern [TradingFinder] Cypher Pattern Detector🔵 Introduction
The Cypher Pattern is one of the most accurate and advanced harmonic patterns, introduced by Darren Oglesbee. The Cypher pattern, utilizing Fibonacci ratios and geometric price analysis, helps traders identify price reversal points with high precision. This pattern consists of five key points (X, A, B, C, and D), each playing an important role in determining entry and exit points in the financial markets.
The reversal point typically occurs in the XD region, with the Fibonacci ratio ranging between 0.768 and 0.886. This zone is referred to as the Potential Reversal Zone (PRZ), where traders anticipate price changes to occur.
The Cypher harmonic pattern is popular among professional traders due to its high accuracy in identifying market trends and reversal points. The pattern appears in two forms: bullish Cypher pattern and bearish Cypher pattern.
In the bullish Cypher pattern, after a price correction, the price moves upward, while in the bearish Cypher pattern, the price moves downward after a temporary increase. These patterns help traders use technical analysis to identify strong reversal points in the PRZ and execute more optimal trades.
Bullish Cypher Pattern :
Bearish Cypher Pattern :
🔵 How to Use
The Cypher pattern is one of the most complex and precise harmonic patterns, leveraging Fibonacci ratios to help traders identify price reversals. This pattern is comprised of five key points, each playing a critical role in determining entry and exit points.
The Cypher pattern appears in two main types :
Bullish Cypher pattern : This pattern appears as an M shape on the chart and indicates a trend reversal to the upside after a price correction. Traders can prepare for buying after identifying this pattern in technical analysis.
Bearish Cypher pattern : This pattern appears as a W shape and signals the start of a downtrend after a temporary price increase. Traders can use this pattern to enter short positions.
🟣 How to Identify the Cypher Pattern on a Chart
Identifying the Cypher pattern requires precision and the use of advanced technical analysis tools. The pattern consists of four main legs, each identified using Fibonacci ratios and geometric analysis.
To spot the Cypher pattern on a chart, first, identify the five key points : X, A, B, C, and D.
XA leg : The initial move from point X to A.
AB leg : The first correction after the XA move, where the price moves to point B.
BC leg : After the correction, the price moves upwards to point C.
CD leg : The final price move that reaches point D, where a price reversal is expected.
In a bullish Cypher pattern, point D indicates the start of a new uptrend, while in a bearish Cypher pattern, point D signals the beginning of a downtrend. Correctly identifying these points helps traders determine the best time to enter a trade.
🟣 How to Trade Using the Cypher Pattern
Once the Cypher pattern is identified on the chart, traders can use it to set entry and exit points. Point D is the key point for trade entry. In the bullish Cypher pattern, the trader can enter a long position after point D forms, while in the bearish Cypher pattern, point D serves as the ideal point for entering a short position.
🟣 Entering a Buy Trade with the Bullish Cypher Pattern
In a bullish Cypher pattern, traders wait for the price to reach point D, after which they can enter a buy position. At this point, the price is expected to start rising.
🟣 Entering a Sell Trade with the Bearish Cypher Pattern
In a bearish Cypher pattern, the trader enters a sell position at point D, expecting the price to move downward after reaching this point. For additional confirmation, traders can use technical indicators such as RSI or MACD.
🟣 Risk Management in Cypher Pattern Trades
Risk management is one of the most critical aspects of any trade, and this holds true for trading the Cypher pattern. Traders should always use stop-loss orders to prevent larger losses in case the pattern fails.
In the bullish Cypher pattern, the stop-loss is usually placed slightly below point D to exit the trade if the price continues to drop.
In the bearish Cypher pattern, the stop-loss is placed above point D to limit losses if the price rises unexpectedly.
🟣 Combining the Cypher Pattern with Other Technical Tools
The Cypher pattern is a powerful tool in technical analysis, but combining it with other methods such as price action and technical indicators can improve trading accuracy.
🟣 Combining with Price Action
Traders can use price action to confirm the Cypher pattern. Candlestick patterns like reversal candlesticks can provide additional confirmation for price reversals at point D.
🟣 Using Technical Indicators
Incorporating technical indicators such as RSI and MACD can also help traders receive stronger signals for entering trades based on the Cypher pattern. These indicators help identify overbought or oversold conditions, allowing traders to make more informed decisions.
🟣 Advantages and Disadvantages of the Cypher Pattern in Technical Analysis
Advantages :
High accuracy : The Cypher pattern, using Fibonacci ratios and geometric analysis, provides high precision in identifying reversal points.
Applicable in various markets : This pattern can be used in a wide range of financial markets, including forex, stocks, and cryptocurrencies.
Disadvantages :
Rarit y: The Cypher pattern appears less frequently on charts compared to other harmonic patterns.
Complexity : Accurately identifying this pattern requires significant experience, which may be challenging for novice traders.
🔵 Setting
🟣 Logical Setting
ZigZag Pivot Period : You can adjust the period so that the harmonic patterns are adjusted according to the pivot period you want. This factor is the most important parameter in pattern recognition.
Show Valid Forma t: If this parameter is on "On" mode, only patterns will be displayed that they have exact format and no noise can be seen in them. If "Off" is, the patterns displayed that maybe are noisy and do not exactly correspond to the original pattern.
Show Formation Last Pivot Confirm : if Turned on, you can see this ability of patterns when their last pivot is formed. If this feature is off, it will see the patterns as soon as they are formed. The advantage of this option being clear is less formation of fielded patterns, and it is accompanied by the latest pattern seeing and a sharp reduction in reward to risk.
Period of Formation Last Pivot : Using this parameter you can determine that the last pivot is based on Pivot period.
🟣 Genaral Setting
Show : Enter "On" to display the template and "Off" to not display the template.
Color : Enter the desired color to draw the pattern in this parameter.
LineWidth : You can enter the number 1 or numbers higher than one to adjust the thickness of the drawing lines. This number must be an integer and increases with increasing thickness.
LabelSize : You can adjust the size of the labels by using the "size.auto", "size.tiny", "size.smal", "size.normal", "size.large" or "size.huge" entries.
🟣 Alert Setting
Alert : On / Off
Message Frequency : This string parameter defines the announcement frequency. Choices include: "All" (activates the alert every time the function is called), "Once Per Bar" (activates the alert only on the first call within the bar), and "Once Per Bar Close" (the alert is activated only by a call at the last script execution of the real-time bar upon closing). The default setting is "Once per Bar".
Show Alert Time by Time Zone : The date, hour, and minute you receive in alert messages can be based on any time zone you choose. For example, if you want New York time, you should enter "UTC-4". This input is set to the time zone "UTC" by default.
🔵 Conclusion
The Cypher harmonic pattern is one of the most powerful and accurate patterns used in technical analysis. Its high precision in identifying price reversal points, particularly within the Potential Reversal Zone (PRZ), has made it a popular tool among professional traders. The PRZ, located between the Fibonacci ratios of 0.768 and 0.886 in the XD region, offers traders a clear indication of where price reversals are likely to occur.
However, to use this pattern successfully, traders must employ proper risk management and combine it with supplementary tools like technical indicators and price action. By understanding how to utilize the PRZ, traders can enhance the accuracy of their trade entries and exits.
Ultimately, the Cypher pattern, when used in conjunction with the PRZ, helps traders make more precise decisions in the financial markets, leading to more successful and well-informed trades.
Fibonnacci

Fibonacci Swing Trading BotStrategy Overview for "Fibonacci Swing Trading Bot"
Strategy Name: Fibonacci Swing Trading Bot
Version: Pine Script v5
Purpose: This strategy is designed for swing traders who want to leverage Fibonacci retracement levels and candlestick patterns to enter and exit trades on higher time frames.
Key Components:
1. Multiple Timeframe Analysis:
The strategy uses a customizable timeframe for analysis. You can choose between 4hour, daily, weekly, or monthly time frames to fit your preferred trading horizon. The high and low-price data is retrieved from the selected timeframe to identify swing points.
2. Fibonacci Retracement Levels:
The script calculates two key Fibonacci retracement levels:
0.618: A common level where price often retraces before resuming its trend.
0.786: A deeper retracement level, often used to identify stronger support/resistance areas.
These levels are dynamically plotted on the chart based on the highest high and lowest low over the last 50 bars of the selected timeframe.
3. Candlestick Based Entry Signals:
The strategy uses candlestick patterns as the only indicator for trade entries:
Bullish Candle: A green candle (close > open) that forms between the 0.618 retracement level and the swing high.
Bearish Candle: A red candle (close < open) that forms between the 0.786 retracement level and the swing low.
When these candlestick patterns align with the Fibonacci levels, the script triggers buy or sell signals.
4. Risk Management:
Stop Loss: The stop loss is set at 1% below the entry price for long trades and 1% above the entry price for short trades. This tight risk management ensures controlled losses.
Take Profit: The strategy uses a 2:1 risk-to-reward ratio. The take profit is automatically calculated based on this ratio relative to the stop loss.
5. Buy/Sell Logic:
Buy Signal: Triggered when a bullish candle forms above the 0.618 retracement level and below the swing high. The bot then places a long position.
Sell Signal: Triggered when a bearish candle forms below the 0.786 retracement level and above the swing low. The bot then places a short position.
The stop loss and take profit levels are automatically managed once the trade is placed.
Strengths of This Strategy:
Swing Trading Focus: The strategy is ideal for swing traders, targeting longer-term price moves that can take days or weeks to play out.
Simple Yet Effective Indicators: By only relying on Fibonacci retracement levels and basic candlestick patterns, the strategy avoids complexity while capitalizing on well-known support and resistance zones.
Automated Risk Management: The built-in stop loss and take profit mechanism ensures trades are protected, adhering to a strict 2:1 risk/reward ratio.
Multiple Timeframe Analysis: The script adapts to various market conditions by allowing users to switch between different timeframes (4hour, daily, weekly, monthly), giving traders flexibility.
Strategy Use Cases:
Retracement Traders: Traders who focus on entering the market at key retracement levels (0.618 and 0.786) will find this strategy especially useful.
Trend Reversal Traders: The strategy’s reliance on candlestick formations at Fibonacci levels helps traders spot potential reversals in price trends.
Risk Conscious Traders: With its 1% risk per trade and 2:1 risk/reward ratio, the strategy is ideal for traders who prioritize risk management in their trades.

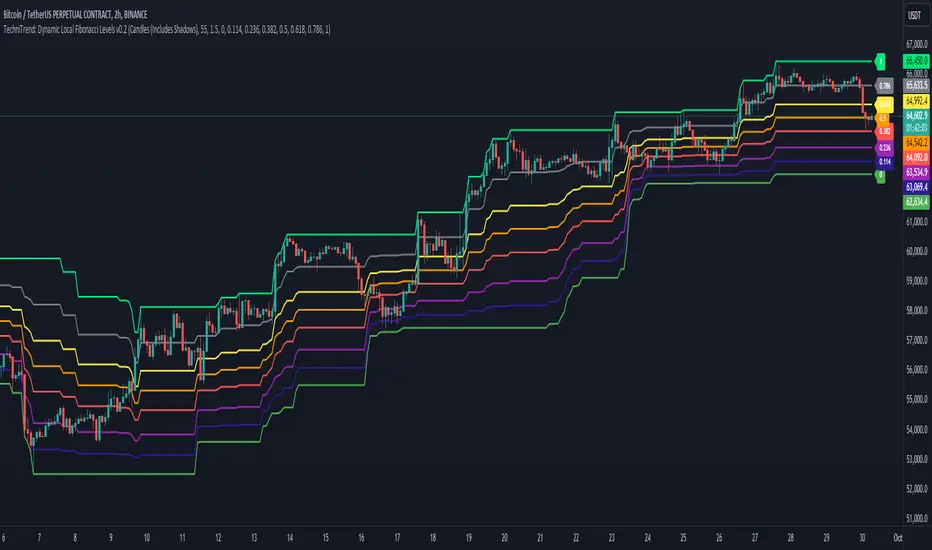
TechniTrend: Dynamic Local Fibonacci LevelsTechniTrend: Dynamic Local Fibonacci Levels
Description: The "Dynamic Local Fibonacci Levels" indicator dynamically displays Fibonacci levels only when the market is experiencing significant volatility. By detecting volatile price movements, this tool helps traders focus on Fibonacci retracement levels that are most relevant during high market activity, reducing noise from calm market periods.
Key Features:
Adaptive Fibonacci Levels: The indicator calculates and plots Fibonacci levels (from 0 to 1) only during periods of high volatility. This helps traders focus on actionable levels during significant price swings.
Customizable Chart Type: Users can choose between Candlestick charts (including shadows) or Line charts (excluding shadows) to determine the high and low price points for Fibonacci level calculations.
Volatility-Based Detection: The Average True Range (ATR) is used to detect significant volatility. Traders can adjust the ATR multiplier to fine-tune the sensitivity of the indicator to price movements.
Fully Customizable Fibonacci Levels: Traders can modify the default Fibonacci levels according to their preferences or trading strategies.
Real-Time Volatility Confirmation: Fibonacci levels are displayed only if the price range between the local high and low exceeds a user-defined volatility threshold, ensuring that these levels are only plotted when the market is truly volatile.
Customization Options:
Chart Type: Select between "Candles (Includes Shadows)" and "Line (Excludes Shadows)" for detecting price highs and lows.
Length for High/Low Detection: Choose the period for detecting the highest and lowest price in the given time frame.
ATR Multiplier for Volatility Detection: Adjust the sensitivity of the volatility threshold by setting the ATR multiplier.
Fibonacci Levels: Customize the specific Fibonacci levels to be displayed, from 0 to 1.
Usage Tips:
Focus on Key Levels During Volatility: This indicator is best suited for periods of high volatility. It can help traders identify potential support and resistance levels that may be more significant in turbulent markets.
Adjust ATR Multiplier: Depending on the asset you're trading, you might want to fine-tune the ATR multiplier to better suit the market conditions and volatility.
Recommended Settings:
ATR Multiplier: 1.5
Fibonacci Levels: Default levels set to 0.00, 0.114, 0.236, 0.382, 0.5, 0.618, 0.786, and 1.0
Length for High/Low Detection: 55
Use this indicator to detect key Fibonacci retracement levels in volatile market conditions and make more informed trading decisions based on price dynamics and volatility.
FiboTrace.V33FiboTrace.V33 - Advanced Fibonacci Retracement Indicator is a powerful and visually intuitive Fibonacci retracement indicator designed to help traders identify key support and resistance levels across multiple timeframes. Whether you’re a day trader, swing trader, or long-term investor, FiboTrace.V33 provides the essential tools needed to spot potential price reversals and continuations with precision.
Key Features:
• Dynamic Fibonacci Levels: Automatically plots the most relevant Fibonacci retracement levels based on recent swing highs and lows, ensuring you always have the most accurate and up-to-date levels on your chart.
• Gradient Color Zones: Easily distinguish between different Fibonacci levels with visually appealing gradient color fills. These zones help you quickly identify key areas of price interaction, making your analysis more efficient.
• Customizable Levels: Tailor FiboTrace.V33 to your trading style by adjusting the Fibonacci levels and colors to match your preferences. This flexibility allows you to focus on the levels most relevant to your strategy.
• Multi-Timeframe Versatility: Works seamlessly across all timeframes, from 1-minute charts for day traders to weekly and monthly charts for long-term investors. The indicator adapts to your trading horizon, providing reliable signals in any market environment.
• Confluence Alerts: Receive alerts when price enters zones where multiple Fibonacci levels overlap, indicating strong support or resistance. This feature helps you catch high-probability trade setups without constantly monitoring the charts.
How to Use:
• Identify Entry and Exit Points: Use the plotted Fibonacci levels to determine potential entry and exit points. Price retracements to key Fibonacci levels can signal opportunities to enter trades in the direction of the prevailing trend.
• Spot Reversals and Continuations: Watch for price action around the gradient color zones. A bounce off a Fibonacci level may indicate a trend continuation, while a break could signal a potential reversal.
• Combine with Other Indicators: For best results, consider using FiboTrace.V33 in conjunction with other technical indicators, such as moving averages, RSI, or MACD, to confirm signals and enhance your trading strategy.
Timeframe Recommendations:
• Shorter Timeframes (1-minute to 1-hour): Ideal for quick, intraday trades, though signals might be more prone to noise due to rapid market fluctuations.
• Medium Timeframes (4-hour to daily): Perfect for swing trading, offering more reliable Fibonacci levels that capture broader market trends.
• Longer Timeframes (weekly to monthly): Best for long-term investors, where Fibonacci levels act as strong support and resistance based on significant market moves.
• General Tip: Fibonacci retracement levels are more reliable on higher timeframes, but combining them with other indicators like moving averages or RSI can enhance signal accuracy across any timeframe.
Why FiboTrace.V33?
FiboTrace.V33 is more than just a Fibonacci retracement tool—it’s an essential part of any trader’s toolkit. Its intuitive design and advanced features help you stay ahead of the market, making it easier to identify high-probability trading opportunities and manage risk effectively.

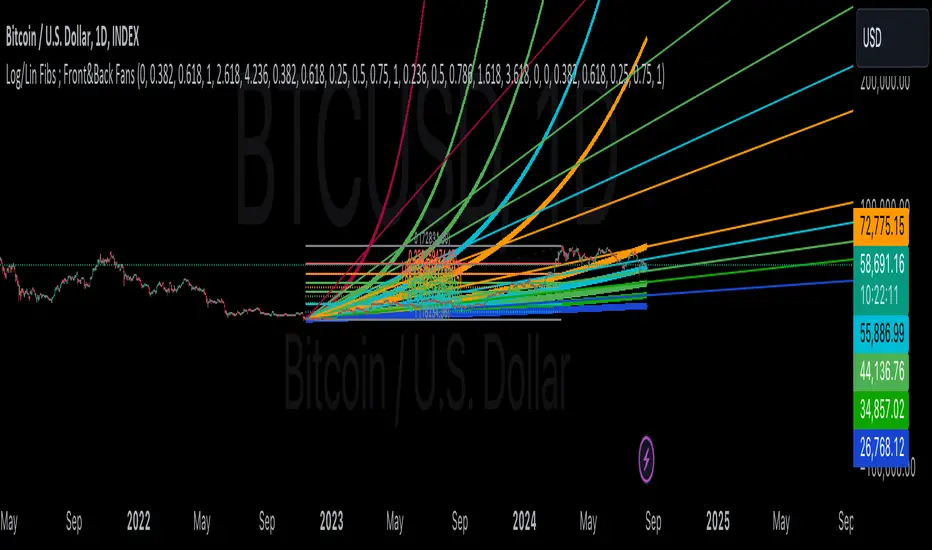
Linear and Logarithmic Fibonacci Levels and (Price&Time) FansIntroduction
The Fibonacci Retracement tool is a go-to for traders looking to spot potential support and resistance levels. By measuring the distance between swing highs and lows, you can apply Fibonacci ratios like 0.236, 0.382, and 0.618 to predict key market levels.
Traditionally, these levels are set by dividing this distance into equal parts—known as Linear Levels. A more refined approach, Logarithmic Price and Time Levels, divides the distance into proportionally equal segments. Plus, this indicator now includes Fibonacci fans, adding another layer of analysis by projecting potential price levels using trendlines based on Fibonacci ratios.
This tool makes it easier to identify both Linear and Logarithmic levels while also leveraging Fibonacci fans for a more complete market view.
Applications
Logarithmic Levels and Fibonacci fans are ideal for volatile markets. In crypto, they’re especially effective for BTCUSDT (check out the wick from January 23, 2024). They also help spot accumulation and distribution patterns in high-volume altcoins like FETUSDT . In traditional markets, they’re useful for tracking stocks like TSLA and NVDA with extreme price swings, as well as indices in inflation-affected markets like XU100 , or recession-hit currency pairs like JPYUSD .
How to Use
This indicator is intuitive and similar to TradingView’s Fibonacci Tool. Select your reference levels (Level 1 and Level 0), then tweak the settings to customize your analysis, including adding Fibonacci fans for extra insights.
Why It’s Different
Unlike TradingView’s tool, which forces you to switch to a logarithmic scale (messing with other indicators and trend lines), this indicator lets you view both Linear and Logarithmic levels—and Fibonacci fans on Price and Time Series—without changing your chart’s scale. The original Fibonacci Code was derived from zekicanozkanli, modified and upgraded to plot fib front and back fans as well. Due to TV Max Plot restrictions I need to publish just Front and Back and Front Fibs separately.
Candle Fibs [QuantVue]The Candles Fib indicator is designed to help traders find potential levels of support and resistance based on ATR and Fibs.
How the Indicator Works
Identification of Large Candles:
🔹The indicator begins by identifying "large candles" based on their size relative to the Average True Range (ATR).
🔹 ATR (Average True Range) : ATR is a technical analysis indicator that measures market volatility by averaging the true range over a specified period, default 10 periods. The true range is the greatest of the following:
The difference between the current high and current low.
The difference between the previous close and the current high.
The difference between the previous close and the current low.
🔹In this script, a candle is considered "large" if its true range (the difference between the high and low) is at least twice the ATR.
Calculation of Fibonacci Levels:
🔹Once a large candle is identified, the indicator calculates key Fibonacci retracement levels based on the size of the candle.
🔹 Fibonacci Retracement : Fibonacci retracement levels are horizontal lines that indicate where support and resistance are likely to occur. These levels are derived from the Fibonacci sequence, a series of numbers where each number is the sum of the two preceding ones, often found in nature and markets.
🔹The most commonly used Fibonacci retracement levels are 0.382, 0.50, 0.618, and 0.786. In this indicator, the 0.50 and 0.618 levels are used.
Dynamic Plotting and Management of Levels:
🔹The indicator plots these Fibonacci levels as horizontal lines on the chart automatically.
🔹These lines extend as new bars (candlesticks) are formed, allowing the trader to see how the market reacts to these levels in real-time.
Give this indicator a BOOST and COMMENT your thoughts below!
We hope you enjoy.
Cheers!

Three Drive Pattern Detector [LuxAlgo]The Three Drives Pattern Detector indicator focuses on detecting and displaying completed Three Drives patterns on the user chart. This harmonic pattern is characterized by successive higher highs / lower lows following specific ratios.
The script uses a multi-length swing detection approach, as well as adjusting ratios to ensure flexibility and a maximum number of visible Three Drives patterns.
🔶 USAGE
The bullish/bearish Three Drives pattern is commonly interpreted as a reversal pattern and is characterized by three extensions (drives) and two intermediary retracements creating consecutive higher lows (for a bullish case) or lower highs (for a bearish case).
The multi-length swing detection approach taken by the indicator allows for detecting shorter-term alongside medium/longer-term patterns simultaneously, allowing to increase in the amount of detected patterns.
Users can set a Minimum Swing length (for example 2) and a Maximum Swing length (for example 100) which defines the range of the swing point detection length, higher values for these settings will detect longer-term Three-Drives patterns, while a larger range will allow for the detection of a larger number of patterns.
Sometimes multiple dashed lines as the last segment can be observed. This means multiple Three Drives patterns sharing multiple swing points have formed, with only the last segment being different.
🔹 Retracement/Extension Ratios
The Three Drives pattern often associates the retracement/extension to Fibonacci ratios of respectively 0.618/1.272.
Some sources specify a maximum retracement/extension level of 0.786/1.618, which means the retracement should be within the 0.618-0.786 range and the extension between 1.272-1.618.
Since finding a pattern where the retracement/extension is precisely at the 0.618/1.272 levels, or even between 0.618-0.786/1.272-1.618 is rare, the script allows users to adjust those ratios, which ensures more flexibility. Depending on the widening/tightening of the ratios, allowing users to find more patterns (but potentially less valid) or more valid (but fewer patterns).
In the example above, " Show Ratios " is set to " Ratios With Margin ", showing the ideal retracement/extension level together with the margin, while in the example below, " Show Ratios " is set to " Ratios ", which shows only a line where the price should ideally reverse.
While setting the ratios wider will result in more frequent but less valid patterns, it can also create good trading opportunities.
🔹 Best Practices
The indicator doesn't include Stop Loss (SL) or Take Profit (TP) levels, however, the 1.618 Fibonacci Extension level of the last leg can commonly be used as stop loss.
Typical Take Profit areas include:
Starting point of the pattern
Each retracement level (2x)
The 0.618 retracement level of the complete pattern
In the above bullish examples, the price was lower than the lowest point of the pattern. The price reversed and attained all TP levels without hitting the SL level.
In the above bearish example, the price went above the highest point of the pattern but did not hit the SL level, after which two TP levels were hit. Then, the price quickly went up, just missing the SL level before it came back down again, hitting the last 2 TP levels.
This example shows that other Fibonacci levels an also be effective when combined with the Three Drives pattern, even in the longer term.
🔶 DETAILS
🔹 Multi Length
The core of this publication is the multi-length swing detection. To ensure the maximum amount of Three Drives patterns are found, up to 99 different swing length periods can be used to detect swing points which are then tested for valid patterns.
Using a wider variety of swing points also ensures that patterns visible only with specific Swing settings can be found on the same chart without the user needing to constantly adjust the Swing settings to find other patterns.
The user only needs to set the desired minimum and maximum Swing Length.
In this case, swing detection using swing Lengths from 3 to 100 (97 different) are computed and evaluated for patterns. Three different patterns were found on the same chart, with swing lengths 3, 4, and 6.
Note: The Maximum Swing length should be equal to or higher than the Minimum Swing Length . If the maximum value is lower than the minimum, the script will automatically take the minimum value as the maximum to prevent errors.
🔹 Width Margin %
Users can filter out patterns based on the duration of each extension/retracement segment. When the users want segments of the detected patterns to be of a similar duration, the width percentage should be set lower. When the focus is on detecting more patterns the width percentage can be set higher.
🔹 Retracement/Extension Settings
Show Ratios , set to Ratios , show the ideal Fibonacci retracement/extension level, while Ratios With Margin (example below) show the additional margins for retracement/extension.
The upper and lower limits can be visualized while hovering over the calculated ratio label.
The dashed line shows an older pattern, where the last leg has been updated.
🔹 Last Known Pattern
The included dashboard highlights the date of the most recently detected pattern; the text will show " None " if no pattern is found.
🔹 Calculated Bars
The "Calculated Bars" setting makes use of the recently introduced calc_bars_count parameter, making it possible to effectively reduce the number of historical bars during the computation of the script, which significantly improves the loading speed of the script.
Users wishing to see the most recent patterns can set this setting to 1000 for example, where only the most recent 1000 bars are used to find patterns. If every bar must be used for pattern detection, set " Calculated bars " at 0.
🔶 SETTINGS
Minimum Swing Length: Minimum length used for the swing detection.
Maximum Swing Length: Maximum length used for the swing detection.
Retracement: Range of required ratios used for testing retracements.
Extension: Range of required ratios used for testing extensions.
Width Margin: Influences the symmetry of the pattern; with a higher number allowing for less symmetry.
🔹 Style
Text Size: Text size of the ratio labels.
Show Ratios: Show the ideal ratio, upper/lower limit of ratios, or none.
🔹 Dashboard
Show Dashboard: Toggle dashboard which shows the date of the last found pattern.
Location: Location of the dashboard on the chart.
Size: Text size.
🔹 Calculation
Calculated Bars: Allows the usage of fewer bars for performance/speed improvement.

Higher Timeframe Open High Low ClosePURPOSE
1. Multi-timeframe analysis (MTFA).
2. Better visualize intraday price action relative higher timeframe price action, and this is not limited to the current time frame or the higher time frame including current price movement.
3. Higher Timeframes provides an overview of the long-term trend (e.g., weekly or monthly charts).
4. Confirm trends occurring on more than one timeframe.
5. Improve choice of entry and exit points.
ORIGINALITY
1. Compare current lower time frame price movement to current or previous higher time frame movement. The user specifies in the settings the higher time frame (day, week, month, quarter, or year) and the associated price movement data, including OHLC, average prices, and moving average levels.
2. Previous time frames and all specified levels (OHLC, average prices, and moving averages) can be shifted together to overlay the current time frame. This allows analysis of lower/intraday price movement against that of any past higher time frames.
3. Use: In the settings, the current time frame (i.e., that including current price movement) 'count from current' is '0', a count of '1' would shift one higher level time frame such that the open date of that shifted time frame aligns with the open date of the current time frame. A count of '3' would shift three higher level time frames to align with the current."
4. Example: On the Wednesday July 24 intraday chart, overlay the daily OHLC, typical price, and 10-day EMA data occurring at the close of Wednesday July 17. This allows analyze current price movement against data from one week prior.
HIGHER TIMEFRAME DATA that can be PLOTTED and SHIFTED
1. Open, High, Low, Close.
2. Average prices: Median (HL/2), Typical (HLC/3), (Average OHLC/4), Body Median (OC/2), Weighted Close (HL2C/4), Biased 01 (HC/2 if Close > Open, else LC/2), Biased 02 (High if Close > HL/2, else Low), Biased 03 (High if Close > Open, else Low).
3. Moving averages with user specified source, length and type.

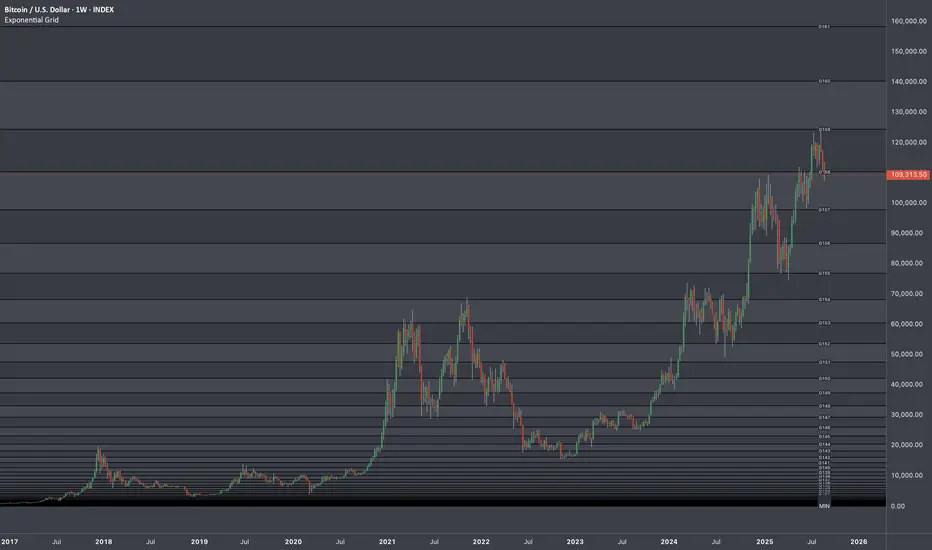
Exponential Grid [Phi, Pi, Euler]If you disagree with one of the EMH principles that price is too random, then by definition you must agree that historic price has deterministic function to a scenario ahead.
I personally believe that constants like phi, pi and e can mimic exponential growth of the price.
In this script, first grid is based on the Lowest price multiplied with self fraction of the constant.
For example:
If you are familiar with fib ratio 1.272, then you must know that it is 1.618 to the power of 0.5.
With default settings of exponent step 0.25
First grid = Lowest price x phi^0.25
Second grid = Lowest price x phi^0.25x2
Third grid = Lowest price x phi^0.25x3 and so on
The script will automatically find the lowest price and update the grid values.
Or you can set up your custom Lowest price manually if you feel like the All Time Low level loses its relevance value after long period.
There are 64 grids including Lowest price level. And it wasn't by a chance. Pine Script has a limitation of max 64 plots. Number of grids shown in the chart depends on the highest price. Once price breaks above ATH a couple of next grids will be plotted automatically. In most cases if everything is plotted, the chart appears squeezed and you'll need to zoom in to see it. Therefore, I adjusted it relatively to the scale of the chart for the comfort.
In some cases 64 plots aren't enough to cover the whole chart. For example, let's take a look at NVIDIA chart:
Since the price has started with 0.0333, it is way too small to cover all with default settings.
We are left with 2 choices:
Either Enable "Round"
OR increase Exponent Step (from 0.25 to 0.5 in the particular example below)
If you set constant to pi or e which is a bigger number than phi, expect the gaps to be bigger. To reduce it to a more gradual way of expansion you can decrease Exponent Step.
FiboSequFiboSequ: Fibonacci Sequence Marking
Leonardo Fibonacci was an Italian mathematician who lived in the 12th century. His real name was Leonardo of Pisa, but he is commonly known as "Fibonacci." Fibonacci is famous for introducing the Hindu-Arabic numeral system to the Western world. This system is the basis of the modern decimal number system we use today.
Fibonacci Sequence
The Fibonacci sequence is a series of numbers that frequently appears in mathematics and nature. The first two numbers in the sequence are 0 and 1, and each subsequent number is the sum of the two preceding numbers.
The sequence is as follows:
0, 1, 1, 2, 3, 5, 8, 13, 21, 34, 55, 89, 144, 233, 377, 610, 987, 1597, 2584, ...
Fibonacci Time Zones:
Fibonacci time zones are used to identify potential turning points in the market at specific time intervals. These time zones correspond to the Fibonacci sequence in terms of consecutive days or weeks.
The Fibonacci sequence has a wide range of applications in both mathematics and nature. Leonardo Fibonacci's work has had a significant impact on the development of modern mathematics and numeral systems. In financial markets, the Fibonacci sequence and ratios are frequently used by technical analysts to predict and analyze market movements.
Description:
Overview:
The FiboSequ indicator marks significant days on a price chart based on the Fibonacci sequence. This can help traders identify potential turning points or areas of interest in the market. The Fibonacci sequence is a series of numbers where each number is the sum of the two preceding ones, often found in nature and financial markets.
Fibonacci Sequence:
The sequence used in this indicator includes: 1, 3, 5, 8, 13, 21, 34, 55, 89, 144, 233, 377, 610, 987, 1597, and 2584.
These numbers represent the days to be marked on the chart, highlighting possible significant market movements.
How It Works:
User Input:
Users can input the starting date (Year, Month, and Day) from which the Fibonacci sequence will begin to be calculated.
This allows flexibility and customization based on the trader's analysis needs.
Calculation:
The starting date is converted into a timestamp in seconds.
For each bar on the chart, the number of days since the starting date is calculated.
The indicator checks if the current day matches any of the Fibonacci sequence days, the previous day, or the next day.
In this indicator, Fibonacci numbers can be displayed on the chart as plus and minus 2 days. For example, for the 145th day, signals start to appear as 143,144 and 145. This is due to dates that sometimes coincide with weekends and public holidays.
Marking the Chart:
When a match is found, a label is placed above the bar indicating the day number from the Fibonacci sequence.
These labels are colored blue with white text for easy visibility.
Usage:
This indicator can be used on any timeframe and market to help identify potential areas where price might react.
It is especially useful for those who employ Fibonacci analysis in their trading strategy.
Example:
If the starting date is January 1, 2020, the indicator will mark significant Fibonacci days (e.g., 1, 3, 5, 8 days, etc.) on the chart from this date onward.
Community Guidelines Compliance:
This indicator adheres to TradingView's Pine Script community guidelines.
It provides customizable user inputs and does not violate any terms of use.
By using the FiboSequ indicator, traders can enhance their technical analysis by incorporating time-based Fibonacci levels, potentially leading to better market timing and decision-making.
Frequently Asked Questions (FAQ)
Q: What is the FiboSequ indicator?
A: The FiboSequ indicator is a technical analysis tool that marks significant days on a price chart based on the Fibonacci sequence. This indicator helps traders identify potential turning points or areas of interest in the market.
Q: What is the Fibonacci sequence and why is it important?
A: The Fibonacci sequence is a series of numbers where each number is the sum of the two preceding ones. The first two numbers are 0 and 1. This sequence frequently appears in nature and financial markets and is used in technical analysis to identify important support and resistance levels.
Q: How do the Fibonacci time zones in the indicator work?
A: Fibonacci time zones are used to identify potential market turning points at specific time intervals. The indicator calculates days based on the Fibonacci sequence (e.g., 1, 3, 5, 8 days, etc.) from the starting date and marks them on the chart.
Q: How can users set the starting date?
A: Users can input the starting date by specifying the year, month, and day. This sets the date from which the indicator begins its calculations, providing flexibility for user analysis.
Q: What do the labels in the indicator represent?
A: The labels mark specific days in the Fibonacci sequence. For example, 1st day, 3rd day, 5th day, etc. These labels are displayed in blue with white text for easy visibility.
Q: Which timeframes can I use the FiboSequ indicator on?
A: The FiboSequ indicator can be used on any timeframe. This includes daily, weekly, or monthly charts, as well as shorter timeframes.
Q: Which markets can the FiboSequ indicator be used in?
A: The FiboSequ indicator can be used in various financial markets, including stocks, forex, cryptocurrencies, commodities, and more.
Q: How can I achieve better market timing with the FiboSequ indicator?
A: The FiboSequ indicator helps identify potential market turning points using time-based Fibonacci levels. This can lead to better market timing and more informed trading decisions for traders.
-Please feel free to write your valuable comments and opinions. I attach importance to your valuable opinions so that I can improve myself.

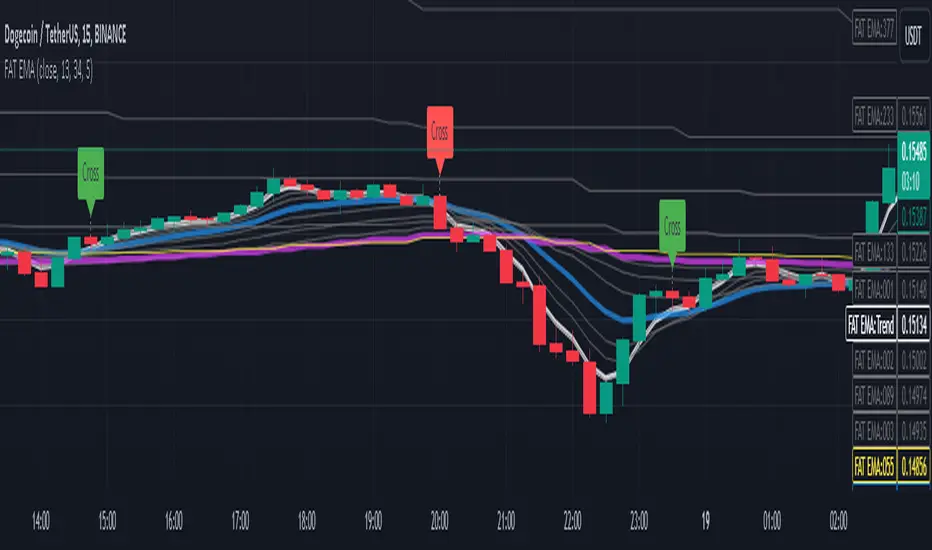
Fibonacci Adaptive Timeframe EMA (FAT EMA)The "Fibonacci Adaptive Timeframe EMA" is a sophisticated trading indicator designed for the TradingView platform, leveraging the power of Exponential Moving Averages (EMAs) determined by Fibonacci sequence lengths to provide traders with dynamic market insights. This indicator overlays directly on the price chart, offering a unique blend of trend analysis, smoothing techniques, and timeframe adaptability, making it an invaluable tool for traders looking to enhance their technical analysis strategy.
Key Features
1. Fibonacci-Based EMA Lengths: Utilizes the Fibonacci sequence to select EMA lengths, incorporating natural mathematical ratios believed to be significant in financial markets. The available lengths range from 1 to 987, allowing for detailed trend analysis over various periods.
2. Multiple Smoothing Methods: Offers the choice between several smoothing techniques, including Simple Moving Average (SMA), Exponential Moving Average (EMA), Smoothed Moving Average (SMMA or RMA), Weighted Moving Average (WMA), and Volume Weighted Moving Average (VWMA). This versatility ensures that users can tailor the indicator to suit their analytical preferences.
3. Timeframe Adaptability: Features the ability to fetch and calculate EMAs from different timeframes, providing a multi-timeframe analysis within a single chart view. This adaptability gives traders a broader perspective on market trends, enabling more informed decision-making.
4. Dynamic Visualization Options: Traders can customize the display to suit their analysis needs, including toggling the visibility of Fibonacci EMA lines, EMA prices, and smoothed EMA lines. Additionally, forecast lines can be projected into the future, offering speculative insights based on current trends.
5. Ema Tail Visualization: An innovative feature allowing for the visualization of the 'tail' or the continuation of EMA lines, which can be particularly useful for identifying trend persistence or reversal points.
6. User-friendly Customization: Through a series of input options, traders can easily adjust the source data, Fibonacci lengths, smoothing method, and visual aspects such as line colors and transparency, ensuring a seamless integration into any trading strategy.
Application and Use Cases
The "Fibonacci Adaptive Timeframe EMA" indicator is designed for traders who appreciate the significance of Fibonacci numbers in market analysis and seek a flexible tool to analyze trends across different timeframes. Whether it's for scalping, day trading, or long-term investing, this indicator can provide valuable insights into price dynamics, trend strengths, and potential reversal points. Its adaptability makes it suitable for various asset classes, including stocks, forex, commodities, and cryptocurrencies.
Fibonacci Timeframe Adaptive EMAThe "Fibonacci Timeframe Adaptive EMA" is a sophisticated trading indicator designed for the TradingView platform, leveraging the power of Exponential Moving Averages (EMAs) determined by Fibonacci sequence lengths to provide traders with dynamic market insights. This indicator overlays directly on the price chart, offering a unique blend of trend analysis, smoothing techniques, and timeframe adaptability, making it an invaluable tool for traders looking to enhance their technical analysis strategy.
Key Features
1. Fibonacci-Based EMA Lengths: Utilizes the Fibonacci sequence to select EMA lengths, incorporating natural mathematical ratios believed to be significant in financial markets. The available lengths range from 1 to 987, allowing for detailed trend analysis over various periods.
2. Multiple Smoothing Methods: Offers the choice between several smoothing techniques, including Simple Moving Average (SMA), Exponential Moving Average (EMA), Smoothed Moving Average (SMMA or RMA), Weighted Moving Average (WMA), and Volume Weighted Moving Average (VWMA). This versatility ensures that users can tailor the indicator to suit their analytical preferences.
3. Timeframe Adaptability: Features the ability to fetch and calculate EMAs from different timeframes, providing a multi-timeframe analysis within a single chart view. This adaptability gives traders a broader perspective on market trends, enabling more informed decision-making.
4. Dynamic Visualization Options: Traders can customize the display to suit their analysis needs, including toggling the visibility of Fibonacci EMA lines, EMA prices, and smoothed EMA lines. Additionally, forecast lines can be projected into the future, offering speculative insights based on current trends.
5. Ema Tail Visualization: An innovative feature allowing for the visualization of the 'tail' or the continuation of EMA lines, which can be particularly useful for identifying trend persistence or reversal points.
6. User-friendly Customization: Through a series of input options, traders can easily adjust the source data, Fibonacci lengths, smoothing method, and visual aspects such as line colors and transparency, ensuring a seamless integration into any trading strategy.
Application and Use Cases
The "Fibonacci Timeframe Adaptive EMA" indicator is designed for traders who appreciate the significance of Fibonacci numbers in market analysis and seek a flexible tool to analyze trends across different timeframes. Whether it's for scalping, day trading, or long-term investing, this indicator can provide valuable insights into price dynamics, trend strengths, and potential reversal points. Its adaptability makes it suitable for various asset classes, including stocks, forex, commodities, and cryptocurrencies.

[KVA] Custom Sessions Custom Sessions: Multi-Timeframe Analysis & Key Level Insights
Introduction:
Introducing " Custom Sessions," an innovative Pine Script indicator meticulously crafted to empower traders by offering an advanced level of analysis on various global trading sessions. This tool is designed not just to highlight trading sessions but to delve deeper into the nuances of market movements by analyzing candlestick behavior within those sessions, offering a nuanced view of market trends, liquidity, and potential turning points.
Core Features :
Session Customization : Tailor trading sessions to align with your strategy, focusing on the markets that matter most to you. Whether it's London, New York, Tokyo, Sydney, or Frankfurt, you have the control.
Enhanced Market Insight : Beyond session timing, gain a refined understanding of market dynamics through detailed candlestick analysis within each session, providing a granular view of price action.
Comprehensive Analysis Tools : Alongside session analysis, the indicator includes features like VWAP (Volume Weighted Average Price) and Fibonacci retracement levels, offering a multifaceted approach to market analysis across chosen timeframes.
VWAP : Gain insights into the market's trend and liquidity by viewing the Volume Weighted Average Price calculated for the custom timeframe.
Fibonacci Retracement Levels : Easily identify potential reversal points with automatically plotted Fibonacci levels at 0.236, 0.382, 0.5, 0.618, and 0.782for each candle
Real-Time Updates : As the market moves, so does " Custom Sessions," offering real-time insights that adapt to the unfolding market conditions.
Utilization Guide :
Configure Your Sessions : Begin by setting up the sessions that are most relevant to your trading approach, customizing their times as needed.
Select the Desired Timeframe : Input your preferred higher timeframe to analyze data that is most relevant to your trading strategy.
Dive into the Details : Use the detailed candlestick analysis within sessions to pinpoint potential entry and exit points, supported by VWAP and Fibonacci levels for deeper market insight.
Customize Your View : Adjust the visual aspects of the indicator, including session color coding and which elements to display, tailoring the tool to your preferences.
Acknowledgements :
A special thanks to Aurocks_AIF for their foundational work on "Sessions on Chart" . This project has been an invaluable resource, inspiring the development of " Custom Sessions" and pushing the boundaries of traditional session analysis.
Final Thoughts :
" Custom Sessions" is more than just an indicator; it's a comprehensive analysis tool that brings a new depth to the understanding of market sessions. By offering detailed insights into the behavior of candles within these sessions, along with essential analysis features, this indicator is a must-have for traders seeking to enhance their technical analysis arsenal.
Whether you're a day trader looking to capture short-term movements or a long-term investor seeking broader market insights, this indicator offers valuable data visualization to enhance your trading decisions. By integrating highs, lows, VWAP, and Fibonacci levels into your analysis, you gain a comprehensive view of market behavior across different timeframes and sessions

FibonacciAveragesOscillatorLibraryLibrary "FibonacciAveragesOscillatorLibrary"
The FibonacciAveragesOscillator library provides a streamlined way to analyze market trends using Fibonacci intervals and smoothed averages.
fibAvgOscillator(maxFibNumber, smoothLevel)
Parameters:
maxFibNumber (string) : string: The maximum Fibonacci number to use, affecting analysis depth.
smoothLevel (simple int) : simple int: Smoothing level for the oscillator, higher values produce smoother results.
@return series float: The Fibonacci averages trend oscillator value, smoothed over the specified level.

Auto Fibonacci Supports [ProjeAdam]OVERVIEW
The Auto Fibonacci Supports indicator is designed for financial market analysis, particularly in identifying key support levels.
USER GUIDE:
The Auto Fibonacci Supports indicator is designed to identify key support levels based on the Fibonacci retracement theory. These levels are significant in technical analysis as potential areas where price movement can stall or reverse.
Customization
Users can activate or deactivate each support level and customize their color, enhancing the visual distinction on the chart
Setting Support Levels: The indicator allows users to set four distinct Fibonacci support levels.
These levels are defined as percentages and can be input using the input.float function. For example, the default values are set at 0.5, 0.618, 0.705, and 0.786 for the first, second, third, and fourth support levels, respectively.
Users can adjust these percentages according to their trading strategies.
Using Support Levels: These support levels are calculated based on the highest and lowest price values over a defined period (fib_support_length). The script calculates each support level by applying the Fibonacci ratio to the range between the highest and lowest prices.
The support levels are then plotted on the trading chart, offering a visual representation of potential support points where the price might experience resistance or reversal.
VİSUALİZATİON
Using pick signal Levels: The "pick signal level" feature in the Auto Fibonacci Supports indicator is designed to help traders identify specific price points where a trading signal might be generated.
This feature likely enables traders to choose a particular Fibonacci support level at which they might consider executing a trade.
By selecting a specific level, traders can focus on significant price points that align with their trading strategy, such as looking for potential buy or sell signals when the price of an asset reaches these key Fibonacci levels.
This helps in refining trading decisions and focusing on critical price movements.
LANGUAGE
The purpose of the "lang setting" is to provide language customization for the user interface.
This setting allows users to select their preferred language for the display of text and labels within the indicator.
Such a feature is particularly useful in making the tool accessible to a wider range of users from different linguistic backgrounds, enhancing user experience and understanding of the indicator's functionalities.
By offering multiple language options, the indicator becomes more versatile and user-friendly for traders around the globe.
Opportunity to examine different parities on the same chart
The script includes a section for setting up various pairs (like BTCUSDT, ETHUSDT, etc.) that users can select or deselect for analysis.
This feature enables traders to apply the Fibonacci support levels across multiple markets, allowing for comparative analysis and broader market insight.
By analyzing different pairs, traders can identify opportunities and patterns across various assets, enhancing their trading strategies.
This multipair functionality is particularly useful in diversified trading approaches.
ALGORITHM
In the "Auto Fibonacci Supports" indicator, calculating the high and low values is a crucial step.
This process involves identifying the highest and lowest price points of a financial instrument within a specific time frame, determined by the fib_support_length parameter.
The indicator scans historical data over this period to find these extreme values.
These high and low points serve as the reference for calculating the Fibonacci support levels, as they represent the full range of price movement in the selected time frame.
The accuracy and relevance of the support levels depend significantly on the correct identification of these high and low values.
Example
In this example, we can see the parities that fell below the first support level in the table, so we have the opportunity to quickly evaluate these parities.
Benefits
This indicator automates the process of identifying Fibonacci support levels, which can be a time-consuming task if done manually.
It offers traders customizable settings to adapt to different trading strategies and assets.
The visual representation on charts can help in making quicker and more informed trading decisions based on Fibonacci retracement levels.
If you have any ideas what to add to my work to add more sources or make calculations cooler, suggest in DM .

Fibonacci Averages Trend OscillatorOverview:
The Fibonacci Averages Trend Oscillator is a unique technical indicator that leverages Fibonacci numbers to analyze market trends. It calculates the average trend sentiment over periods determined by Fibonacci numbers and smooths the result to create an oscillator.
Key Features:
Uses Fibonacci sequences for trend analysis.
Smooths the trend data to create a clear oscillator.
Offers adjustable oversold and overbought levels for customized analysis.
Inputs:
Max Fib Number: Select the highest Fibonacci number for trend calculation.
Smooth: Adjust the smoothness of the oscillator line.
Using the Oscillator:
A rising oscillator indicates a bullish trend, while a falling oscillator suggests bearish sentiment.
Oversold and overbought levels help identify potential reversal points.
Use the oscillator in conjunction with other indicators for comprehensive market analysis.
Tips for Effective Use:
Adjusting Fibonacci Levels: Experiment with different 'Max Fib Number' settings to find the one that best matches your trading style and the asset's characteristics. Higher Fibonacci numbers consider longer periods, which might be more suitable for long-term trend analysis.
Smoothing Level: The 'Smooth' input helps in reducing noise. A higher smooth level results in a less responsive but smoother line, which can be useful for identifying the overall trend direction.
Interpreting Overbought/Oversold: Watch for the oscillator reaching overbought or oversold levels. These points could signal potential trend reversals or consolidation phases.
Combination with Other Tools: For best results, combine the Fibonacci Averages Trend Oscillator with other technical tools like moving averages, RSI, or MACD to validate the signals and develop a robust trading strategy.
Conclusion:
The Fibonacci Averages Trend Oscillator offers a unique approach to trend analysis by incorporating Fibonacci numbers into its calculation. Its adjustable settings allow for customization to fit various trading styles and market conditions, making it a versatile tool for traders seeking to enhance their technical analysis capabilities.

Intraday Fibonacci Levels [Gorb]Welcome to the Intraday Fibonacci Levels indicator, a dynamic and customizable tool designed for traders who incorporate Fibonacci retracements and extensions into their technical analysis. This indicator focuses on intraday price action, allowing you to select a specific candle from any trading session and visualize crucial Fibonacci levels derived from its high and low prices.
Features:
Candle Selection for Fibonacci Analysis: Select any candle based on its time to plot Fibonacci levels, giving you control over the period of analysis.
Customizable .236 and .618 Fibonacci Levels: Plot and customize the .236 and .618 Fibonacci retracement and extension levels. Adjust color and line style for each level to fit your chart preferences.
User-Friendly Interface: Easy-to-use input fields for selecting the candle time and configuring Fibonacci settings. Intuitive toggle options to display or hide specific Fibonacci levels.
Dynamic Updating: The indicator updates in real-time as new price data is received, ensuring you have the latest Fibonacci levels on your chart.
Usage Case:
This indicator is ideal for day traders and technical analysts who utilize Fibonacci tools to identify potential support and resistance levels, trend reversals, or continuation patterns. Whether you are analyzing a high-impact news event candle or a significant pivot point in the trading day, this indicator helps bring clarity to your Fibonacci-based trading strategy.
Guidelines for Usage:
Use the indicator settings to select the candle time and configure your desired Fibonacci levels. You can choose any time you want, in order to use premarket candles you need to enable electronic hours on your chart to have levels plot from pre/post.
These auto plotted levels can act as pivot points or points of support and resistance for traders to make informed trading decisions near these levels. Analyze the plotted Fibonacci levels in conjunction with other technical indicators or price action patterns for informed trading decisions.
Conclusion:
This indicator is a versatile and essential tool for traders who rely on Fibonacci analysis as part of their trading arsenal. By offering the flexibility to analyze specific candles and customize Fibonacci levels, this indicator empowers you to make more informed trading decisions. Its user-friendly design and real-time updating capabilities ensure that you have access to accurate and relevant Fibonacci data at any moment of the trading day.
RISK DISCLAIMER
All content, tools, scripts & education provided by Monstanzer or Gorb Algo are for informational & educational purposes only. Trading is risk and most lose their money, past performance does not guarantee future results.

Fibonacci Timing Pattern IIThe Fibonacci Timing Pattern II is a price-based counter that seeks to determine medium-term reversals in price action. It is based on the following set of conditions:
* For a bullish Fibonacci timing signal II: The current close must be lower than the close prices from one and two periods ago. Simultaneously, the close price from two periods ago must be lower than the close price from three periods ago, and the close price from three periods ago must be lower than the close price from five periods ago. The Fibonacci sequence continues until the close price from thirty four periods ago which must be above the close price from fifty five periods ago.
* For a bearish Fibonacci timing signal II: The current close must be higher than the close prices from one and two periods ago. Simultaneously, the close price from two periods ago must be higher than the close price from three periods ago, and the close price from three periods ago must be higher than the close price from five periods ago. The Fibonacci sequence continues until the close price from thirty four periods ago which must be lower the close price from fifty five periods ago.
The signals of the pattern are ideally used in a sideways market or used in tandem with the trend (bullish signals are taken in a bullish market and bearish signals are taken in a bearish market).

Auto Fibonacci Retracement // Atilla YurtsevenOverview:
This Pine Script™ is a specialized tool for traders, designed to automatically plot Fibonacci retracement levels over a user-defined date range in trading charts. It also indicates the extent of price retracement within these levels.
Key Features:
Date Range Customization: Users can specify the start and end dates to focus the analysis on a particular trading period.
Dynamic Fibonacci Levels: The script includes various Fibonacci ratios (0.0, 0.236, 0.382, 0.5, 0.618, 0.786, 1.0), with the flexibility to enable or disable individual levels.
Visual Customization: Each Fibonacci level can be customized for color and line style (solid, dotted, dashed). Labels for each level are also configurable.
Retracement Measurement: The script not only draws the Fibonacci levels but also measures and displays how much the price has retraced within these levels.
Extension and Additional Options: Users have options to extend the Fibonacci lines and additional features such as using close values, trend drawing, date range display, and more.
Technical Insights:
The script identifies high and low values within the selected time frame, assessing the market's trend direction.
Within the specified date range, this script effortlessly plots the Fibonacci levels automatically, bringing clarity and precision to your market analysis as it unfolds.
The tool's adaptability makes it suitable for various trading styles and chart preferences.
Intended Use:
This script is particularly valuable for technical analysts and traders who use Fibonacci retracements to identify potential support and resistance areas and understand the depth of market corrections or rallies.
Disclaimer:
This Pine Script™ is offered 'as is', without any guarantees or warranties. It is intended for informational purposes and should not be taken as investment advice. Atilla Yurtseven, the creator of this script, assumes no responsibility for any financial losses or gains that may result from its usage. Users should perform their own due diligence and consult with professional advisors before making any investment decisions.
Remember to follow and comment!
Trade smart, stay safe
Atilla Yurtseven

Rainbow Fibonacci Momentum - SuperTrend🌈 "Rainbow Fibonacci Momentum - SuperTrend" Indicator 🌈
IMPORTANT: as this is a complex and elaborate TREND ANALYSIS on the graph, ALL INDICATORS REPAINT.
Experience the brilliance of "Rainbow Fibonacci Momentum - SuperTrend" for your technical analysis on TradingView! This versatile indicator allows you to visualize various types of Moving Averages, including Simple Moving Averages (SMA), Exponential Moving Averages (EMA), Weighted Moving Averages (WMA), Hull Moving Averages (HMA), and Volume Weighted Moving Averages (VWMA).
Each MA displayed in a unique color to create a stunning rainbow effect. This makes it easier for you to identify trends and potential trading opportunities.
Key Features:
📊 Multiple Moving Average Types - Choose from a range of moving average types to suit your analysis.
🎨 Stunning Color Gradient - Each moving average type is displayed in a unique color, creating a beautiful rainbow effect.
📉 Overlay Compatible - Use it as an overlay on your price chart for clear trend insights.
With the "Rainbow Fibonacci Momentum - SuperTrend" indicator, you'll add a burst of color to your trading routine and gain a deeper understanding of market trends.
HOW IT WORKS
MA Lines:
MA - 5: purple lines
MA - 8: blue lines
MA - 13: green lines
MA - 21: yellow lines
MA - 34: orange lines
MA - 55: red line
Header Color Indicators:
Purple: MA-5 is in uptrend on the chart
Blue: MA-5 and MA-8 are in the uptrend on the chart
Green: MA-5, MA-8 and MA-13 are in the uptrend on the chart
Yellow: MA-5, MA-8, MA-13 and MA-21 are in the uptrend on the chart
Orange: MA-5, MA-8, MA-13, MA-21 and MA-34 are in the uptrend on the chart
Red: MA-5, MA-8, MA-13, MA-21, MA-34 and MA-55 are in the uptrend on the chart
Red + White Arrow: All MAs are correctly aligned in the uptrend on the chart
Footer Color Indicators:
Purple: MA-5 is in downtrend on the chart
Blue: MA-5 and MA-8 are in the downtrend on the chart
Green: MA-5, MA-8 and MA-13 are in the downtrend on the chart
Yellow: MA-5, MA-8, MA-13 and MA-21 are in the downtrend on the chart
Orange: MA-5, MA-8, MA-13, MA-21 and MA-34 are in the downtrend on the chart
Red: MA-5, MA-8, MA-13, MA-21, MA-34 and MA-55 are in the downtrend on the chart
Red + White Arrow: All MAs are correctly aligned in the downtrend on the chart
Background Colors:
Light Red: All MAs are on the rise!
Red: All MAs are align correctly on the rise!
Light Green: All MAs are in freefall!
Green: All MAs are align correctly in freefall!
Tiny Arrows Indicators/Alerts:
Down Arrow: All MAs are in freefall!
Up Arrow: All MAs are on the rise!
Big Arrows Indicators/Alerts:
Down Arrow: All MAs are align correctly in freefall!
Up Arrow: All MAs are align correctly on the rise!

Golden Level Predictions v1.0Golden Level Predictions (GLP) Trading Indicator
This script introduces a custom trading indicator named "GLP" tailored for the TradingView platform. It offers various price levels derived from Fibonacci calculations and other mathematical models, assisting traders in pinpointing potential overpriced and discounted price levels.
Key Features:
User Inputs : Users have the flexibility to select their desired timeframe, with options ranging from Weekly, Daily, Monthly, and more. Additionally, they can opt to showcase Fibonacci lines and the associated prices within these levels.
Price Level Calculations :
- Employs constants such as the Golden Ratio (PHI) and Pi (PI) to extract various multipliers and factors.
- Assesses if the current asset is a cryptocurrency and tweaks calculations accordingly.
- Determines overpriced and discounted price levels, drawing from the current open price and past data.
Fibonacci Levels :
- For each overpriced and discounted level, the script computes intermediary Fibonacci levels, including 23.6%, 38.2%, 50%, 61.8%, and 78.6% (the 3rd level is excluded due to plot limitations).
- These levels are illustrated on the chart, granting traders a more detailed view of price targets.
Visual Elements :
- Projects horizontal lines to the subsequent selected indicator interval for every calculated price level.
- Exhibits potential percentage gains or losses at each tier, indicating the prospective price alteration upon reaching that level.
- Differentiates overpriced (green) and discounted (red) levels using color codes. A neutral price is depicted in yellow.
Anticipated Close Calculation : Offers a projected closing price for the current timeframe, based on a myriad of factors.
This indicator is particularly effective with cryptocurrencies due to their inherent volatility. It's also compatible with stocks and is most efficient with tickers that provide volume data.
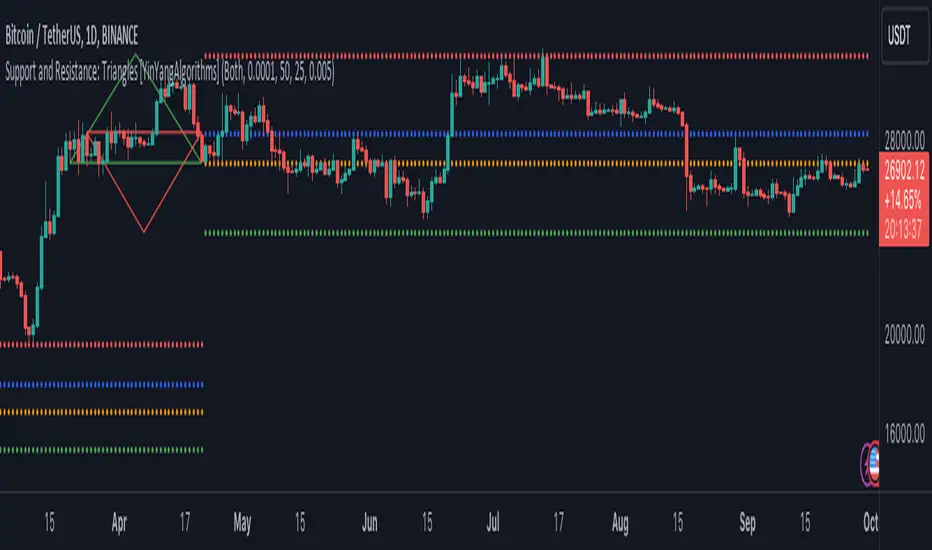
Support and Resistance: Triangles [YinYangAlgorithms]Overview:
Triangles have always been known to be the strongest shape. Well, why wouldn’t that likewise apply to trading? This Indicator will create Upwards and Downwards Triangles which in turn create Support and Resistance locations. For example, we find 2 highs that meet the criteria (within deviation %, Minimum Distance and Lookback Distance). We calculate the distance between these two and create an Equilateral Triangle Downwards (You can adjust the % if you want more of an Isosceles Triangle). The midpoint (tip) of this triangle is the Support and the bottom (base) of it is the Resistance. The exact opposite applies for an Upwards Triangle.
The reason why Triangles may make for good Support and Resistance locations is the % 's used, much like the fibonacci, use ratios relevant in nature and everywhere in the world around us, so why not for trading too?
Tutorial:
If you look at the locations we’ve circled above, all of them exhibit strong rejections are predictive Support and Resistance locations plotted by the triangles created. There can only ever be 1 Upward and 1 Downward Triangle at a time, so when a new one is created, the Support and Resistance locations are moved.
If you scroll back far enough you’ll notice the Triangles disappear but their Support and Resistance locations are still plotted. This has to do with the fact you are allowed only so many Lines plotted and when a new Triangle is created, an old one will be removed. The Support and Resistance locations however will stay.
If we look at the example above, you can see the Support and Resistance locations the Triangles made here may have helped predict where the price would struggle to surpass.
By default the Look Back Distance is set to 50 and the Min Distance is 10 (settings used in all previous examples). However, you can modify these to make Triangles more ‘Rare’ and therefore the Support and Resistance locations change less. In the example above for Instance we left Look Back Distance to 50 but changed Min Distance from 10 to 25. This results in Support and Resistance locations that may hold better in the long term.
If we scroll back a bit, we can see the settings ‘Look Back Distance’ 50 and ‘Minimum Distance’ 25 had done a decent job at predicting the ATH resistance and many Support and Resistance locations around it. Keep in mind, previous results don’t mean future results, but Triangles may create ratios which apply well to trading.
We will conclude our Tutorial here. Hopefully you can see the benefit to the ratio Triangles make when predicting Support and Resistance locations.
Settings:
Show Triangles: If all you want to know is the Support and Resistance locations, there’s no need to draw the Triangles.
Triangle Zones: What types of triangles should we create our zones for? Options are Upward, Downward, Both, None.
Max Deviation Allowed: Maximum Deviation up or down from the last bars High/Low for potential to create a Triangle.
Lookback Distance: How far back we look to see for potential of a High/Low within Deviation range.
Min Distance: This is so triangles are spaced properly and not from 2 bars beside each other. Min distance allocated between 2 points to create a Triangle.
Bar Percent Increase: How much % multiplier do we apply for each bar spacing of the triangle. 0.005 creates a close to Equilateral Triangle, but other values like 0.004 and 0.006 seem to work well too.
If you have any questions, comments, ideas or concerns please don't hesitate to contact us.
HAPPY TRADING!
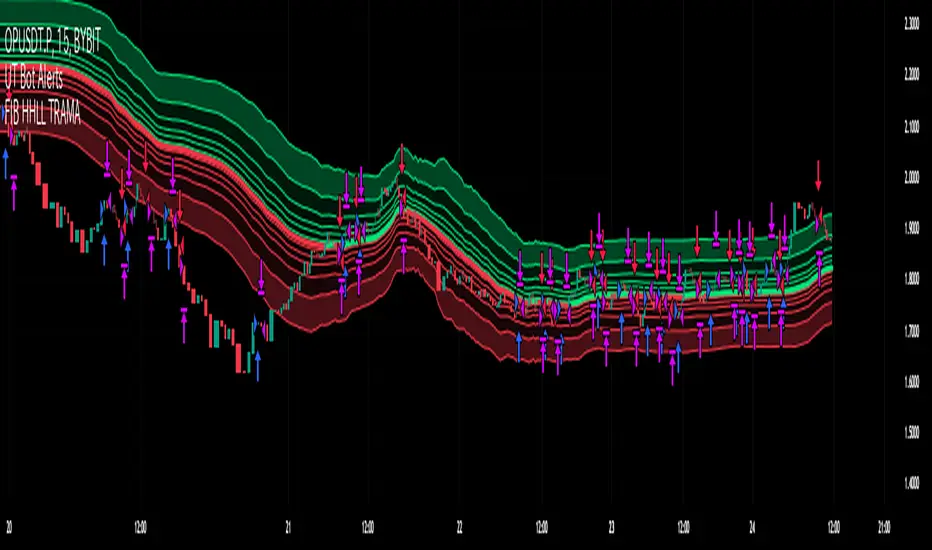
Fibonacci HH LL TRAMA BandLuxAlgo's Trend Moving Adaptive Moving Average was used as a reference to create bands by reading the highest and lowest prices of past bars based on Fibonacci numbers and then multiplying them by the Fibonacci ratio.
LuxAlgo/ LuxAlgo/
In particular, the so-called TRAMA is characterized by its adaptation to the average of the highest and lowest prices over a specific period of time and is used to identify support/resistance.
In order to apply this feature to the maximum extent possible, I used the high or low prices as the source of input, rather than the closing price.
For example,
src = high
not original like
src = close
In addition, I created 6 levels by multiplying the Fibonacci ratio
//Midline
mah = ama1
mal = ama2
m = (mah + mal)/2
//Half Mean Range
dist = (mah - mal)/2
//Levels
h6 = m + dist * 11.089
h5 = m + dist * 6.857
h4 = m + dist * 4.235
h3 = m + dist * 2.618
h2 = m + dist * 1.618
h1 = m + dist * 0.618
l1 = m - dist * 0.618
l2 = m - dist * 1.618
l3 = m - dist * 2.618
l4 = m - dist * 4.235
l5 = m - dist * 6.857
l6 = m - dist * 11.089
If you want to use it for scalping, such as 15 minutes, you can include Fibonacci numbers such as 21,34,55 for a quick reaction type to detect the trend. Also, by including Fibonacci numbers such as 89,144,233, you can see where you stand in the larger trend. Some examples are included below.
For Investors
BTCUSDT 1day Chart Fibonacci number "55"
For Daytraders
BTCUSDT 4hour Chart Fibonacci number "34"
For Scalpers
BTCUSDT 15min Chart Fibonacci number "55"
BTCUSDT 15min Chart Fibonacci number "89"
BTCUSDT 15min Chart Fibonacci number "233"
Fibonacci numbers are 1, 1, 2, 3, 5, 8, 13, 21, 34, 55, 89, 144, 233, 377, 610, etc.,
Fibonacci ratios are 0.618, 1.618, 2.618, 4.236, 6.854, 11.089, etc.,