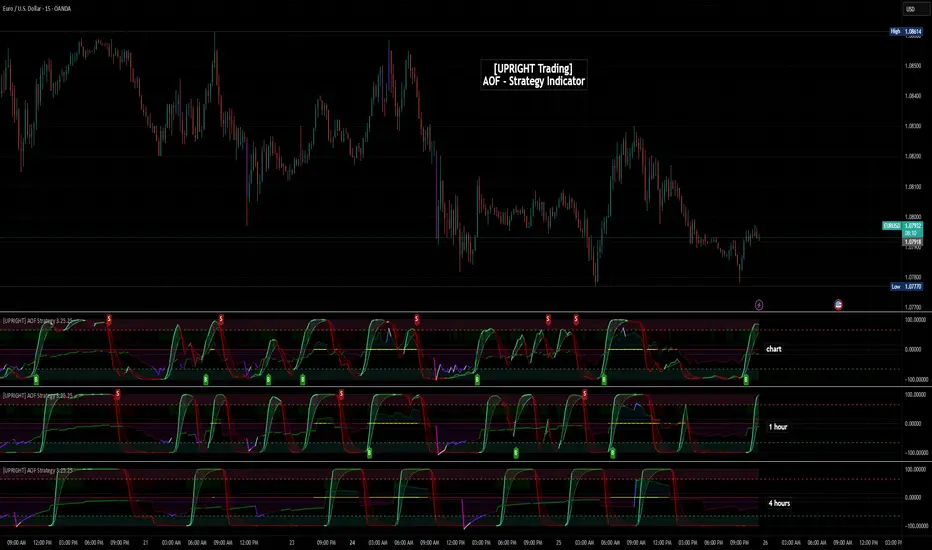
[UPRIGHT Trading] Academy of Forex - Scalp Strategy█ OVERVIEW
This is a collaboration of efforts of The Academy of Forex and UPRIGHT Trading .
The Academy of Forex - Scalp Strategy Indicator is a clean & reimagined lower indicator. To enable optimization & potential automation, we re-coded & optimized it at UPRIGHT Trading.
It is based on the one presented on its YT channel.
The idea is for it to be an easy to use - simple indicator - that works not just for confirmation, but also entering and exiting quickly (scalping).
█ CONCEPTS
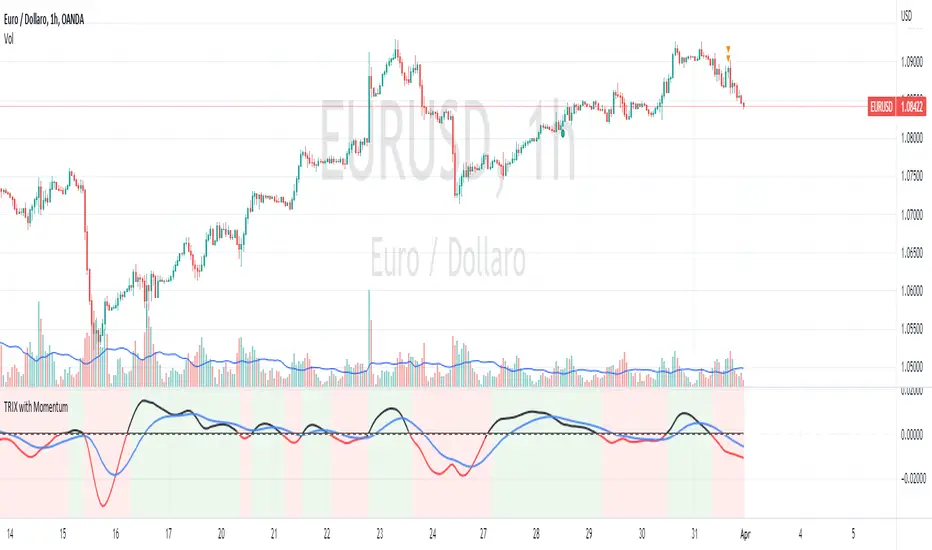
The idea is that %B (derived from BBs) is able to pick up some pretty significant moves. With that as one of the bases the Inverse Fisher Transform (Ribbon) acts to show some of the movement of the asset highlighting when it at extremes. The RSI highlights are there as another confirmation to help normalize the sometimes too frequent movement of %B.
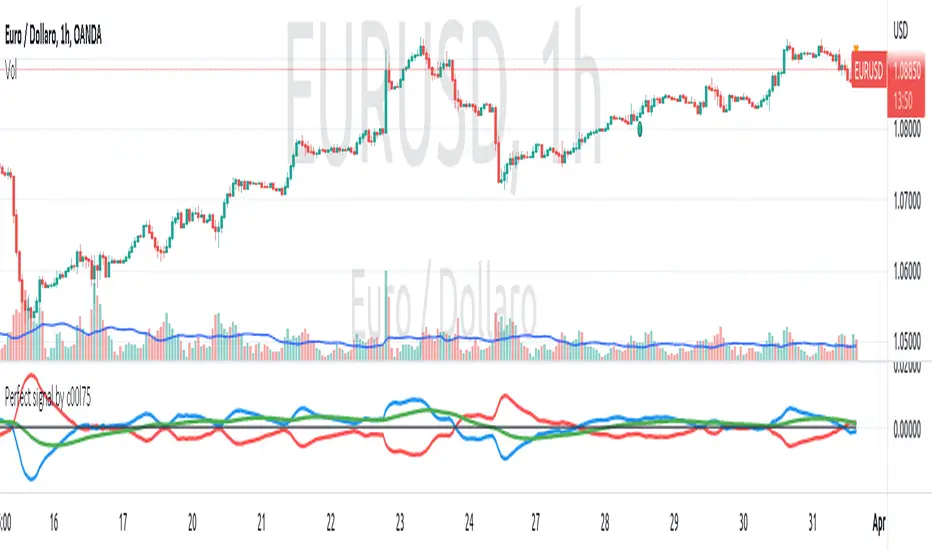
As expected the indicator often acts as a reversal indicator, but with the optimizations of logic it's able to pick up more than just the reversals and works as a pretty decent Buy/Sell Algorithm.
█ CALCULATIONS
Calculations used included, but not limited to:
- %B - Quantifies the price as a percentage to the Upper and Lower Band of the Popular Bollinger Bands, which were named after their inventor John Bollinger in 1980.
- Inverse Fisher Transform RSI - is a variation of the IFT, created by John Ehlers, the idea is for the IFT to convert Gaussian normal distribution and to take it a step further the RSI version is to just use overbought and oversold placements. This indicator is meant to highlight when price has moved to an extreme and in this process helps to spot turning points.
- Relative Strength Index (RSI) - As most of you know already the RSI is a technical analysis tool invented by J. Welles Wilder, that oscillates and is used to measure the momentum of price changes. It normalizes to index 0-100 with overbought and oversold defined by the user, but often around 70 as overbought and 30 as oversold.
- Pivot/Swing Points - Implemented to show recent Higher-Highs or Lower-Lows, Pivot points are included in the indicator for structure tracking.
- Moving Averages - Moving averages help to get an idea of when price is moving near the norm or outside to extremes.
█ FEATURES
Indicator Features:
-2 Buy/Sell Signals.
-U Signals (UPRIGHT optimized).
-Exit Reminders.
-Alerts allowing Automation of Scalp Strategy.
-H/L Swings.
-Color Customization.
-Clean Mode.
-Inverse Fisher Transform Ribbon.
-RSI Bullish/Bearish Highlights.
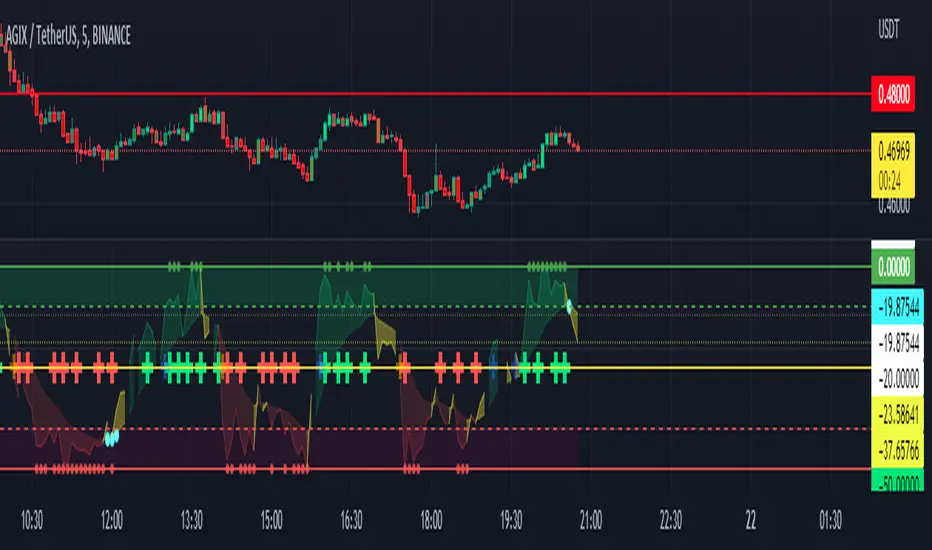
-Options for More Signals (including: Oversold/Overbought Circles, %B Bull/Bear Squares and Triangles, and IFT Highlights).
Showing some of the signals close up.
Should look like this:
Enjoy!
Sincerely,
Mike
Pine Script® indicator