PpSignal ADX Moving Average The ADX indicator uses a smoothing moving average in its calculation and we find out that the best ADX indicator settings to use is 14 periods. ... The ADX indicator can only help us to gauge the intensity of the trend so we need to RSI or Ewo indicator for entry signals.
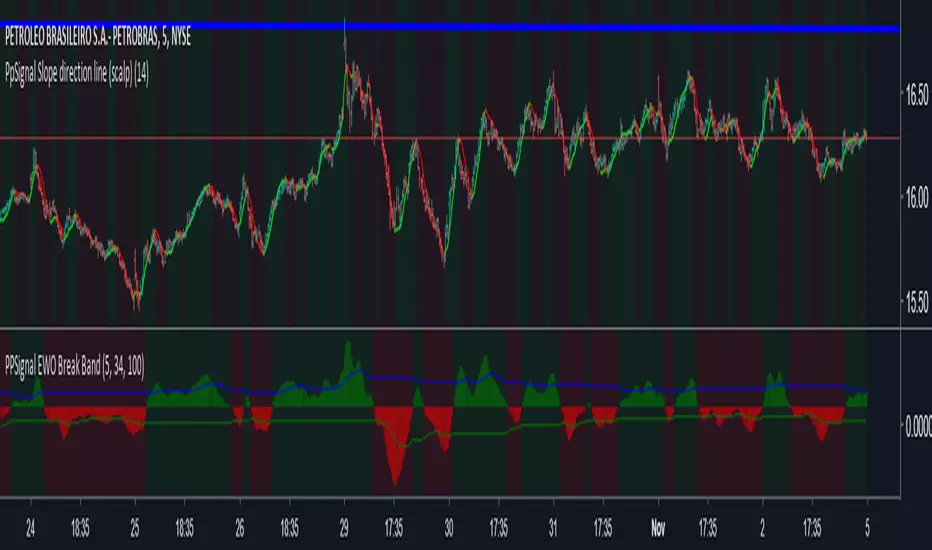
Gray color is hold, lime buy and orange sell.
Pine Script® indicator