Complete MA DivisionThis indicator simply divides two moving averages and calculates the slope of the resulting curve to show when an asset's momentum is slowing down. The original idea was in a recent youtube video by Ben Cowen . His indicator didn't show the complete history of the moving average, so I wanted to try a little trick to get the moving averages at the beginning of time even when using a large moving average period. I accomplished this by counting the number off current bars using the cum() function. After the count is hit, the period will be constant.
Changing the curve smoothing will smooth the actual curve. Both moving average periods should be divisible by the curve smoothing.
Changing the slope smoothness will dictate when the slope is starting to slow down. Keep this high to break through the noise.
Start of Red = Good time to sell
Start of Green = Good time to buy
There is a weird issue with the smoothness of the line so just keep your moving averages divisible by the curve smoothing. I couldn't figure that issue out yet.
FULL

Full strategy AllinOne with risk management MACD RSI PSAR ATR MAHey, I am glad to present you one of the strategies where I put a lot of time in it.
This strategy can be adapted to all type of timecharts like scalping, daytrading or swing.
The context is the next one :
First we have the ATR to calculate our TP/SL points. At the same time we have another rule once we enter(we enter based on % risk from total equity, in this example 1%, at the same time, lowest ammount for this example is 0.1 lots, but can be modified to 0.01), so we can exit both by tp/sl points, or by losing 1% of our equity or winning 1% of our total equity. It's dinamic.
The strategy is made from
Trend direction :
PSAR
First confirmation point :
Crossover between 10EMA and Bollinger bands middle point
Second confirmation
MACD histogram
Third confirmation
RSI overbought/oversold levels
For entries : we check trend with psar, then once ema cross bb middle point, we confirm together with rsi level for overbought/oversold and macd histogram ( > 0 or <0).
We exit, when we have opposite sign, like from buy to sell or sell to buy, or when we reach tp/sl points, or when we reach % basaed equity points.
It can be changed to be fixed lots, or fixed tp/sl , you just have to uncomment the size from entries, and tp/sl lines.
At the same time, it has the possibility if one desires, to trade only concrete forex session like european, asian and so on for intraday trading.
Hope you enjoy it.
Let me know how it goes.

multiple SMA EMA BB full mod + timeframeyou can add as much SMA EMA BB as you want by editting the source code
just remove the // from the indicator code

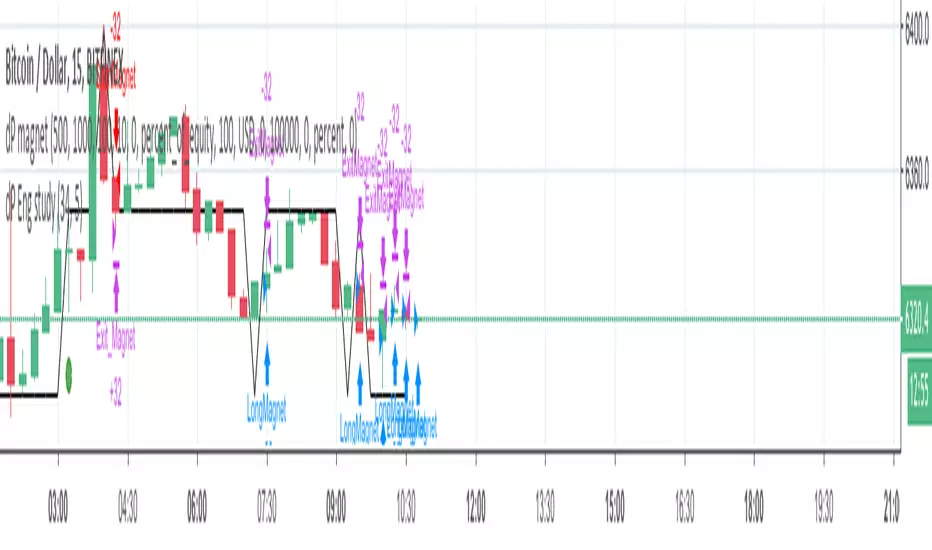
dP magnet//Strategy based on the idea that stop loss and take profit are often placed at full price levels or round numbers, whcih acts as resistance and supports levels
//Buy Rules:
//Actual price (close) is above round number.
//Round number level was not touched in previous ten bars (arbitrary value).
//Place a buy and follow the order with a trail step because price can bounce at round number (support) or can go through it.
//Sell Rules are the same of buy rules but inverted.
//
//Need improvement on conditions' logic and round numbers definitions
B3 Stochastic FullA colorful take on the classic stochastic indicator, coded from scratch. Enjoy! :)
