Ether (Ethereum) CME Gaps [NeoButane]Detects gaps in trading for CME's "Ether" cash-settled futures. This will show gaps as they happen on the 24/7 charts that crypto exchanges use. It is not usable on CME's tickers themselves, as gaps in trading are not displayed.
This indicator will only display if viewing an ETH chart.
More information on the CME ETH futures here:
www.cmegroup.com
Based on:
What's different: CME's BTC and ETH markets trade the same hours, but one may hit a limit breaker while there may be a case where the other does not.
Gaps

BITCOIN CME FUTURES GAPSDisplays information about Bitcoin CME Futures Gaps over BTCUSD (or XBTUSD) charts.
You can configure a threshold percentage to only display gaps whose size is greater than that percentage. The gap precentage is calculated based on the current close price.
Gaps up are displayed in Orange, gaps down in Green

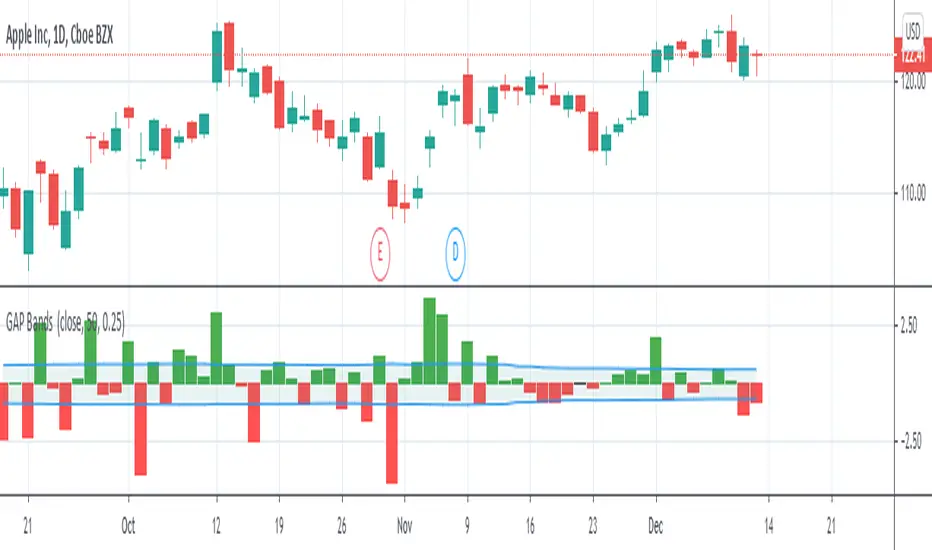
GAP Bands""
Introduction
Gap trading is a simple and disciplined approach to buying and shorting stocks. Essentially, one finds stocks that have a price gap from the previous close, then watches the first hour of trading to identify the trading range. Rising above that range signals a buy, while falling below it signals a short.
What is a Gap?
A gap is a change in price levels between the close and open of two consecutive days. Although most technical analysis manuals define the four types of gap patterns as Common, Breakaway, Continuation and Exhaustion, those labels are applied after the chart pattern is established. That is, the difference between any one type of gap from another is only distinguishable after the stock continues up or down in some fashion. Although those classifications are useful for a longer-term understanding of how a particular stock or sector reacts, they offer little guidance for trading.""" (Definition from StockCharts)
I plot gaps and add a band to them with volatility to make a decision about how important the current gap in terms of our price movement.
Daily GAP StatsI did not write the script from scratch but rather started editing code of an existing one. The original code came from a script called GAP DETECTOR by @Asch-
First up: I am a trader, not a programmer and therefore my code most likely is inefficient. If someone with more expertise would like to help and optimize it - feel free to get in touch, I am always happy to learn some new tricks. :)
This script does 2 things:
- It shows daily gaps stats based on user inputs
- It shows color coded labels on gap days with additional information in tooltips ( important: make sure to read 'known issues/limitations' at the end )
User Inputs
==========
Although the input dialog is pretty straight forward, I do a quick rundown:
- Length: max lookback time
- Gap Direction: self explanatory
- Show All Gaps | Cont Only | Reversal Only | Off:
This refers to the way labels are displayed on gap days (again: make sure to read known issues/limitations!)
- Show All Gaps: does what it says
- Cont Only: only shows gaps where price continued in the gap direction. If you filter for gap ups and chose 'Cont only' you will only see labels on gap days where price closed above the open (and vice versa if you scan for gap downs).
- Reversal Only: you will only see labels for closes below the open on gap up days (and the opposite on gap down days)
- Off: self explanatory
- Gap Measure in ATR/PCT: self explanatory, ATR is calculated over a 10d period
- Gap Size (Abs Values): no negative values allowed here. If you filter for gap downs and enter 3 it means it will show gaps where the stock fell more than 3 ATR/PCT on the open.
- RVOL Factor: along with significant gaps should come significant volume. RVOL = volume of the gap day / 20d average volume
- Viewing Options: Placing the stats label in the window is a bit tricky (see knonw issues/limitations) and I was not sure which way I liked better. See for yourself what works best for you.
Known Isusses/Limitations:
=======================
- Positioning of the stats table:
As to my knowledge, Tradingview only allows label positioning relative to price and not relative to the chart window. I tried to always display the gap stats table in the upper right corner, using 52wk high as y-coordinate. This works ok most of the time, but is not pretty. If anybody has some fancy way to tag the label in a fixed position, please get in touch.
- Max number of labels per script:
TradingView has a limitation that allows a maxium of ~50 labels per script. If there are more labels, TradingView will automatically cut the oldest ones, without any notification. I have found this behaviour to be rather inconsistent - sometimes it'll dump labels even if there are a lot fewer than 50. Hopefully TradingView will drop this limitation at one point in the future.
Important: The inconsistent display of the gap day labels has NO INFLUENCE on the calculations in the gap stats table - the count and the calculations are complete and correct!

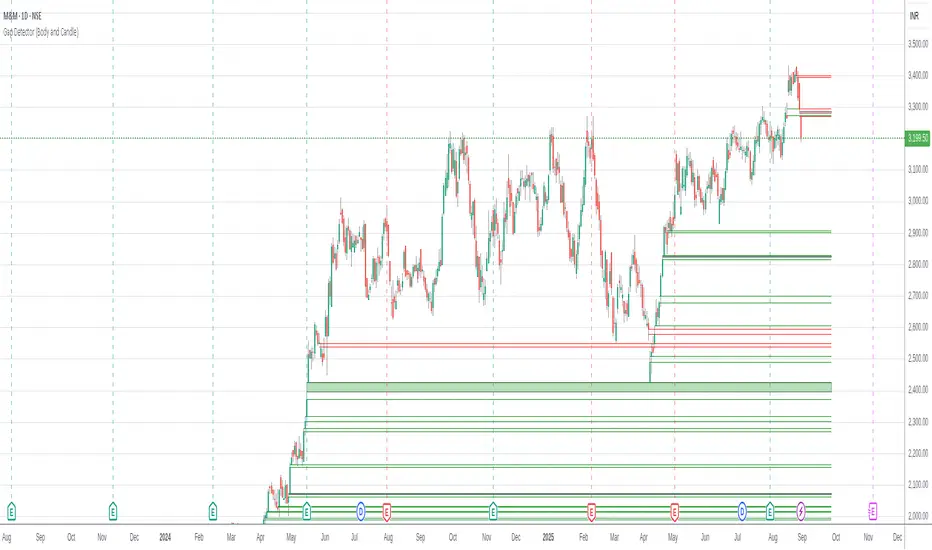
Body Gap Detector
This script was inherited from "GAP DETECTOR" by Asch- and the modified version is being published with consent of the author.
This script identifies gap up or gap down between candle bodies (for the selected time frame). The original script has been reworked to consider Open/Close instead of the High/Low. It identifies "Gap" up/down and indicates them with markers drawn from "Open/Close" of one candle to the "Close/Open" of another.
The default setting is to consider the last 1500 candles. "Gap Up" is indicated by Green bars and "Gap Down" is indicated with Red bars.
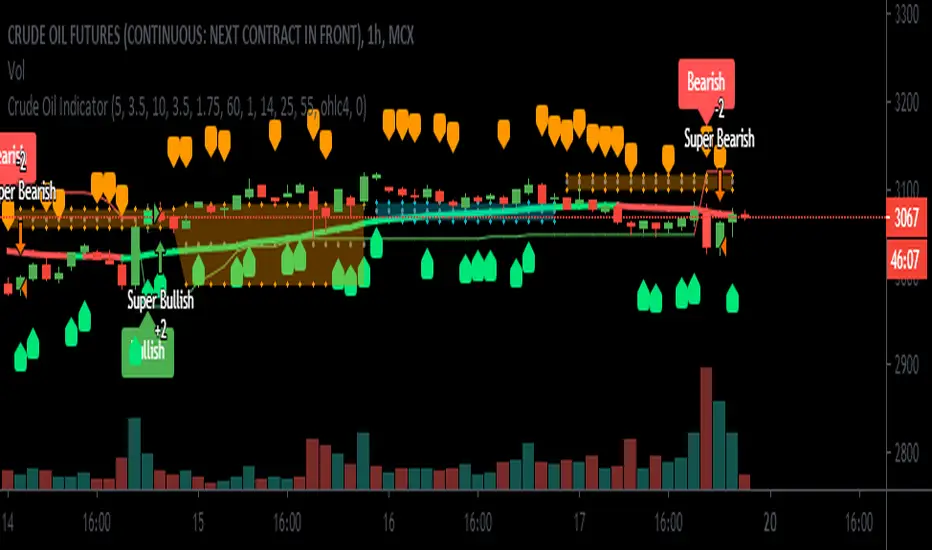
Crude Oil Indicator [SIDD]Crude Oil Indicator is giving two signal Bullish and Bearish . Bullish signal is used to take long trade and Bearish signal is used to close existing long trade and take new short trade and so on.
To get More signal of Bullish and Bearish user must enable More Signals check box that will check crossover and cross down of price close with Gaps.
I am using 2 ATR and one ADX and Gaps and VWMA to make signal profitable with 15 minutes 1 hr ,2hr,3hr,4hr chart time frame.
I have checked last few years data for back testing. Based on past performance it doesn't work well in 30 minute and 1 day chart time frame as results are not good in back testing. I have designed this indicator for Indian crude oil context though it can be used with other market as well.
1st ATR used to find trend with price crossover.
2nd ATR ADX is used to find the trend change details only. I have taken VWMA and ATR both to consider trend change.
Highlight Gap Up and Gap Down is used to know daily market opening gap up and gap down area. Gaps act as support and resistance .
VWMA Plotted as Blue line. Rising VWMA considered as uptrend and falling VWMA considered as downtrend.
Flat VWMA considered as no trend zone. In no trend zone every second third candles cross VWMA .
User must keep the default setting for getting better results as results are back tested. If setting changed then result may vary.
I have added here back tested performance user can see those results. I have added commission and slippage as well. Past year performance not guarantee for future years result so before taking any trade trader must take conscious decision.
This indicator is available on Subscription.
PM/ DM for more information about the script access.
Use the link below to obtain access to this indicator.
[AKM] Daily Opening Gap IndicatorThis indicator will mark yesterday daily closing price with today daily opening price.
Do not use this indicator with timeframe higher than Daily timeframe.
Gap up will be indicate with green color.
Gap down will be indicate with red color.
Send us private message on TV to gain access to the indicator.

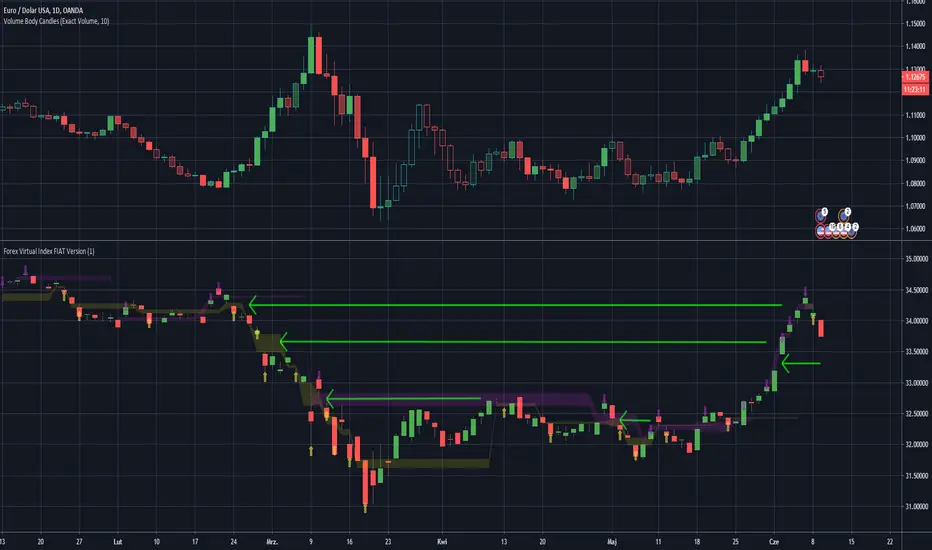
Forex Virtual Index FIAT VersionThis is virtually created FX Fiat pairs index based on OANDAs data.
Pairs are: EUR/USD , AUD/USD , GBP/USD , NZD/USD , AUD/JPY , EUR/JPY , GBP/JPY , USD/JPY , USD/CAD , USD/PLN
Be awared that some pairs like USD/CAD , have reversed correlation to the index.
You may look at the gaps as on standard S/R levels.
ps. Take look inside the scirpt's settings.
ps2. This script is invite-only for the members of our trading group (info in signature, group is free of charge).
Trend Following IndicatorTrend Following Indicator is for following trend and being in trend till trend is not changed.
Each Bullish and Bearish signal you can add one more future or option lot and be in trade till bearish signal is not coming.
You can close Long trade i.e. Bullish pyramiding trade when you see there is small red arrows are there
and similarly when you are in Short trade you can pyramid with each Bearish signal and you can close the trade when small green arrow start coming.
Pros: This signal system is working in stocks and Index and Commodity and Currency.
Cons: Choppy market results are not good on that time you have to believe on small arrows for signals.
This signal is available on subscription. contact me or ping me for more details.

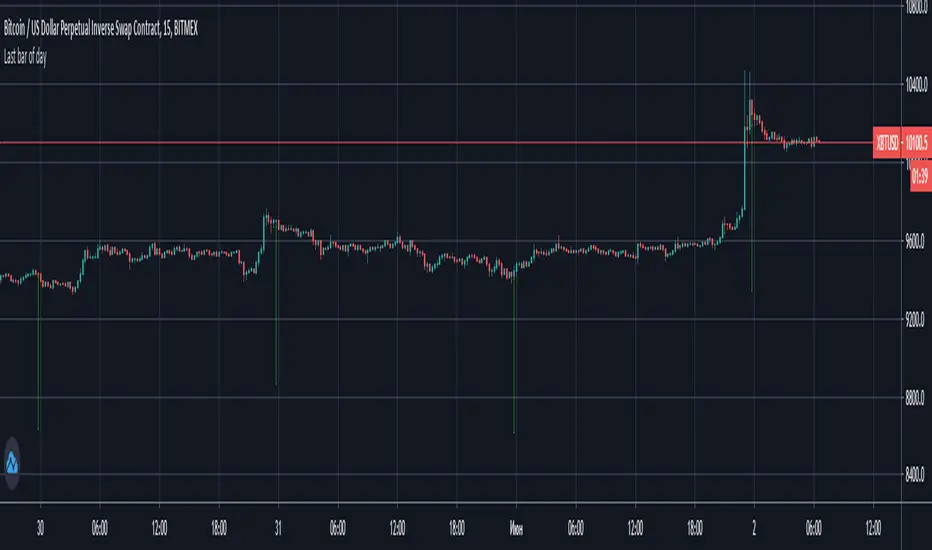
How to detect last bar of day Simple way how to detect last bar of day and close all positions
UPD: day end can be different for yours because stocks market use another timezone
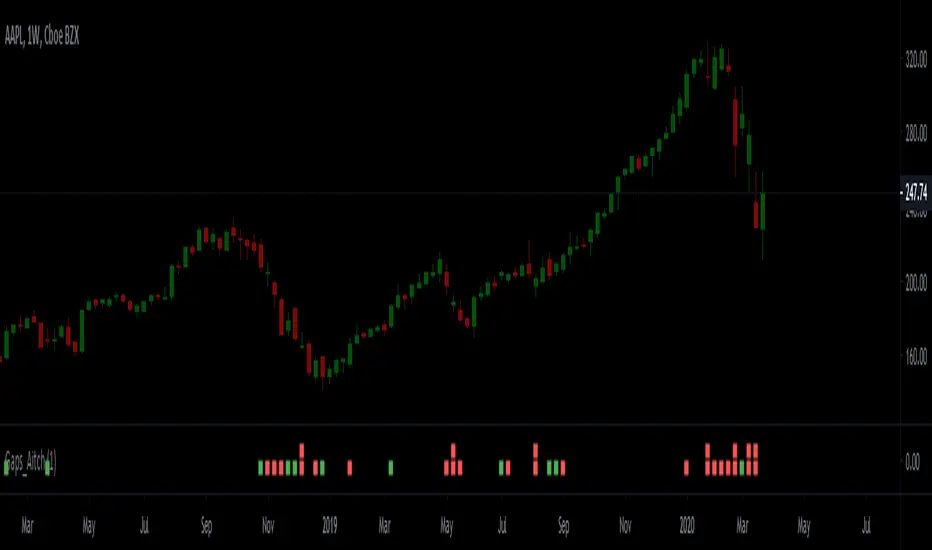
Gap Finder - Aitch-TGap finder finds the following types of gaps:
- Full Gap Up (open price is higher than the previous day's high)
- Partial Gap Up (open price is higher than the previous day's close)
- Full Gap Down (open price is lower than the previous day's low)
- Partial Gap Down (open price is lower that the previous day's close)
The script is fully customizable and can be applied to Forex, futures, stocks and crypto.
How to use it:
Once you have added the script to your chart, go to the script's settings and type in the size of the gap, then move to the style tab and check the types of gaps that you want the script to find. If you wish, you can also edit the rest of the settings to your liking.
Hit the Ok button when your done.
Green and red squares will appear on top and bottom of the indicator pointing out the location of the sharp move.
By default, full gap signals appear on top of the indicator while partial gap signals appear on the bottom of the indicator.
Defaul gap size is 1%.
My VWAP Reversal + Pivot Points StandardThis indicator, with the addition of a standard VWAP indicator to the 5m chart, helps the operator when using a closing candle Price to initiate a VWAP Reversal strategy.
The strategy involves Price gapping up, look for a Close below the 1st 5m candle Low; else look for a Close above the 1st 5m candle High. On a break of VWAP, take the trade in the opposite direction of the gap, hence the VWAP Reversal. Not my own strat, credit to T3 Newsbeat, publicly posted on YouTube.
The Pivot Points Standard in the Pine 4 user manual, was the base source code, and leaving it here will allow me to remove the PP indicator I was using.

GAPS CheckerUsing this indicator allows you to indentify large GAPS directly in your stock chart at first glance.
It uses two different sorts for large GAPS (e.g. larger than 3%) and for very large GAPS (e.g. larger than 6%). These values can be changed in the indicator settings.
Hope this helps many of you to be more efficient in your chart analysis - have fun!

ATS Masters Indicator #3This master indicator is a collection of multiple useful indicators, which only requires one indicator slot in TradingView.
In this collection you will find the following 4 special indicators:
Gaps Checker
Large Candles Checker
SPY Checker Lite
Volume Checker Pro
So, using this master indicator you are able to use up to 4 special indicators in one.
If you would like to test this master indicator drop me a line and send a request for it.

GAPS Checker v2 PROUsing this indicator allows you to indentify large GAPS directly in your stock chart at first glance. The algorithm of the indicator *Gaps Checker v2* was optimized in this new indicator as well as it using the new pine script version v4. For backwards compatibility reasons this indicator is published.
This indicator is available in two versions ‘Lite’ and ‘PRO’. The difference is the calculated precision and the percent inputs in integer numbers or more granular in float values.
It uses two different sorts for large GAPS (yellow, e.g. larger than 2%) and for very large GAPS (red, e.g. larger than 4%). These values can be changed in the indicator settings.
Hope this helps many of you to be more efficient in your chart analysis - have fun!

GAPS Checker v2 LiteUsing this indicator allows you to indentify large GAPS directly in your stock chart at first glance. The algorithm of the indicator *Gaps Checker v2* was optimized in this new indicator as well as it using the new pine script version v4. For backwards compatibility reasons this indicator is published.
This indicator is available in two versions ‘Lite’ and ‘PRO’. The difference is the calculated precision and the percent inputs in integer numbers or more granular in float values.
It uses two different sorts for large GAPS (yellow, e.g. larger than 2%) and for very large GAPS (red, e.g. larger than 4%). These values can be changed in the indicator settings.
Hope this helps many of you to be more efficient in your chart analysis - have fun!

GapGap
I've seen many trade decisions based on the CME Bitcoin Futures gap, so this indicator will let you know if that strategy is good or not, so use it as another confirmation 👍🏻.
- Shows when a gap is created, when it is filled and if not filled if a new gap is created.
- You can also use another security as a reference.
- Multi Timeframe , by default it will search the daily gaps.

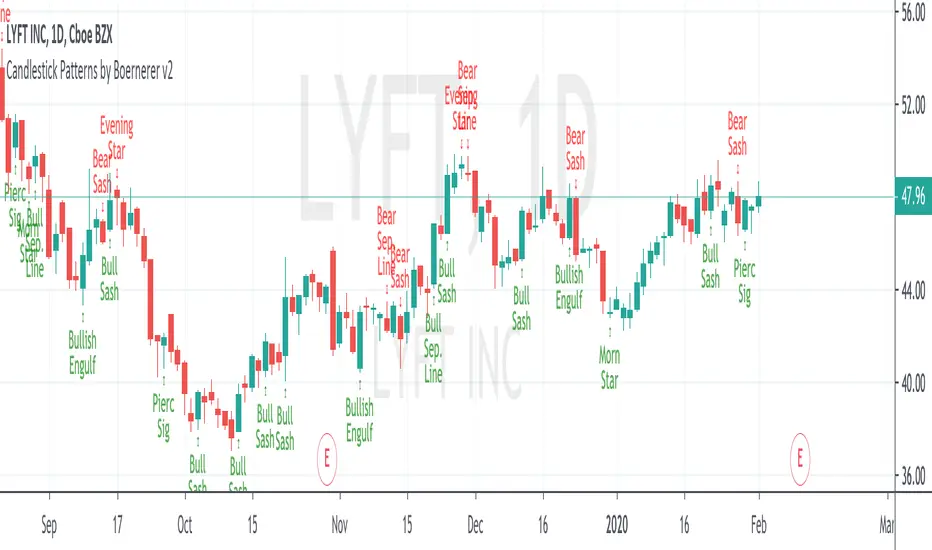
Candlestick Patterns by Boernerer v2New version 2 of my modifications of the original candlestick pattern script by Robert Waddell.
- Added window (= gaps) detection
- Added Bear/Bull Sash
- Added Bear/Bull Counter Attack
- Added Bear/Bull Seperating Line
- Modified candlestick ID code
- Added Lookback period instead of SMA (TLine) for trend detection
Candlestick Patterns + windows Mod by BoernererMy modifications for the candlestick pattern script by Robert Waddell.
Changelog
- Added window (= gaps) detection
- Added Bear/Bull Sash
- Modified candlestick ID code
- Candlesticks will only be displayed if above or below TLine
Originally created by Robert Waddell with special thanks to repo32 for his candlestick ID code, DavidR for EMA code and Chris Moody for barcolor code.
Enjoy and would love if you improve it further!

Find GapsShow a symbol or/and create an alert if there is a gap between candles. Percentage of gaps can be adjusted.

[AN] GapierA colored gap finder.
It colors a gap until it gets closed. It displays an info for the current opened gaps (range).
Allows to change the gap timeframe
Allows you to overlay gaps of other symbol on the current one
There are some assets that really like to fill the gaps. Using this indicator you can have a better understanding on where the price is heading (on the current trend).

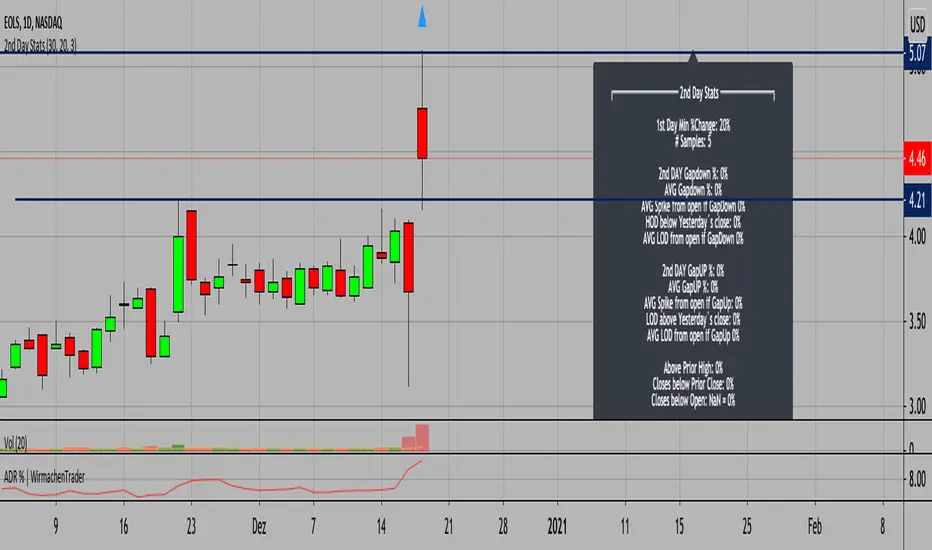
2nd Day Stats / BACKTESTING TOOL//English version below
## Deutsche Version
Was passiert am 2. Tag, nachdem wir X % am ersten Tag zurückgelegt haben? Genau dies lässt sich sehr gut backtesten und die Erkenntnisse im Markt anwenden. Dieses Tool eignet sich besonders für kleinere Aktien (Small-Caps) oder Aktien, die am Tag der Quartalszahlen große Bewegungen zurückgelegt haben. Backtesting war selten so einfach.
## English version
What happens after a strong day 1 move? Use the custom input to test, what happened after a 10% move on day one. Change the day 1 move % and the number of years to backtest. It's that simple. The tool is especially helpful for small-cap traders and for stocks after earnings.