Pair Creation🙏🏻 The one and only pair construction tech you need, unlike others:
Applies one consistent operation to all the data features (not only prices). Then, the script outputs these, so you can apply other calculations on these outputs.
calculates a very fast and native volatility based hedge ratio, that also takes into account point value (think SPY vs ES) so you can easily use it in position sizing
Has built-in forward pricing aka cost of carry model , so you can de-drift pairs from cost of carry, discover spot price of oil based on futures, and ofc find arbitrage opportunities
Also allows to make a pair as a product of 2 series, useful for triangular arbitrage
This script can make a pair in 2 ways:
Ratio, by dividing leg 1 by leg 2
Product, by multiplying leg 1 by leg 2
The real mathematically right way to construct a pair is a ratio/product (Spreads are in fact = 2 legged portfolio, but I ain't told ya that ok). Why? Because a pair of 2 entities has a mathematically unique beauty, it allows direct comparisons and relationship analysis, smth you can't do directly with 3 and more components.
Multiplication (think inversions like (EURUSD -> USDEUR), and use cases for triangular arbitrage) is useful sometimes too.
...
Quickguide:
First, "Legs" are pair components: make a pair of related assets. Don’t be guided exclusively by clustering, cointegrations, mutual information etc. Common sense and exogenous info can easily made them all Forward pricing model: is useful when u work with spot vs futures pairs. Otherwise: put financing, storage and yield all on zeros, this way u will turn it off and have a pure ratio/product of 2 legs.
Look at the 2 numbers on the script’s status line: the first one would always be 1), and the second one is a variable.
First number (always 1) is multiplier for your position size on leg 1
The second number is the multiplier for your position size on leg 2 in the opposite direction.
If both legs are related, trading your sizes with these multipliers makes you do statistical arbitrage -> trading ~ volatility in risk free mode, while the relationship between the assets is still in place.
Also guys srsly, nobody ‘ever’ made a universal law that somewhy somehow for whatever secret conspiracy reason one shall only trade pairs in mean reverting style xd. You can do whatever you want:
Tilt hedge ratio significantly based on relative strength of legs
Trade the pair in momentum style
Ignore hedge ratio all together
And more and more, the limit is your imagination, e.g.:
Anticipate hedge ratio changes based on exogenous info and act accordingly
Scalp a pair just like any other asset
Make a pair out of 2 pairs
Like I mean it, whatever you desire
About forward pricing model:
It’s applied only to leg 2;
Direct: takes spot price and finds out implied futures price
Inverse: takes futures price and finds out implied spot price (try on oil)
Pls read online how to choose parameters, it’s open access reliable info
About the hedge ratio I use:
You prolly noticed the way I prefer to use inferred volumes vs the “real” ones. In pairs it’s especially meaningful, because real volumes lose sense in pair creation. And while volumes are closely tied to volatility, the inferred volumes ‘Are’ volatility irl (and later can be converted to currency space by using point value, allowing direct comparisons symbol vs symbol).
This hedge ratio is a good example of how discovering the real nature of entities beats making 100s of inventions, why domain knowledge and proper feature engineering beats difficult bulky models, neural networks etc. How simple data understanding & operations on it is all you need.
This script simply does this:
Takes inferred volume delta of both assets, makes a ratio, normalizes it by tick sizes and points values of both legs, calculates a typical value of this series.
That’s it, no step 2, we’re done. No Kalman filters, no TLS regression, no vine copulas, or whatever new fancy keywords you can come up with etc.
...
^^ comparing real ES prices vs theoretical ones by forward-pricing model. Financing: 0.04, yield 0.0175
^^ EURUSD, 6E futures with theoretical futures price calculated with interest rate differential 0.02 (4% USD - 2% EUR interest rates)
^^4 different pairs (RTY/ES, YM/ES, NQ/ES, ES/ZN) each with different plot style (pick one you like in script's Style settings)
^^ YM/RTY pair, each plot represents ratio of different features: ratio of prices, ratio of inferred volume deltas, ratio of inferred volumes, ratio of inferred tick counts (also can be turned on/off in Style settings)
...
How can u upgrade it and make a step forward yourself:
On tradingview missing values are automatically fixed by backfilling, and this never becomes a thing until you hit high frequency data. You can do better and use Kalman filter for filling missing values.
Script contains the functions I use everywhere to calculate inferred volume delta, inferred volume, and inferred tick count.
...
∞
Hedging

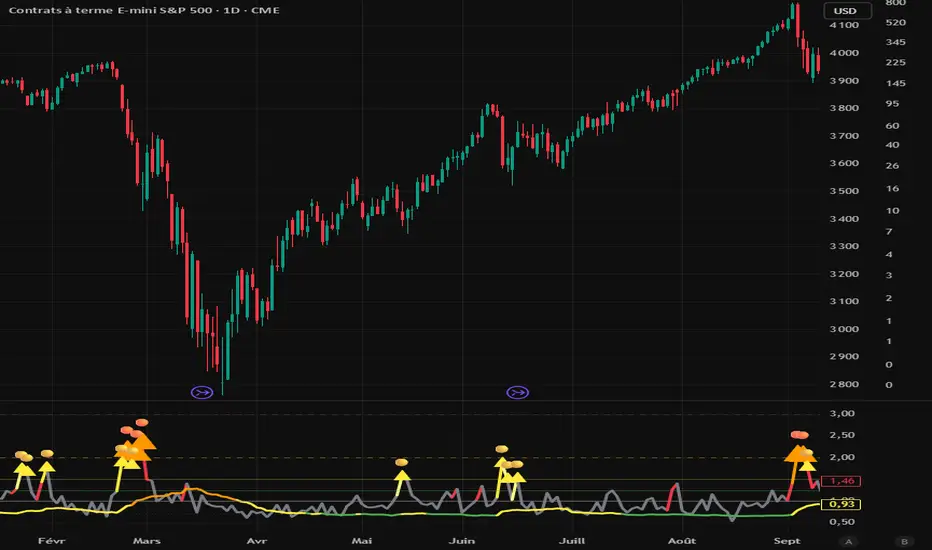
Volume and Volatility Crisis Detector Volume + Volatility Crisis Detector Pro
Created by Alphaomega18
🎯 What is the Crisis Detector Pro?
The Volume + Volatility Crisis Detector Pro is an advanced indicator that combines:
8-Level Volume Analysis: Progressive detection of volume anomalies
Hedging Index: Measurement of institutional fear and protection activity
Progressive Crisis Detection: Identification of pre-crisis patterns like 1987 and 2008
📊 Indicator Components
1️⃣ Volume Ratio
Description:
Compares current volume to its 20-period moving average
Normal value: ~1.0 (volume = average)
High value: >2.0 (volume double the average)
Extreme value: >3.0 (volume triple the average)
8-Level Classification:
LevelRatioColorMeaning1< 1.25x⚪ GrayNormal volume21.25-1.5x🟢 GreenEarly alert31.5-1.75x🟡 Light YellowLight increase41.75-2.0x🟡 YellowModerate52.0-2.25x🟠 OrangeSignificant62.25-2.5x🟠 Dark OrangeVery high72.5-3.0x🔴 RedExtreme8> 3.0x🔴 Bright RedCRISIS
2️⃣ Hedging Index
Description:
Estimates institutional hedging activity (protection buying)
Based on: Weighted bearish volume + ATR volatility
Scale: 0.3 to 2.5 (like a Put/Call ratio)
Hedging Levels:
ValueColorMeaning< 0.7🟢 GreenNormal hedging0.7-1.0🟡 YellowElevated hedging1.0-1.3🟠 OrangeHigh hedging> 1.3🔴 RedPANIC - Extreme hedging
Interpretation:
Rising hedging = Institutions protecting → Market fear
Falling hedging = Confidence returning → Possible rebound
⚙️ Main Parameters
Calculations:
Moving Average Period: 20 (reference period for averages)
Volume Classification (8 Levels):
Level 1: 1.25x (early alert)
Level 2: 1.5x (light increase)
Level 3: 1.75x (moderate)
Level 4: 2.0x (significant)
Level 5: 2.25x (high)
Level 6: 2.5x (very high)
Level 7: 3.0x (extreme)
Level 8: > 3.0x (crisis)
Hedging:
Enable Hedging Detection: Enable/disable hedging index
Hedging Period: 14 (smoothing period)
Display:
Show Signals: Display visual signals
📈 Visual Elements
Main Lines:
Volume Ratio (thick colored line): Current volume ratio vs average
🛡️ Hedging Index (thick colored line): Institutional hedging index
Horizontal Threshold Lines:
For Volume:
1.0 = Normal (thick gray line)
1.25 = Level 1 (green dashed)
1.5 = Level 2 (yellow dashed)
2.0 = Level 4 (orange dashed)
3.0 = Level 7 (red dashed)
For Hedging:
0.7 = Normal (thin green dashed)
1.0 = High (thin orange dashed)
1.3 = PANIC (thin red dashed)
Visual Signals:
🔴 Red triangle: Extreme volume (level 7-8)
🟠 Orange triangle: High volume (level 5-6)
🟡 Yellow triangle: Moderate volume (level 3-4)
Colored Background:
Transparent red: Extreme volume or panic hedging
🎯 How to Use the Indicator
1. Installation
Open TradingView
Click "Indicators" at top of chart
Click "Pine Editor" at bottom
Paste the code
Click "Add to Chart"
2. Reading the Chart
Volume Ratio (main line):
Around 1.0 = Normal volume, no alert
Between 1.25 and 2.0 = Volume increasing, watch closely
Above 2.0 = Abnormal volume, strong activity
Above 3.0 = CRISIS - Extreme volume
Hedging Index (hedging line):
Around 0.7 = Calm market
Rising toward 1.0 = Growing nervousness
Above 1.3 = Institutional PANIC
3. Trading Strategies
🟢 Scalping/Day Trading:
Volume Ratio > 2.0:
Scalping opportunity in direction of movement
Quick entries with tight stops
Exit on activity spikes
Hedging Index > 1.0:
Nervous market = bounce opportunities
Wait for confirmation before entering
🟠 Swing Trading:
Volume Ratio > 2.5:
Avoid opening new swing positions
Protect existing positions (trailing stops)
Wait for return to normal (< 1.5)
Hedging Index > 1.3:
Panic = possible capitulation
Look for reversal opportunities
Wait for hedging to drop
🔴 Risk Management:
Volume RatioHedging IndexRecommended Action< 1.5< 0.7Normal trading1.5-2.00.7-1.0Increased monitoring2.0-3.01.0-1.3Reduce exposure 50%> 3.0> 1.3STOP trading / Protection
4. Crisis Patterns (1987/2008 Style)
Pre-Crisis Pattern:
Volume staying above 1.5x for 5+ days
With 3+ days above 2.0x
= Stress accumulation before explosion
Crisis Building Pattern:
5+ consecutive days above 2.0x
Hedging rising progressively
= Crisis is building
Immediate Crisis Pattern:
Volume > 3.0x
Hedging > 1.3
= Widespread PANIC
🔔 Configurable Alerts
The indicator includes 6 main alerts:
🟢 Level 1: First volume anomaly (1.25x)
🔴 Level 6+: Very high volume (2.25x+)
🔴🔴 CRISIS: Extreme volume (3.0x+)
🛡️ PANIC HEDGING: Panic hedging (1.3+)
Configuration:
Right-click on chart
"Create Alert"
Condition: Select desired alert
Options: Set frequency
Actions: Email, notification, webhook, etc.
💡 Real Use Cases
Example 1: Flash Crash
Volume Ratio: 4.5 (🔴)
Hedging Index: 1.8 (🔴)
Signal: EXTREME CRISIS
Action: Full protection, no new trades
Example 2: Fed Announcement
Volume Ratio: 2.3 (🟠)
Hedging Index: 1.1 (🟠)
Signal: High volume and hedging
Action: Reduce positions, wide stops
Example 3: Technical Squeeze
Volume Ratio: 2.8 (🔴)
Hedging Index: 0.9 (🟡)
Signal: Breakout without panic
Action: Follow movement with confirmation
Example 4: Capitulation
Volume Ratio: 3.5 (🔴)
Hedging Index: 1.5 → 0.8 (rapid drop)
Signal: Panic then relief
Action: Look for bounce opportunities
🔧 Parameter Optimization
Scalping (1-5 min):
Moving Average Period: 10
Level 1: 1.2x
Level 4: 1.8x
Level 7: 2.5x
Hedging Period: 7
Day Trading (15min-1H):
Moving Average Period: 20 (default)
All thresholds: Default
Hedging Period: 14 (default)
Swing Trading (4H-Daily):
Moving Average Period: 30-50
Level 1: 1.3x
Level 4: 2.2x
Level 7: 3.5x
Hedging Period: 20
Crypto (Very volatile):
Moving Average Period: 20
Level 1: 1.5x
Level 4: 2.5x
Level 7: 4.0x
Hedging Period: 14
⚠️ Limitations and Best Practices
❌ Limitations:
Hedging is estimated, not based on real Put/Call data
May give false signals in very volatile markets
Requires significant volume to be reliable
✅ Best Practices:
Always combine with classic technical analysis
Never trade solely on alerts
Adapt thresholds to your asset and timeframe
Backtest before using live
Respect your risk management plan
Golden Rule:
"The indicator detects anomalies, not direction. Always wait for confirmation before entering positions."
📈 Performance and Compatibility
✅ Real-time: Instant detection (0 lag)
✅ All markets: Stocks, Futures, Forex, Crypto
✅ All timeframes: 1min to Monthly
✅ Lightweight: Optimized, no slowdown
✅ Multi-platform: TradingView web, mobile, desktop
🎓 Historical Crises
1987 - Black Monday:
Volume Ratio: x5-x10 for several days
Pattern: Progressive increase then explosion
2008 - Lehman Brothers:
Volume Ratio: x3-x7 for weeks
Hedging: Historical record
Pattern: Prolonged stress then panic
2020 - COVID Crash:
Volume Ratio: x4-x8 in few days
Pattern: Rapid fall with intense panic
2022 - Crypto Winter:
Volume Ratio: x2-x4 over several months
Pattern: Successive capitulations
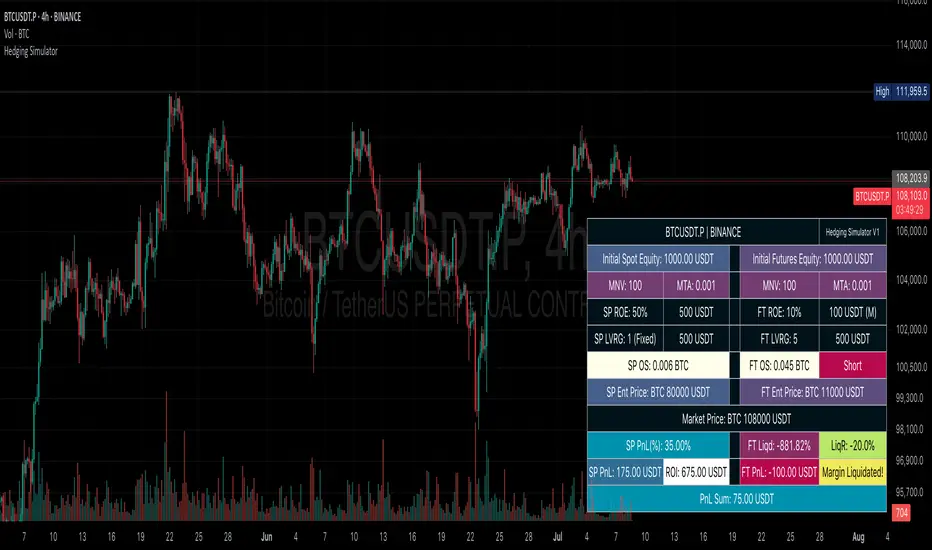
Hedging SimulatorHedging Simulator
The Hedging Simulator is a straightforward hedging tool designed to simulate potential profit and loss outcomes from combined Spot and Futures positions in the cryptocurrency market.
Users can define their equity allocation separately for both spot and futures, allowing for flexible and realistic scenario modelling.
The tool also incorporates MNV (Minimum Notional Value) and MTA (Minimum Trade Amount) parameters to estimate order sizes based on symbol-specific trading rules set by exchanges. While the results may differ slightly from actual exchange calculations, the simulator aims to provide a close approximation for general understanding.
📌Note: Crypto-Only - This tool is designed specifically for cryptocurrency trading and is not intended for use with traditional financial instruments.
Entry Price: Users can input custom entry prices for both spot and futures trades to simulate from specific market positions.
Live Price: The entry price fields for both spot and futures support Live Price based on the currently viewed symbol on your chart.
📌Note: In the real market, spot and futures prices are not always identical—there can be a price gap between them. While the difference is typically small, it's important to understand that the live price shown is only for rough estimation purposes and may not reflect the exact trading price on your chosen exchange.
Expecting Market Price: This represents the projected or target price to simulate potential profit and loss across the hedged position based on market movement.
📌Note: Profit and loss calculations exclude all trading fees. Actual results in live markets may vary due to fees, slippage, and exchange rules.
Feedback: If you notice any bugs, errors on calculation, or have suggestions for better calculations or new features, feel free to share your thoughts. Your feedback helps improve the tool and will be considered for future updates.
⚠️ Disclaimer: This simulator is intended for educational and illustrative purposes only. It does not constitute financial advice or guarantee trading results. Market conditions may vary, and all trading carries inherent risks. Users are solely responsible for any decisions made based on this tool and bear full responsibility for their own trading outcomes.
Bear Market Defender [QuantraSystems]Bear Market Defender
A system to short Altcoins when BTC is ranging or falling - benefit from Altcoin bleed or collapse .
QuantraSystems guarantees that the information created and published within this document and on the TradingView platform is fully compliant with applicable regulations, does not constitute investment advice, and is not exclusively intended for qualified investors.
Important Note!
The system equity curve presented here has been generated as part of the process of testing and verifying the methodology behind this script.
Crucially, it was developed after the system was conceptualized, designed, and created, which helps to mitigate the risk of overfitting to historical data. In other words, the system was built for robustness, not for simply optimizing past performance.
This ensures that the system is less likely to degrade in performance over time, compared to hyper-optimized systems that are tailored to past data. No tweaks or optimizations were made to this system post-backtest.
Even More Important Note!!
The nature of markets is that they change quickly and unpredictably. Past performance does not guarantee future results - this is a fundamental rule in trading and investing.
While this system is designed with broad, flexible conditions to adapt quickly to a range of market environments, it is essential to understand that no assumptions should be made about future returns based on historical data. Markets are inherently uncertain, and this system - like all trading systems - cannot predict future outcomes.
INTRODUCTION TO THE STAR FRAMEWORK
The STAR Framework – an abbreviation for Strategic Trading with Adaptive Risk - is a bespoke portfolio-level infrastructure for dynamic, multi-asset crypto trading systems. It combines systematic position management, adaptive sizing, and “intra-system” diversification, all built on a rigorous foundation of Risk-based position sizing .
At its core, STAR is designed to facilitate:
Adaptive position sizing based on user-defined maximum portfolio risk
Capital allocation across multiple assets with dynamic weight adjustment
Execution-aware trading with robust fee and slippage adjustment
Realistic equity curve logic based on a compounding realized PnL and additive unrealized PnL
The STAR Framework is intended for use as both a standalone portfolio system or preferred as a modular component within a broader trading “global portfolio” - delivering a balance of robustness and scalability across strategy types, timeframes, and market regimes.
RISK ALLOCATION VIA "R" CALCULATIONS
The foundational concept behind STAR is the use of the R unit - a dynamic representation of risk per trade. R is defined by the distance between a trade's entry and its stoploss, making it an intuitive and universally adaptive sizing unit across any token, timeframe, or market.
Example: Suppose the entry price is $100, and the stoploss is $95. A $5 move against the position represents a 1R loss. A 15% price increase to $115 would equal a +3R gain.
This makes R-based systems highly flexible: the user defines the percentage of capital that is put at risk per R and all positions are scaled accordingly - whether the token is volatile, illiquid, or slow-moving.
R is an advantageous method for determine position sizing - instead of being tied to complex value at risk mechanisms with having layered exit criteria, or continuous volatility-based sizing criteria that need to be adjusted while in an open trade, R allows for very straightforward sizing, invalidation and especially risk control – which is the most fundamental.
REALIZED BALANCE, FEES & SLIPPAGE ACCOUNTING
All position sizing, risk metrics, and the base equity curve within STAR are calculated based on realized balance only .
This means:
No sizing adjustments are made based on unrealized profit and loss ✅
No active positions are included in the system's realized equity until fully closed ✅
Every trade is sized precisely according to current locked-in realized portfolio balance ✅
This creates the safest risk profile - especially when multiple trades are open. Unrealized gains are not used to inflate sizing, ensuring margin safety across all assets.
All calculations also incorporate slippage and fees, based on user-defined estimates – which can and should be based upon user-collected data - and updated frequently forwards in time. These are not cosmetic, or simply applied to the final equity curve - they are fully integrated into the dynamic position sizing and equity performance , ensuring:
Stoploss hits result in exactly a −1R loss, even after slippage and fees ✅
Winners are discounted based on realistic execution costs ✅
No trade is oversized due to unaccounted execution costs ✅
Example - Slippage in R Units:
Let R be defined as the distance from entry to stoploss.
Suppose that distance is $1, and the trade is closed at a win of +$2.
If execution slippage leads to a 50 cent worse entry and a 50 cent worse exit, you’ve lost $1 extra - which is an additional 1R in execution slippage. This makes the effective return 1.0R instead of the intended 2.0R.
This is equivalent to a slippage value of 50%.
Thus, slippage in STAR is tracked and modelled on an R-adjusted basis , enabling more accurate long-term performance modelling.
MULTI-ASSET, LONG/SHORT SUPPORT
STAR supports concurrent long and short positions across multiple tokens. This can sometimes result in partially hedged exposure - for example, being long one asset and short another.
This structure has key benefits:
Diversifies idiosyncratic risk by distributing exposure across multiple tokens
Allows simultaneous exploitation of relative strength and weakness
Reduces portfolio volatility via natural hedging during reduced trending periods
Even in a highly correlated market like crypto, short-term momentum behaviour often varies between tokens - making diversified, multi-directional exposure a strategic advantage .
EQUITY CURVE
The STAR framework only updates the underlying realized equity when a position is closed, and the trade outcome is known. This approach ensures:
True representation of actual capital available for trading
No exposure distortion due to unrealized gains
Risk remains tightly linked to realized results
This trade-to-trade basis for realized equity modelling eliminates the common pitfall of overallocation based on unrealized profits.
The visual equity curve represents an accurate visualization of the Total Equity however, which is equivalent to what would be the realized equity if all trades were closed on the prior bar close.
TIMEFRAME CONSIDERATIONS
Lower timeframes typically yield better performance for STAR due to:
Greater data density per day - more observations = better statistical inference
Faster compounding - more trades per week = faster capital rotation
However, lower timeframes also suffer from increased slippage and fees. STAR's execution-aware structure helps mitigate this, but users must still choose timeframes appropriate to their liquidity, costs, and operational availability.
INPUT OPTIONS
Fees (direct trading costs - the percentage of capital removed from the initial position size)
Slippage (execution delay, as a percentage. In practice, the fill price is often worse than the signal price. This directly affects R and hence position sizing)
Risk % ( Please note : this is the risk level if every position is opened at once. 5% risk for 5 assets is 1% risk per position)
System Start date
Float Precision value of displayed numbers
Table visualization - positioning and table sizes
Adjustable color options
VISUAL SIMPLICITY
To avoid usual unnecessary complexity and empower fast at-a-glance action taking, as well as enable mobile compatibility, only the most relevant information is presented.
This includes all information required to open positions in one table.
As well as a quick and straightforward overview for the system stats
Lastly, there is an optional table that can be enabled
displaying more detailed information if desired:
USAGE GUIDELINES
To use STAR effectively:
Input your average slippage and fees %
Input your maximum portfolio risk % (this controls overall leverage and is equivalent to the maximum loss that the allocation to STAR would bring if ALL positions are allocated AND hit their stop loss at the same time)
Wait for signal alerts with entry, stop, and size details
STAR will dynamically calculate sizing, risk exposure, and portfolio allocation on your behalf. Position multipliers, stop placement, and asset-specific risk are all embedded in the system logic.
Note: Leverage must be manually set to ISOLATED on your exchange platform to prevent unwanted position linking.
ABOUT THE BEAR MARKET DEFENDER STRATEGY
The first strategy to launch on the STAR Framework is the BEAR MARKET DEFENDER (BMD) - a fast-acting, trend following system based upon the Trend Titan NEUTRONSTAR. For the details of the logic behind NEUTRONSTAR, please refer to the methodology and trend aggregation section of the following indicator:
The BMD ’s short side exit calculation methodology is slightly improved compared to NEUTRONSTAR, to capture downtrends more consistently and also cut positions faster – which is crucial when considering general jump risk in the Crypto space.
Accordingly, the only focus of the BMD is to capture trends to the short side, providing the benefit of being in a spectrum from no correlation to being negatively correlated in risk and return behavior to classical Crypto long exposure.
More precisely, Crypto behavior showcases that when Bitcoin is in a ranging/mean reverting environment, most tokens that don’t fall into the “Blue-Chip” category tend to find themselves in a trend towards 0.
Typically during this period most Crypto portfolios suffer heavily due to a “Crypto-long” biased exposure.
The Bear Market Defender thrives in these chaotic, high volatility markets where most coins trend towards zero while the traditional Crypto long exposure is either flat or in a drawdown, therefore the BMD adds a source of uncorrelated risk and returns to hedge typical long exposure and bolster portfolio volatility.
Because of the BMD's short-only exposure, it will often suffer small losses during strong uptrends. During these periods, long exposure performs the best and the goal is to outperform the temporary underperformance in the BMD .
To take advantage of the abovementioned behavior of most tokens trending to zero, assets traded in the BMD are systematically updated on a quarterly basis with available liquidity being an important consideration for the tokens to be eligible for selection.
FINAL SUMMARY
The STAR Framework represents a new generation of portfolio grade trading infrastructure, built around disciplined execution, realized equity, and adaptive position sizing. It is designed to support any number of future methodologies - beginning with BMD .
The Bear Market Defender is here to hedge out commonly long biased portfolio allocations in the Crypto market, specializing in bringing uncorrelated returns during periods of sideways price action on Bitcoin, or whole-market downturns.
Together, STAR + BMD deliver a scalable, volatility tuned system that prioritizes capital preservation, signal accuracy, and adaptive risk allocation. Whether deployed standalone or within a broader portfolio, this framework is engineered for high performance, longevity, and adaptability in the ever-evolving crypto landscape.

Correlation MA – 15 Assets + Average (Optional)This indicator calculates the moving average of the correlation coefficient between your charted asset and up to 15 user-selected symbols. It helps identify uncorrelated or inversely correlated assets for diversification, pair trading, or hedging.
Features:
✅ Compare your current chart against up to 15 assets
✅ Toggle assets on/off individually
✅ Custom correlation and MA lengths
✅ Real-time average correlation line across enabled assets
✅ Horizontal lines at +1, 0, and -1 for easy visual reference
Ideal for:
Portfolio diversification analysis
Finding low-correlation stocks
Mean-reversion & pair trading setups
Crypto, equities, ETFs
To use: set the benchmark chart (e.g. TSLA), choose up to 15 assets, and adjust settings as needed. Look for assets with correlation near 0 or negative values for uncorrelated performance.

Correlation Coefficient📊 Correlation Coefficient (CC)
This indicator measures the statistical correlation between two selected securities over a defined period, scaled from -100 to +100.
It helps you quickly assess whether assets are moving:
Together (positive correlation)
Opposite (negative correlation)
Independently (zero correlation)
🔧 Features:
Select any two symbols (default: NIFTY & BANKNIFTY)
Adjustable length parameter for short-term or long-term correlation analysis
Clean, color-coded plot with horizontal levels to easily identify key correlation zones
📈 Useful For:
Pair trading setups
Hedging strategies
Detecting market regime shifts or intermarket divergences
⚠️ Disclaimer: This is not trading or investment advice.
This indicator is intended for informational purposes only and is not recommended for making
direct trading decisions.

Hedge Coin M - Statistical Support and ResistanceHedge Coin M - Statistical Support and Resistance
Introduction
"Hedge Coin M - Statistical Support and Resistance" is a sophisticated, statistically-driven indicator designed specifically for traders in the COIN-M market on Binance. It offers a nuanced approach to identifying key market levels, focusing on the dynamics of support and resistance through advanced volatility analysis.
Foundation and Credits:
This script is an advanced adaptation of TradingView's standard code for the Bollinger Bands indicator. It extends the foundational concept of Bollinger Bands by integrating additional volatility metrics.
Calculation Method
This indicator employs Volume Weighted Moving Averages (VWMA) to create two distinct sets of Bollinger Bands, named BB-a and BB-b.
BB-a is derived from the VWMA of high prices, targeting potential resistance levels.
BB-b is based on the VWMA of low prices, aimed at identifying critical support levels.
Users can independently adjust the standard deviation (SD) multipliers for the upper and lower bands of both BB-a and BB-b, accommodating different market conditions.
Enhanced Volatility Analysis
The indicator calculates additional standard deviation lines for the upper band of BB-a and the lower band of BB-b. These lines provide deeper insights into market volatility.
Plotted Graphs
The primary plots include the upper and lower bands of BB-a and BB-b, marked in distinct colors for clarity.
Additional SD lines are plotted to indicate potential extended levels of support and resistance, offering traders a broader view of possible market movements.
Purpose and Usage
"Hedge Coin M - Statistical Support and Resistance" is designed to provide traders with a consistent, statistical method for identifying significant price levels.
It aids in scaling entry into positions, helping traders to navigate the COIN-M market with more informed decision-making.
This tool is especially useful for traders who combine long-term holding with swing trading strategies, offering a balanced approach to market engagement.
Integration and Adaptation
Easily integrate this indicator into your TradingView chart for the COIN-M market.
Use the insights provided to complement your overall trading strategy, particularly in identifying and reacting to significant market movements.
Disclaimer
Important Note: This indicator is provided for informational purposes only. It does not constitute financial advice, investment advice, trading advice, or any other sort of advice. Trading decisions should be made based on your own analysis, prudence, and judgment. Please be aware of the risks involved in trading and consult a financial advisor if necessary.

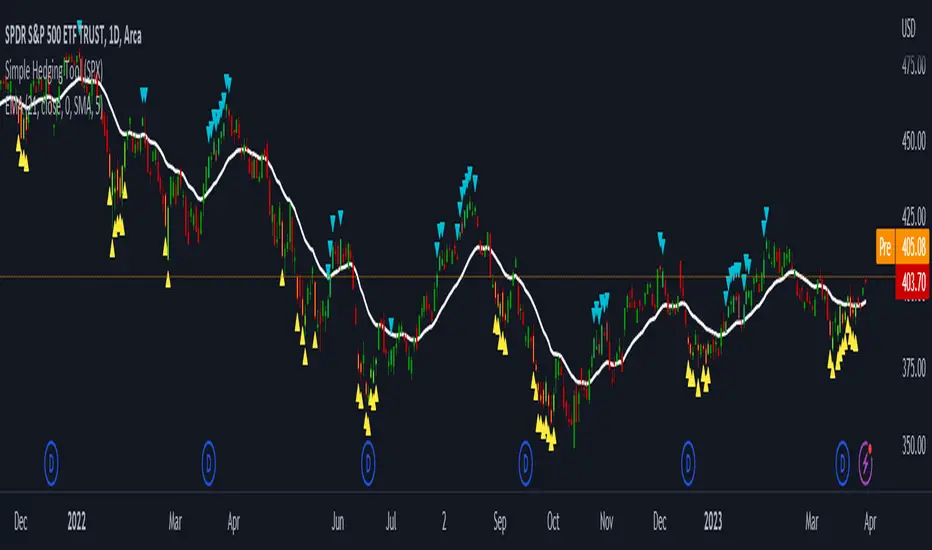
LNL Simple Hedging ToolLNL Simple Hedging Tool
Simple Hedging Tool was created specifically for swing traders who struggle with hedging. This tool helps to spot the ideal moments to put the hedges on (protection of the portfolio during "high risk" times). Simple Hedging Tool will not help you when day trading. It was designed for the daily charts. It is called simple because it is pretty much self-explanatory indicator. The candles are either blue or yellow. Meaning of the colors depend on the version you are using. This tool consist of two versions:
SPX Version:
This version was designed for indexes & overall market benchmarks. In contrast with the VIX version, the SPX version is little more sophisticated since it is based on key market internals. Blue arrows above the candles? More often than not this is signalizing that the key market internals are now approaching bearish signals which means it is the best time to hedge any bullish positions. On the contrary, the yellow arrows are the good reason to lighten up of the shorts & ease off the gas pedal on any bearish outlooks.
VIX Version:
Apart from the black swan events (big market crashes) Vix usually oscillates between the daily extremes. The VIX version is based on a simple bollinger band technique which is visualized with blue & yellow arrows. Whenever the yellow arrows & candles appear, it is good time to put the hedges on & perhaps lighten up on longs.
IMPORTANT DISCLAIMER:
The signals from this tool WILL NOT TELL YOU where to buy or sell! But rather when is a good time TO NOT buy or TO NOT sell. Once the signals appear it does not necessarily mean that the move is over & reversion willl happen immidiately. These signals can be flashing for days even weeks. They are not flashing for you to change the bias but rather tighten up your exposure in case your portfolio is mostly one sided.
Hope it helps.
4C Expected Move (Weekly Options)This indicator plots the Expected Move (EM) calculated from weekly options pricing, for a quick visual reference.
The EM is the amount that a stock is predicted to increase or decrease from its current price, based on the current level of implied volatility.
This range can be viewed as support and resistance, or once price gets outside of the range, institutional hedging actions can accelerate the move in that direction.
The EM range is based on the Weekly close of the prior week.
It can be useful to know what the weekly EM range is for a stock to understand the probabilities of the overall distance, direction and volatility for the week.
To use this indicator you must have access to a broker with options data (not available on Tradingview).
Look at the stock's option chain and find the weekly expected move. You will have to do your own research to find where this information is displayed depending on your broker.
See screenshot example on the chart. This is the Thinkorswim platform's option chain, and the Implied Volatility % and the calculated EM is circled in red. Use the +- number in parentheses, NOT the % value.
Input that number into the indicator on a weekly basis, ideally on the weekend sometime after the cash market close on Friday, and before the Market open at the beginning of the trading week.
The indicator must be manually updated each week.
It will automatically start over at the beginning of the week.

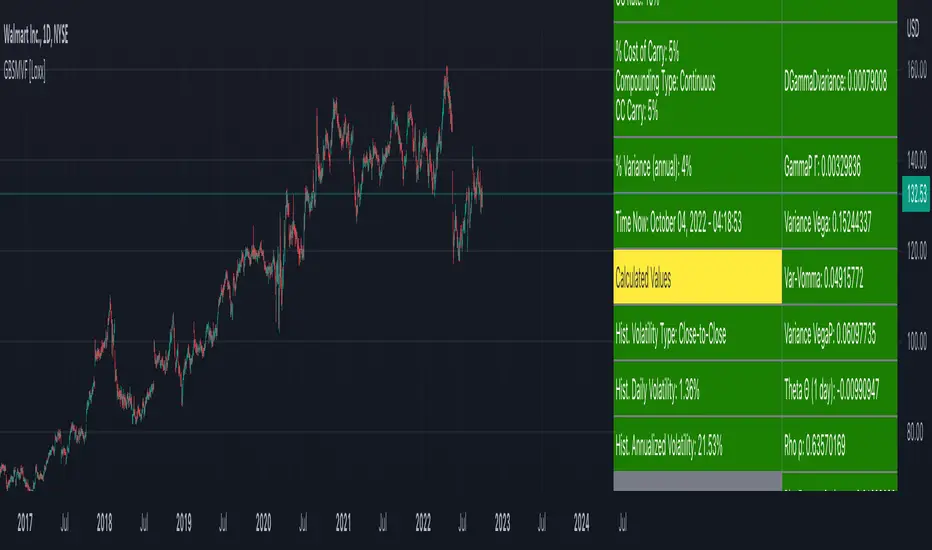
Generalized Black-Scholes-Merton on Variance Form [Loxx]Generalized Black-Scholes-Merton on Variance Form is an adaptation of the Black-Scholes-Merton Option Pricing Model including Numerical Greeks. The following information is an excerpt from Espen Gaarder Haug's book "Option Pricing Formulas". This version is to price Options using variance instead of volatility.
Black- Scholes- Merton on Variance Form
In some circumstances, it is useful to rewrite the BSM formula using variance as input instead of volatility, V = v^2:
c = S * e^((b - r) * T) * N(d1) - X * e^(-r * T) * N(d2)
p = X * e^(-r * T) * N(-d2) - S * e^((b - r) * T) * N(-d1)
where
d1 = (log(S / X) + (b + V^2 / 2) * T) / (V * T)^0.5
d2 = d1 - (V * T)^0.5
BSM on variance form clearly gives the same price as when written on volatility form. The variance form is used indirectly in terms of its partial derivatives in some stochastic variance models, as well as for hedging of variance swaps. The BSM on variance form moreover admits an interesting symmetry between put and call options as discussed by Adamchuk and Haug (2005) at www.wilmott.com .
c(S, X, T, r, b, V) = -c(-S, -X, -T, -r, -b, -V)
and
p(S, X, T, r, b, V) = -p(-S, -X, -T, -r, -b, -V)
It is possible to find several similar symmetries if we introduce imaginary numbers.
b = r ... gives the Black and Scholes (1973) stock option model.
b = r — q ... gives the Merton (1973) stock option model with continuous dividend yield q.
b = 0 ... gives the Black (1976) futures option model.
b = 0 and r = 0 ... gives the Asay (1982) margined futures option model.
b = r — rf ... gives the Garman and Kohlhagen (1983) currency option model.
Inputs
S = Stock price.
X = Strike price of option.
T = Time to expiration in years.
r = Risk-free rate
cc = Cost of Carry
V = Variance of the underlying asset price
cnd (x) = The cumulative normal distribution function
nd(x) = The standard normal density function
convertingToCCRate(r, cmp ) = Rate compounder
Numerical Greeks or Greeks by Finite Difference
Analytical Greeks are the standard approach to estimating Delta, Gamma etc... That is what we typically use when we can derive from closed form solutions. Normally, these are well-defined and available in text books. Previously, we relied on closed form solutions for the call or put formulae differentiated with respect to the Black Scholes parameters. When Greeks formulae are difficult to develop or tease out, we can alternatively employ numerical Greeks - sometimes referred to finite difference approximations. A key advantage of numerical Greeks relates to their estimation independent of deriving mathematical Greeks. This could be important when we examine American options where there may not technically exist an exact closed form solution that is straightforward to work with. (via VinegarHill FinanceLabs)
Things to know
Only works on the daily timeframe and for the current source price.
You can adjust the text size to fit the screen
R:R Trading System FrameworkFirst off, huge thanks to @fikira! He was able to adapt what I built to work much more efficiently, allowing for more strategies to be used simultaneously. Simply put, I could not have gotten to this point without you. Thanks for what you do for the TV community. Second, I am fairly new to pinescript writing, so I welcome criticism, thoughtful input and improvement suggestions. I would love to grow this concept into something even better, if possible. So please let me know if you have any ideas for improvement. However I do juggle a lot of different things outside of TV, so implementations may be delayed.
I have decided, at this time, not to add alerts. First, because I feel most people looking to adapt this framework can add their own pretty easily. Also, given how customized the framework is currently, while also attempting to account for all the possible ways in which people may want alerts to function after they customize it, it seems best to leave them out as it doesn't exactly fit the idea of a framework.
For best viewing, I recommend hovering over the script's name > ... > Visual order > Bring to front. Also I found hollow candles with mono-toned colors (like pictured) are more visually appealing for me personally. I HIGHLY RECOMMEND USING WITH BAR REPLAY TO BETTER UNDERSTAND THE FRAMEWORK'S FUNCTIONALITY.
▶️ WHAT THIS FRAMEWORK IS
- A huge collection of concepts and capabilities for those trying to better understand, learn, or teach pinescript.
- A system designed to showcase Risk:Reward concepts more holistically by providing all of the most popular components of retail trading to include backtesting, trade visual plotting, position tracking, market condition shifts, and useful info while positioned to help highlight changes in your risk:reward based decision-making processes.
- A system that can showcase individual strategies regardless of trade direction, allowing you to develop hedging strategies without having multiple indicators that do not correlate with each other.
- Designed around the idea that you trade less numbers of assets but manage your positions and risk based on multiple concurrently running strategies to manage your risk exposure and reward potential.
- An attempt to combine all the things you need to execute with an active trading management style.
- A framework that uses backtested results (in this case the number of averaged bars it takes to hit key levels) in real-time to inform your risk:reward decision-making while in-trade (in this case in your Trade Tracking Table using dynamic color to show how you might be early, on-time, or late compared to the average amount of backtested time it normally takes to hit that specific key level).
▶️ WHAT THIS FRAMEWORK IS NOT
- A complete trading product. DO NOT USE as-is. It is a FRAMEWORK for you to generate ideas of your own and fairly easily implement your own triggering conditions in the appropriate sections of the script.
▶️ USE CASES
- If you decide you like the Stop, Target, Trailing Stop, and Risk:Reward components as-is, then just understanding how to plug in your Entry and Bullish / Bearish conditions (Triangles) and adjust the input texts to match your custom naming will be all you need to make it your own!
- If you want to adapt certain components, then this system gives you a great starting point to adapt your different concepts and ideas from.
▶️ SYSTEM COMPONENTS
- Each of the system's components are described via tooltips both in the input menu and in the tables' cells.
- Each label on the chart displays the corresponding price at those triggered conditions on hover with tooltips.
- The Trailing Stop only becomes active once it is above the Entry Price for that trade, and brightens to show it is active. The STOP line (right of price) moves once it takes over for the Entry Stop representing the level of the Trailing Stop at that time for that trade.
- The Lines / Labels to the right of price will brighten once price is above for Longs or below for Shorts. The Trade Tracking Table cells will add ☑️ once price is above for Longs or below for Shorts.
- The brighter boxes on the chart show the trades that occurred based on your criteria and are color coded for all components of each trade type to ensure your references are consistent. (Defaults are TV built-in strategies)
- The lighter boxes on the chart show the highest and lowest price levels reached during those trades, to highlight areas where improvements can be made or additional considerations can be accounted for by either adjusting Entry triggers or Bullish / Bearish triggers.
- Default Green and Red Triangles (Bullish / Bearish) default to having the same triggering condition as the Entry it corresponds to. This is to highlight either a pyramiding concept, early exit, or you can change to account for other things occurring during your trades which could help you with Stop and Target management/considerations.
TradingView and many of its community members have done a lot for me, so this is my attempt to give back.

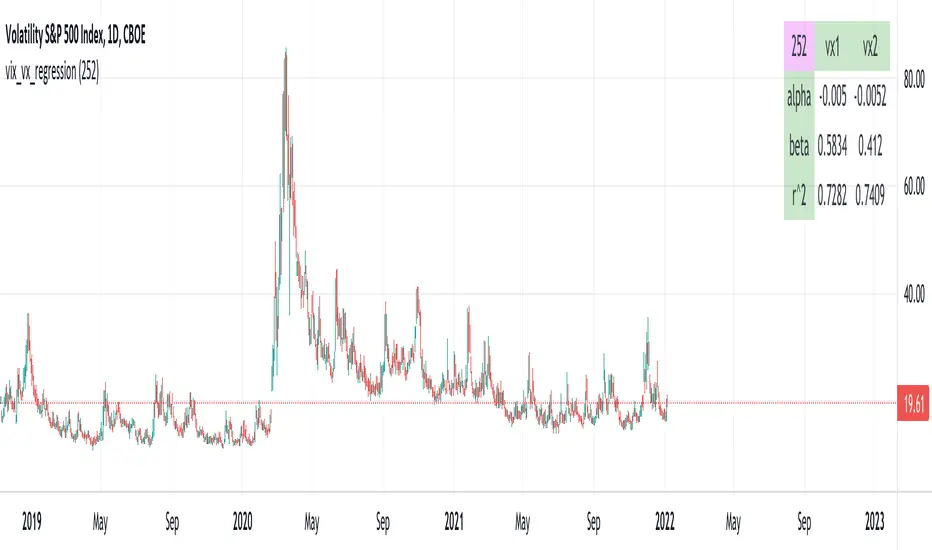
vix_vx_regressionAn example of the linear regression library, showing the regression of VX futures on the VIX. The beta might help you weight VX futures when hedging SPX vega exposure. A VX future has point multiplier of 1000, whereas SPX options have a point multiplier of 100. Suppose the front month VX future has a beta of 0.6 and the front month SPX straddle has a vega of 8.5. Using these approximations, the VX future will underhedge the SPX straddle, since (0.6 * 1000) < (8.5 * 100). The position will have about 2.5 ($250) vega. Use the R^2 (coefficient of determination) to check how well the model fits the relationship between VX and VIX. The further from one this value, the less useful the model.
(Note that the mini, VXM futures also have a 100 point multiplier).
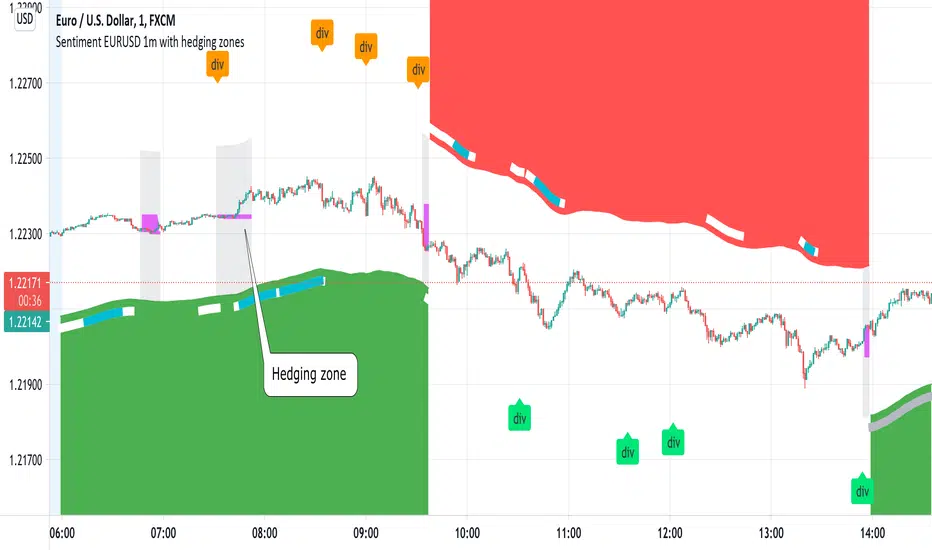
Sentiment EURUSD 1m with hedging zonesThis is a very specialised and optimized script, for 1m EURUSD traders - daytraders, scalpers.
1m trading is very difficult, but it can be also most profitable, if done right.
Why difficult? It is hard to detect market direction - usually when trend indicators reverse, that new trend is already over. One and the same indicator signal sometimes provides one outcome (for example reversal) and sometimes exactly the opposite (continuation). It requires deep understanding on WHEN to use which indicator and when to ignore signals. Set the parameters of your indicators to a very sensitive extent and they will keep changing direction back and forth - always being too late of course :) Set the parameters too losely, and you'll be late with entries 100% of times. Looking for universal trend-showing indicator? There is none...
This script is a result of 2 years of practical following EURUSD 1m market action. Looking at charts with MANUAL TRADER'S eyes. Analyzing all together: price action, indicators, zigzag, divergences, momentum, pivot points, support and resistance. On the one hand traders say only manual trading can be successful and on the other - to stick to one strategy and be automatic when applying to it. So this is it - automatic coding of market signals as if manual trader would do it. Forex is news-driven? Yes, it is. So if market sentiment changes because of some news happening, the script will quickly recognize it and suggest reversal.
Please note I'm not pretending to have a crystal ball. Nobody has. The goal of this script is not to predict where EURUSD market will be, but to correctly notice that is has reversed. Nothing else.
Sometimes the market will move towards reversal, but not cross the line yet - these are so-called HEDGING ZONES. Sometimes they turn out to be reversals and sometimes simply best places for dip entries. Ideally a trader should hedge there, because market could move either way. You might wanna apply apply knowledge of market fundamentals there or look into some micro-indicators. Anyway, it is good to realize where those zones are and this script shows them. In pink.
It is invite-only script. DM me for access.
PC-Indicator - Spar_maDeutsche Version Unterhalb.
English version:
This indicator is supposed to be another tool to recognize when a panic movement has begun and also ended. Of course, there are other indicators that work very well, but this can also help to identify the timeframe.
Description of for using the indicator with the example of the panic sell-off in March:
Before the selloff started, two areas can be identified in which the market is being tested. This is when at the same time, the price intersects with the 21 moving average and the put / call indicator. This indicates that something could be wrong (no guarantee, just an indicator). This happened first (marked with 1) when the virus was discovered: Few who had been informed had any idea what might happen. The second "drop" (marked 2) happened when it was publicly announced that such a virus existed. The third time the panic broke out (marked 3) long after the virus was known. The portfolios should have been hedged here at the latest. Shortly before the yellow marking the virus was reported daily and maximum panic were spread. This was the point at which the hedge could theoretically be ended (if you have the courage to do so). However, I myself waited until the 21st and the indicator were clearly broken.
This indicator could have helped to save a loss in value of the portfolio by at least 17%. I hope this indicator can continue to perform as well.
Please leave a like and subscribe if you are interested in further trading ideas from me.
Name of the indicator: “PC-Indicator - Spar_ma”
That’s my opinion and should be treated like it.
No trade advice!
______________________________________________________________________________________________
Deutsche Version:
Dieser Indikator soll ein weiteres Tool sein um erkennen zu können, wann eine panische Bewegung beendet ist. Natürlich gibt es weitere Indikatoren die sehr gut funktionieren, dieser kann jedoch zusätzlich dabei helfen zu erkennen wann es soweit ist.
Beschreibung des Indikators an Beispiel des Panischen sell-offs im März:
Bereits vor beginn sind zwei Bereiche zu erkennen, an denen der Markt getestet wird. Dabei kreuzen sich gleichzeitig der Kurs mit dem 21-gleitendem Durchschnitt und dem Put-/Call- Indikator. Das lässt darauf zurückführen, dass etwas kommen könnte. Dies geschah zuerst (mit 1 gekennzeichnet) bei der Entdeckung des Virus: Wenige die Informiert wahren, jedoch ahnten was passieren könnte. Der zweite „Drop“ (mit 2 gekennzeichnet) geschah als öffentlich bekannt gegeben wurde, dass ein solches Virus existiert. Beim dritten Mal brach die Panic aus (mit 3 gekennzeichnet), lange nachdem dieser Virus bekannt gewesen war. Spätestens hier sollte das Konto gehedged worden sein. Erst kurz vor der gelben Markierung wurde täglich vom Virus berichtet und maximale Panic verbreitet. Dies war der Zeitpunkt an dem theoretisch der Hedge beendet werden konnte (wenn man den Mut dazu hat). Ich selbst habe allerdings noch gewartet bis der 21ger und auch der Indikator klar durchbrochen wurde.
Dieser Indikator hätte dabei helfen können einen Wertverlust des Kontos um mindestens 17% ersparen zu können. Ich hoffe dieser Indikator kann weiterhin so gut performen.
Bitte lasst ein like da und abonniert mich, falls Ihr Interesse an weiteren trading-ideen von mir habt.
Name des Indikators: “PC-Indicator – Spar_ma”
Dies ist nur meine persönliche Meinung und sollte auch so betrachtet werden.
Dies ist keine Handelsempfehlung.

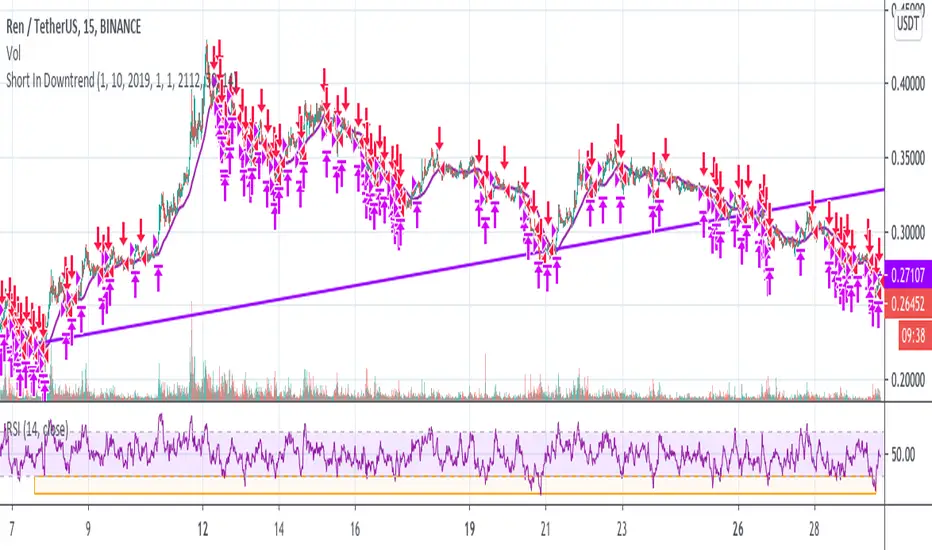
Short In Downtrend Below MA100 (Coinrule)This is a simple strategy to take advantage of downtrends. It's useful to run such a strategy as a hedge in times of market uncertainty.
The Sell Condition - Entry
The sell signal triggers when:
the coin has MA (100) greater than the price in a timeframe of 15 minutes, meaning that the coin is in a short-term downtrend.
the coin has an RSI greater than 30 in a timeframe of 15 minutes, indicating that it didn't reach oversold conditions yet, so there is still room for a further price drop.
On Coinrule, you can launch the strategy on real market conditions, setting up multiple sequential sell orders. The strategy would keep selling while the price stays below the MA(100). In that case, it's advisable to set low amounts for the sell orders. the position will grow gradually while the downtrend intensifies. Set a minimum time interval between the sell orders will also help to have control over the overall position size.
The Buy Condition - Exit
The bot connects to each trade a stop loss and a take profit. The percentages are optimized for short term trades on mid-cap coins. You can adjust the percentages depending on the specific coin you are trading. A ratio of 1:1.5 between the stop loss and the take profit could work as the strategy trades in the same direction of the trend.
Stop loss at 3% from the entry price
Take profit at 2% from the entry price
A slightly larger stop loss allows tolerating more volatility to reduce the case of stops triggering when it shouldn't.

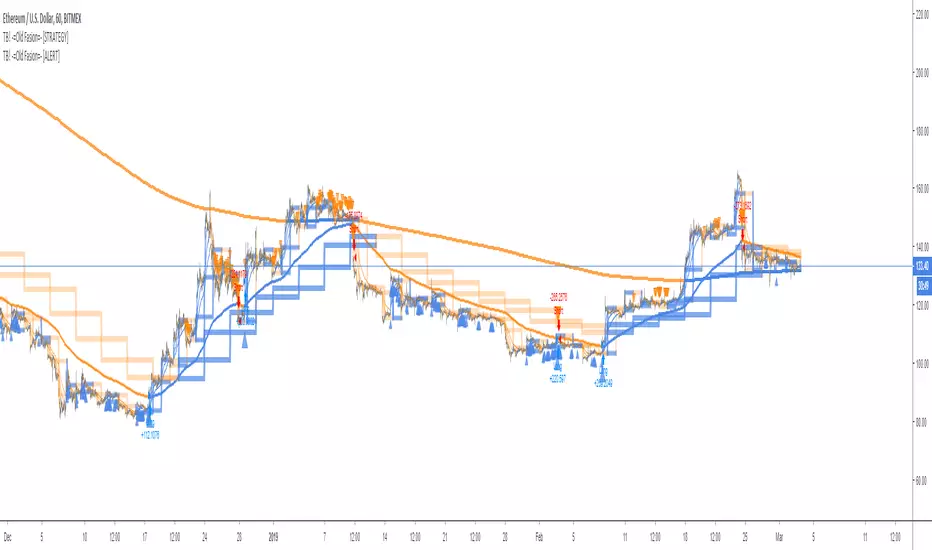
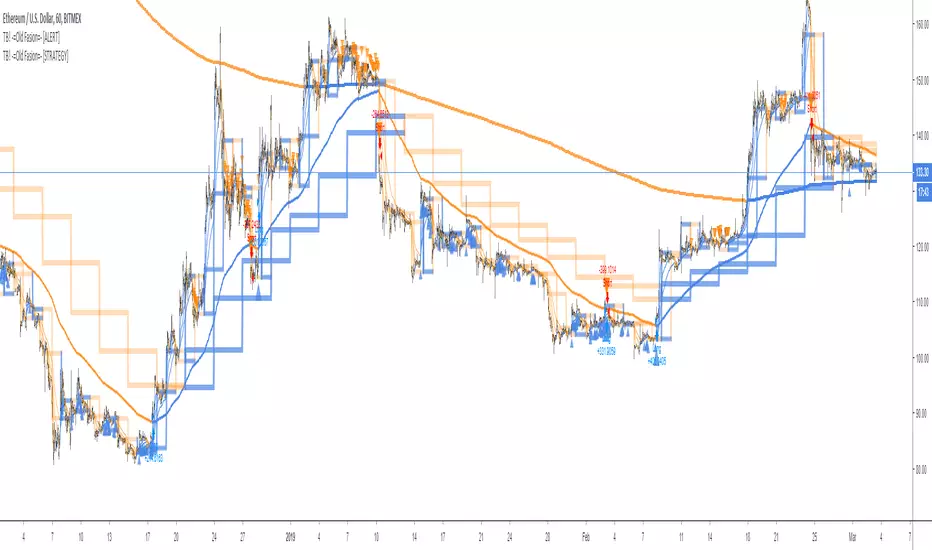
TB! -=Old Fasion=- [STRATEGY]This is the Strategy version of;
A Good Old Fasion sma/rma trading done as it should be done!
Great for hedging
- Bitfinex
- Poloniex
- Bitmex
- Deribit
No repaint, no false alerts or any other kind of nonsense.
With this strategy version you can determine the most optimal settings.
Those optimal setting you copy into the alert edition and of you go, sending alerts to GunBot, Haasbot, Dragonbot, Trexen, Autoview or whatever makes you happy.
TB! -=Old Fasion=- [ALERT]Good Old Fasion sma/rma trading done as it should be done!
Great for hedging
- Bitfinex
- Poloniex
- Bitmex
- Deribit
No repaint, no false alerts or any other kind of nonsense.
This the Alert version.
You can use it to send alerts to GunBot, Haasbot, Dragonbot, Trexen, Autoview or whatever makes you happy.