Volume Pulse [ziksfx]Volume Pulse is a clean volume indicator designed to make it easier to read meaningful changes in activity without cluttering your chart. It enhances the standard volume view by supporting both classic volume and dollar volume , highlighting spikes and extreme bars and adding a compact label on the latest bar so you always see the current volume value at a glance. The script is intended to be used in a separate volume pane.
How it works
– Supports two modes: standard volume or dollar volume (close × volume).
– Colors volume bars by candle direction (up/down). Optionally, it can:
• highlight volume spikes above a moving average;
• mark the highest-volume bar over a user-defined lookback period.
– Plots a simple moving average of volume so you can quickly see when activity is above or below typical levels.
– On the latest bar, shows a small label with the current volume value, automatically abbreviated (K / M / B) and optionally prefixed with “$” in dollar-volume mode.
Inputs & customization
– Volume type: choose between standard volume and dollar volume.
– Volume MA length: controls how sensitive the moving average is to recent changes in activity.
– Spike highlighting: optional, turns on/off coloring for bars where volume exceeds the moving average.
– Highest-volume bar lookback: sets the period for detecting the highest-volume bar.
– Label position: choose whether the last-bar label appears on the left or right side of the bar, and optionally shift it slightly above the bar for better readability.
Use cases
Use Volume Pulse to:
– Spot sudden spikes in volume and compare them to the recent average.
– Identify sessions or candles with unusually high activity relative to a chosen TF.
– Visually study how volume behaves around price moves, breakouts or potential fakeouts to better understand their strength or weakness.
– Keep track of the latest bar’s volume instantly, without having to read the raw scale values.
This indicator works on any symbol that has volume data (stocks, futures, crypto and more), but volume quality may vary between markets and instruments. It is intended as an analytical and educational tool only: it does not constitute financial advice and does not provide or guarantee any trading results. Always combine volume context with your own analysis and risk management.
Highestvolume

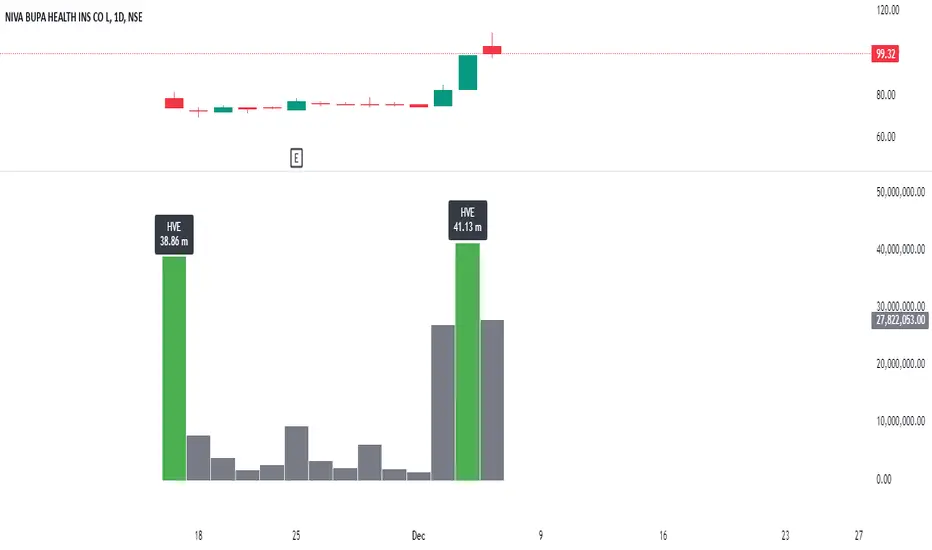
Highest Volume EverOverview:
The Highest Volume Ever (HVE) indicator highlights the highest volume bar in the visible chart history. It visually emphasizes significant volume spikes, helping traders identify key moments of market activity, such as breakout signals or accumulation phases.
Key Features:
Automatic Detection of Highest Volume:
The indicator dynamically scans the entire chart history to identify the bar with the highest trading volume, marking it with a clearly visible label.
Volume in Millions:
The label displays the highest volume in millions, providing a concise and readable format for better interpretation.
Adaptive Positioning:
The label is positioned slightly above the volume bar, ensuring it doesn't obstruct other chart elements while remaining close to the bar for easy reference.
Use Cases:
Identify Significant Market Activity: Detect periods of unusually high volume, often indicating the start of strong trends or the end of consolidations.
Confirm Breakouts: High volume often confirms the strength of breakout moves.
Spot Accumulation or Distribution: Unusually high volume can signal institutional buying or selling.
How to Use:
Add the indicator to your chart on TradingView.
The highest volume bar will be highlighted with a green bar and an "HVE" label above it.
Adjust the chart range to see how the indicator dynamically updates.
Perfect for:
Traders who rely on volume analysis to confirm price movements and detect significant market events.
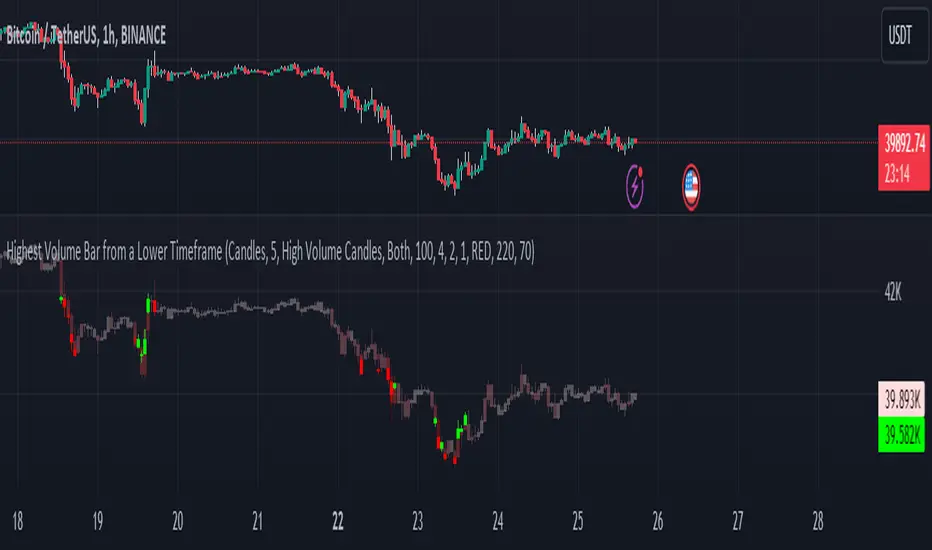
Highest Volume Bar from a Lower TimeframeVolume is an essential indicator in technical analysis as it can signal confirmations of movement, reversals, and more. This indicator was developed to identify candles with high volume in both the current timeframe and a lower timeframe
SETTINGS
The indicator has two display modes: Candles and Volume.
- Candles: it presents a traditional candlestick chart that shows the candles of the current timeframe, along with the candle with the highest volume from the lower timeframe.
- Volume: it features a volume chart displaying the volume of the current timeframe in histogram form, as well as the bar with the highest volume from the lower timeframe represented in columns.
LOWER TIME FRAME SETTINGS
- Lower Time Frame: the lower timeframe to be taken into consideration.
- LTF Candle Display: determines which candles from the current timeframe chart will display the candles with the highest volume from the lower timeframe.
- Volume Display: determines how the volume bars will be presented for both the current timeframe and the lower timeframe.
VOLUME LEVEL SETTINGS
- SMA Period: the time period for calculating the volume average.
- High Volume: the multiplier used to classify a candle as having high volume.
- Medium Volume: the multiplier used to classify a candle as having medium volume.
- Low Volume: the multiplier used to classify a candle as having low volume.
- Show Volume MA: enable this option to display the Volume MA on the chart.
COLOR SETTINGS
- Candle Color: the color to be used in the charts.
- Shade Intensity : the intensity of the shades for volume levels.
- Transparency : the transparency to be used for the candles of the current timeframe when displaying candles with higher volume from the lower timeframe.
Ross Givens VolumeVolume is probably the most overlooked indicator by new traders. The buying and selling activity of large funds and institutions is the main driver of stock prices, and recognizing this activity is crucial to identifying future price movements.
This script has several elements not found in standard volume indicators:
POCKET PIVOTS
Pocket Pivots are the work of Gil Morales and Chris Kacher - authors of "Trade Line an O'Neil Disciple."
A pocket pivot is an up day with volume that is greater than the highest down volume day of the last 10 down days. These are also referred to as "10-day pocket pivots ."
A pocket pivot is not a buy signal by itself. But this is a constructive sign for a stock coming out of a base or wedging pattern. When a stock is trading in a tight consolidation range and then breaks out above resistance to a new high, I like to see a pocket pivot to give confirmation for the move.
VOLUME MOVING AVERAGE
There is a simple moving average applied to the volume chart. By default, it is set to a period of 50.
This line is a quick way to see how much volume a stock sees on average and whether or not the current volume is above or below that level. The moving average is white by default, so you will want to change the color if your charts have a light background.
HIGHEST UP VOLUME IN A YEAR
When a stock sees its highest up volume in a year or more, this is a strong indication of heavy institutional buying. This script looks back at the last 252 daily candles (there are 252 trading days in a year) and paints the candle fucshia if it has the highest up day volume over that period.
The color and time period can be changed in the settings. Volume on down days are not factored into the equation since we are only looking for the heaviest buying day of the last year.
NOTE: This feature will only display on a daily chart.
UP/DOWN VOLUME RATIO
The up/down volume ratio compares up versus down volume . Specifically, it calculates the total volume on advancing days vs the total volume on declining days over the last 50 sessions.
The ratio is displayed in a small table in the upper right corner of the volume indicator panel. A ratio above 1.0 is a bullish sign and will paint the cell green, while a ratio below 1.0 will paint red as a bearish signal.
AVERAGE $ VOLUME
Another cell in the upper right corner of the indicator displays the average daily trading volume in dollars. This is simply the average daily volume multiplied by the price of the stock.
The Average $ Volume will quickly tell you how much money trades through a stock in a given day. Investors trading larger size can see if the stock is too thin to handle their usual position size.
VOLUME COLORS
- Pocket pivots are BRIGHT GREEN
- Regular up volume days are GREEN
- Down volume days are RED
You have the option to change these colors in the settings. You can also toggle on or off the Moving Average, Pocket Pivots , Highest Volume Up Day, U/D ratio, and Avg $ Vol.
Please leave any questions you have in the comment section and I will do my best to answer them.
