Macros ICT KillZones [TradingFinder] Times & Price Trading Setup🔵 Introduction
ICT Macros, developed by Michael Huddleston, also known as ICT (Inner Circle Trader), is a powerful trading tool designed to help traders identify the best trading opportunities during key time intervals like the London and New York trading sessions.
For traders aiming to capitalize on market volatility, liquidity shifts, and Fair Value Gaps (FVG), understanding and using these critical time zones can significantly improve trading outcomes.
In today’s highly competitive financial markets, identifying the moments when the market is seeking buy-side or sell-side liquidity, or filling price imbalances, is essential for maximizing profitability.
The ICT Macros indicator is built on the renowned ICT time and price theory, which enables traders to track and leverage key market dynamics such as breaks of highs and lows, imbalances, and liquidity hunts.
This indicator automatically detects crucial market times and optimizes strategies for traders by highlighting the specific moments when price movements are most likely to occur. A standout feature of ICT Macros is its automatic adjustment for Daylight Saving Time (DST), ensuring that traders remain synced with the correct session times.
This means you can rely on accurate market timing without the need for manual updates, allowing you to focus on capturing profitable trades during critical timeframes.
🔵 How to Use
The ICT Macros indicator helps you capitalize on trading opportunities during key market moments, particularly when the market is breaking highs or lows, filling Fair Value Gaps (FVG), or addressing imbalances. This indicator is particularly beneficial for traders who seek to identify liquidity, market volatility, and price imbalances.
🟣 Sessions
London Sessions
London Macro 1 :
UTC Time : 06:33 to 07:00
New York Time : 02:33 to 03:00
London Macro 2 :
UTC Time : 08:03 to 08:30
New York Time : 04:03 to 04:30
New York Sessions
New York Macro AM 1 :
UTC Time : 12:50 to 13:10
New York Time : 08:50 to 09:10
New York Macro AM 2 :
UTC Time : 13:50 to 14:10
New York Time : 09:50 to 10:10
New York Macro AM 3 :
UTC Time : 14:50 to 15:10
New York Time : 10:50 to 11:10
New York Lunch Macro :
UTC Time : 15:50 to 16:10
New York Time : 11:50 to 12:10
New York PM Macro :
UTC Time : 17:10 to 17:40
New York Time : 13:10 to 13:40
New York Last Hour Macro :
UTC Time : 19:15 to 19:45
New York Time : 15:15 to 15:45
These time intervals adjust automatically based on Daylight Saving Time (DST), helping traders to enter or exit trades during key market moments when price volatility is high.
Below are the main applications of this tool and how to incorporate it into your trading strategies :
🟣 Combining ICT Macros with Trading Strategies
The ICT Macros indicator can easily be used in conjunction with various trading strategies. Two well-known strategies that can be combined with this indicator include:
ICT 2022 Trading Model : This model is designed based on identifying market liquidity, structural price changes, and Fair Value Gaps (FVG). By using ICT Macros, you can identify the key time intervals when the market is seeking liquidity, filling imbalances, or breaking through important highs and lows, allowing you to enter or exit trades at the right moment.
Silver Bullet Strategy : This strategy, which is built around liquidity hunting and rapid price movements, can work more accurately with the help of ICT Macros. The indicator pinpoints precise liquidity times, helping traders take advantage of market shifts caused by filling Fair Value Gaps or correcting imbalances.
🟣 Capitalizing on Price Volatility During Key Times
Large market algorithms often seek liquidity or fill Fair Value Gaps (FVG) during the intervals marked by ICT Macros. These periods are when price volatility increases, and traders can use these moments to enter or exit trades.
For example, if sell-side liquidity is drained and the market fills an imbalance, the price might move toward buy-side liquidity. By identifying these moments, which may also involve breaking a previous high or low, you can leverage rapid market fluctuations to your advantage.
🟣 Identifying Liquidity and Price Imbalances
One of the important uses of ICT Macros is identifying points where the market is seeking liquidity and correcting imbalances. You can determine high or low liquidity levels in the market before each ICT Macro, as well as Fair Value Gaps (FVG) and price imbalances that need to be filled, using them to adjust your trading strategy. This capability allows you to manage trades based on liquidity shifts or imbalance corrections without needing a bias toward a specific direction.
🔵 Settings
The ICT Macros indicator offers various customization options, allowing users to tailor it to their specific needs. Below are the main settings:
Time Zone Mode : You can select one of the following options to define how time is displayed:
UTC : For traders who need to work with Universal Time.
Session Local Time : The local time corresponding to the London or New York markets.
Your Time Zone : You can specify your own time zone (e.g., "UTC-4:00").
Your Time Zone : If you choose "Your Time Zone," you can set your specific time zone. By default, this is set to UTC-4:00.
Show Range Time : This option allows you to display the time range of each session on the chart. If enabled, the exact start and end times of each interval are shown.
Show or Hide Time Ranges : Toggle on/off for visual clarity depending on user preference.
Custom Colors : Set distinct colors for each session, allowing users to personalize their chart based on their trading style.These settings allow you to adjust the key time intervals of each trading session to your preference and customize the time format according to your own needs.
🔵 Conclusion
The ICT Macros indicator is a powerful tool for traders, helping them to identify key time intervals where the market seeks liquidity or fills Fair Value Gaps (FVG), corrects imbalances, and breaks highs or lows. This tool is especially valuable for traders using liquidity-based strategies such as ICT 2022 or Silver Bullet.
One of the key features of this indicator is its support for Daylight Saving Time (DST), ensuring you are always in sync with the correct trading session timings without manual adjustments. This is particularly beneficial for traders operating across different time zones.
With ICT Macros, you can capitalize on crucial market opportunities during sensitive times, take advantage of imbalances, and enhance your trading strategies based on market volatility, liquidity shifts, and Fair Value Gaps.
Ictconcepts

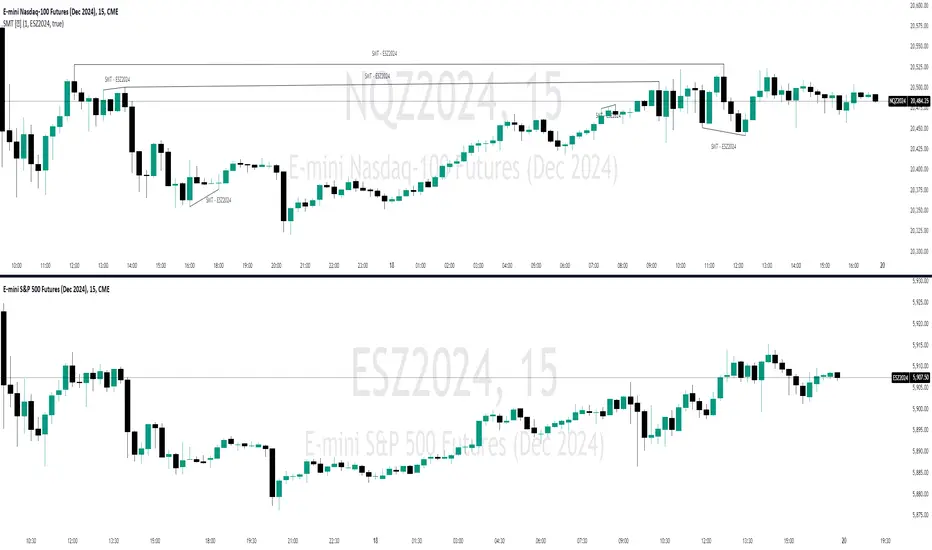
SMT Divergences [OutOfOptions]Smart Money Technique (SMT) Divergence is designed to identify discrepancies between correlated assets within the same timeframe. It occurs when two related assets exhibit opposing signals, such as one forming a higher low while the other forms a lower low. This technique is particularly useful for anticipating market shifts or reversals before they become evident through other Premium Discount (PD) Arrays.
This indicator works by identifying the highs and lows that have formed for an asset on the current chart and the correlated symbol defined in the settings. Once a pivot on either asset is formed, it checks if the pivot has taken liquidity as identified by the previous pivot in the same direction (i.e., a new high taking out a previous high). If this is the case and the corresponding asset has not taken a similar pivot, the condition is determined to be a potential valid divergence. The indicator will then filter out SMTs formed by adjacent candles, requiring at least one candle difference between the candles forming the SMT.
If the “Candle Direction Validation” setting is enabled, the indicator will further check both assets to ensure that for bullish SMTs, the last high on both assets was formed by down candle, and for bearish SMTs, the low was formed by an up candle. This check can often eliminate low-probability SMTs that are frequently broken.
The referenced chart shows divergence between Nasdaq (NQ) and S&P 500 (ES) futures, which are normally closely correlated assets that move in the same direction. The lines shown represent bullish and bearish divergences between the two when they are formed. As you can see from the chart, SMT Divergences may not always indicate a reversal, or a reversal might be just a short-term retrace. Therefore, SMT Divergences should not be used independently. However, in conjunction with other PD arrays, they can provide strong confirmation of a change in market direction.
Configurability:
Pivot strength - Indicates how many bars to the left/right of a high for pivot to be considered, recommended to keep at 1 for maximum detection speed
Candle Direction Validation - Additional SMT validation to filter out weak/low-probability SMTs be examining candle direction
Line Styling for Bullish/Bearish SMTs - Ability to customize line style, color & width for bullish/bearish SMTs
Label Control - Whether or not to show SMT label and if shown what font size & color should be used
What makes this indicator different:
Unlike other SMT indicators, this indicators has additional built-in controls to remove low-probability SMTs
ICT Professional Accumulation DistributionICT Professional Accumulation Distribution (ICT AD) provides a x-ray view into market accumulation and distribution. You can literally see the institutions at work.
The indicator consists of two cumulative lines derived from:
Cumulative change from open to close
Cumulative change from previous close to new open
By overlaying these two cumulative lines, you can detect real meaningful divergence that is narrative based not mathematically derived. You're seeing the real works of algorithms in play working in this area.
These divergences are only useful at extremes (topping or bottoming formations), not while trending. It will probably confirm your suspicion about making a important high or low.
This works on all timeframes but is most impactful on the daily.
How to use:
Method 1:
Enable the option for "Show Open vs Close."
Calculate the shift by subtracting the "Open vs Close" line value from the ICT Accumulation/Distribution (AD) line value.
Look for divergences between the two cumulative lines.
Method 2:
Switch the chart's display mode to "Line View" (representing the Open vs Close).
look for divergences between the line chart and the ICT AD line.

Candle Range Theory | Flux Charts💎 GENERAL OVERVIEW
Introducing our new Candle Range Theory Indicator! This powerful tool offers a strategy built around the Candle Range Theory, which analyzes market movements through the relative size and structure of price candles. For more information about the process, check the "HOW DOES IT WORK" section.
Features of the new Candle Range Theory Indicator :
Implementation of the Candle Range Theory
FVG & Order Block Entry Methods
2 Different TP / SL Methods
Customizable Execution Settings
Customizable Backtesting Dashboard
Alerts for Buy, Sell, TP & SL Signals
📌 HOW DOES IT WORK ?
The Candle Range Theory (CRT) indicator operates by identifying significant price movements through the relative size and structure of candlesticks. A key part of the strategy is determining large candles based on their range compared to the Average True Range (ATR) in a higher timeframe. Once identified, a breakout of either the high wick or the low wick of the large candle is required. This breakout is considered a liquidity grab. After that, the indicator waits for confirmation through Fair Value Gaps (FVGs) or Order Blocks (OBs). The confirmation structure must be the opposite direction of the breakout, for example if the high wick is broken, a bearish FVG is required for the short entry. After a confirmation signal is received, the indicator will trigger entry points based on your chosen entry method (FVG or OB), and exit points will be calculated using either a dynamic ATR-based TP/SL method or fixed percentages. Alerts for Buy, Sell, Take-Proft, and Stop-Loss are available.
🚩 UNIQUENESS
This indicator stands out because it combines two highly effective entry methods: Fair Value Gaps (FVGs) and Order Blocks (OBs). You can choose between these strategies depending on market conditions. Additionally, the dynamic TP/SL system uses the ticker's volatility to automatically calculate stop-loss and take-profit targets. The backtesting dashboard provides metrics about the performance of the indicator. You can use it to tune the settings for best use in the current tiker. The Candle Range Theory approach offers more flexibility compared to traditional indicators, allowing for better customization and control based on your risk tolerance.
⚙️ SETTINGS
1. General Configuration
Higher Timeframe: Customize the higher timeframe for analysis. Recommended combinations include M15 -> H4, H4 -> Daily, Daily -> Weekly, and Weekly -> Monthly.
HTF Candle Size: Define the size of the higher timeframe candles as Big, Normal, or Small to filter valid setups based on their range relative to ATR.
Entry Mode: Choose between FVGs and Order Blocks for your entry triggers.
Require Retracement: Enable this option if you want a retracement to the FVG or OB for entry confirmation.
Show HTF Candle Lines: Toggle to display the higher timeframe candle lines for better visual clarity.
2. Fair Value Gaps
FVG Sensitivity: You may select between Low, Normal, High or Extreme FVG detection sensitivity. This will essentially determine the size of the spotted FVGs, with lower sensitivities resulting in spotting bigger FVGs, and higher sensitivities resulting in spotting all sizes of FVGs.
3. Order Blocks
Swing Length: Swing length is used when finding order block formations. Smaller values will result in finding smaller order blocks.
4. TP / SL
TP / SL Method:
a) Dynamic: The TP / SL zones will be auto-determined by the algorithm based on the Average True Range (ATR) of the current ticker.
b) Fixed : You can adjust the exact TP / SL ratios from the settings below.
Dynamic Risk: The risk you're willing to take if "Dynamic" TP / SL Method is selected. Higher risk usually means a better winrate at the cost of losing more if the strategy fails. This setting is has a crucial effect on the performance of the indicator, as different tickers may have different volatility so the indicator may have increased performance when this setting is correctly adjusted.

Judas Swing ICT 01 [TradingFinder] New York Midnight Opening M15🔵 Introduction
The Judas Swing (ICT Judas Swing) is a trading strategy developed by Michael Huddleston, also known as Inner Circle Trader (ICT). This strategy allows traders to identify fake market moves designed by smart money to deceive retail traders.
By concentrating on market structure, price action patterns, and liquidity flows, traders can align their trades with institutional movements and avoid common pitfalls. It is particularly useful in FOREX and stock markets, helping traders identify optimal entry and exit points while minimizing risks from false breakouts.
In today's volatile markets, understanding how smart money manipulates price action across sessions such as Asia, London, and New York is essential for success. The ICT Judas Swing strategy helps traders avoid common pitfalls by focusing on key movements during the opening time and range of each session, identifying breakouts and false breakouts.
By utilizing various time frames and improving risk management, this strategy enables traders to make more informed decisions and take advantage of significant market movements.
In the Judas Swing strategy, for a bullish setup, the price first touches the high of the 15-minute range of New York midnight and then the low. After that, the price returns upward, breaks the high, and if there’s a candlestick confirmation during the pullback, a buy signal is generated.
bearish setup, the price first touches the low of the range, then the high. With the price returning downward and breaking the low, if there’s a candlestick confirmation during the pullback to the low, a sell signal is generated.
🔵 How to Use
To effectively implement the Judas Swing strategy (ICT Judas Swing) in trading, traders must first identify the price range of the 15-minute window following New York midnight. This range, consisting of highs and lows, sets the stage for the upcoming movements in the London and New York sessions.
🟣 Bullish Setup
For a bullish setup, the price first moves to touch the high of the range, then the low, before returning upward to break the high. Following this, a pullback occurs, and if a valid candlestick confirmation (such as a reversal pattern) is observed, a buy signal is generated. This confirmation could indicate the presence of smart money supporting the bullish movement.
🟣 Bearish Setup
For a bearish setup, the process is the reverse. The price first touches the low of the range, then the high. Afterward, the price moves downward again and breaks the low. A pullback follows to the broken low, and if a bearish candlestick confirmation is seen, a sell signal is generated. This confirmation signals the continuation of the downward price movement.
Using the Judas Swing strategy enables traders to avoid fake breakouts and focus on strong market confirmations. The strategy is versatile, applying to FOREX, stocks, and other financial instruments, offering optimal trading opportunities through market structure analysis and time frame synchronization.
To execute this strategy successfully, traders must combine it with effective risk management techniques such as setting appropriate stop losses and employing optimal risk-to-reward ratios. While the Judas Swing is a powerful tool for predicting price movements, traders should remember that no strategy is entirely risk-free. Proper capital management remains a critical element of long-term success.
By mastering the ICT Judas Swing strategy, traders can better identify entry and exit points and avoid common traps from fake market movements, ultimately improving their trading performance.
🔵 Setting
Opening Range : High and Low identification time range.
Extend : The time span of the dashed line.
Permit : Signal emission time range.
🔵 Conclusion
The Judas Swing strategy (ICT Judas Swing) is a powerful tool in technical analysis that helps traders identify fake moves and align their trades with institutional actions, reducing risk and enhancing their ability to capitalize on market opportunities.
By leveraging key levels such as range highs and lows, fake breakouts, and candlestick confirmations, traders can enter trades with more precision. This strategy is applicable in forex, stocks, and other financial markets and, with proper risk management, can lead to consistent trading success.

Flat Tops/Bottoms aka Devil's MarkThis Pine script indicator is designed to visually depict price inefficiencies, as identified by Flat Top/Bottom Candles (aka Devil's Mark). A Flat Top/Bottom Candle is a scenario where there is an absence of a wick at the top or the bottom of the candle. These represent zones of inefficiency and will frequently act as magnets for price that the market will strive to rebalance in accordance with ICT principles.
Relevance:
Flat Top/Bottom Candles are zones where price delivery didn't provide opportunity for manipulation representing an inefficiency that the market will seek to rebalance. Consequently, these zones can provide good targets for entries in the opposite direction or take profit targets for previous entries in the direction of the Flat Top/Bottom Candle.
How It Works:
The indicator keeps track of all Flat Top/Bottom Candles from the beginning of the available history. It automatically removes all mitigated Flat Top/Bottom Candles, which are situations where the price has gone past the candle without a wick.
Configurability:
You can configure the colors, style & width of the lines used to represent flat top/bottom candles.
What makes this indicator different:
Designed with high performance in mind, to reduce impact on chart render time.
Only keeping the currently valid flat top/bottoms on the chart.

Price Action Analyst [OmegaTools]Price Action Analyst (PAA) is an advanced trading tool designed to assist traders in identifying key price action structures such as order blocks, market structure shifts, liquidity grabs, and imbalances. With its fully customizable settings, the script offers both novice and experienced traders insights into potential market movements by visually highlighting premium/discount zones, breakout signals, and significant price levels.
This script utilizes complex logic to determine significant price action patterns and provides dynamic tools to spot strong market trends, liquidity pools, and imbalances across different timeframes. It also integrates an internal backtesting function to evaluate win rates based on price interactions with supply and demand zones.
The script combines multiple analysis techniques, including market structure shifts, order block detection, fair value gaps (FVG), and ICT bias detection, to provide a comprehensive and holistic market view.
Key Features:
Order Block Detection: Automatically detects order blocks based on price action and strength analysis, highlighting potential support/resistance zones.
Market Structure Analysis: Tracks internal and external market structure changes with gradient color-coded visuals.
Liquidity Grabs & Breakouts: Detects potential liquidity grab and breakout areas with volume confirmation.
Fair Value Gaps (FVG): Identifies bullish and bearish FVGs based on historical price action and threshold calculations.
ICT Bias: Integrates ICT bias analysis, dynamically adjusting based on higher-timeframe analysis.
Supply and Demand Zones: Highlights supply and demand zones using customizable colors and thresholds, adjusting dynamically based on market conditions.
Trend Lines: Automatically draws trend lines based on significant price pivots, extending them dynamically over time.
Backtesting: Internal backtesting engine to calculate the win rate of signals generated within supply and demand zones.
Percentile-Based Pricing: Plots key percentile price levels to visualize premium, fair, and discount pricing zones.
High Customizability: Offers extensive user input options for adjusting zone detection, color schemes, and structure analysis.
User Guide:
Order Blocks: Order blocks are significant support or resistance zones where strong buyers or sellers previously entered the market. These zones are detected based on pivot points and engulfing price action. The strength of each block is determined by momentum, volume, and liquidity confirmations.
Demand Zones: Displayed in shades of blue based on their strength. The darker the color, the stronger the zone.
Supply Zones: Displayed in shades of red based on their strength. These zones highlight potential resistance areas.
The zones will dynamically extend as long as they remain valid. Users can set a maximum number of order blocks to be displayed.
Market Structure: Market structure is classified into internal and external shifts. A bullish or bearish market structure break (MSB) occurs when the price moves past a previous high or low. This script tracks these breaks and plots them using a gradient color scheme:
Internal Structure: Short-term market structure, highlighting smaller movements.
External Structure: Long-term market shifts, typically more significant.
Users can choose how they want the structure to be visualized through the "Market Structure" setting, choosing from different visual methods.
Liquidity Grabs: The script identifies liquidity grabs (false breakouts designed to trap traders) by monitoring price action around highs and lows of previous bars. These are represented by diamond shapes:
Liquidity Buy: Displayed below bars when a liquidity grab occurs near a low.
Liquidity Sell: Displayed above bars when a liquidity grab occurs near a high.
Breakouts: Breakouts are detected based on strong price momentum beyond key levels:
Breakout Buy: Triggered when the price closes above the highest point of the past 20 bars with confirmation from volume and range expansion.
Breakout Sell: Triggered when the price closes below the lowest point of the past 20 bars, again with volume and range confirmation.
Fair Value Gaps (FVG): Fair value gaps (FVGs) are periods where the price moves too quickly, leaving an unbalanced market condition. The script identifies these gaps:
Bullish FVG: When there is a gap between the low of two previous bars and the high of a recent bar.
Bearish FVG: When a gap occurs between the high of two previous bars and the low of the recent bar.
FVGs are color-coded and can be filtered by their size to focus on more significant gaps.
ICT Bias: The script integrates the ICT methodology by offering an auto-calculated higher-timeframe bias:
Long Bias: Suggests the market is in an uptrend based on higher timeframe analysis.
Short Bias: Indicates a downtrend.
Neutral Bias: Suggests no clear directional bias.
Trend Lines: Automatic trend lines are drawn based on significant pivot highs and lows. These lines will dynamically adjust based on price movement. Users can control the number of trend lines displayed and extend them over time to track developing trends.
Percentile Pricing: The script also plots the 25th percentile (discount zone), 75th percentile (premium zone), and a fair value price. This helps identify whether the current price is overbought (premium) or oversold (discount).
Customization:
Zone Strength Filter: Users can set a minimum strength threshold for order blocks to be displayed.
Color Customization: Users can choose colors for demand and supply zones, market structure, breakouts, and FVGs.
Dynamic Zone Management: The script allows zones to be deleted after a certain number of bars or dynamically adjusts zones based on recent price action.
Max Zone Count: Limits the number of supply and demand zones shown on the chart to maintain clarity.
Backtesting & Win Rate: The script includes a backtesting engine to calculate the percentage of respect on the interaction between price and demand/supply zones. Results are displayed in a table at the bottom of the chart, showing the percentage rating for both long and short zones. Please note that this is not a win rate of a simulated strategy, it simply is a measure to understand if the current assets tends to respect more supply or demand zones.
How to Use:
Load the script onto your chart. The default settings are optimized for identifying key price action zones and structure on intraday charts of liquid assets.
Customize the settings according to your strategy. For example, adjust the "Max Orderblocks" and "Strength Filter" to focus on more significant price action areas.
Monitor the liquidity grabs, breakouts, and FVGs for potential trade opportunities.
Use the bias and market structure analysis to align your trades with the prevailing market trend.
Refer to the backtesting win rates to evaluate the effectiveness of the zones in your trading.
Terms & Conditions:
By using this script, you agree to the following terms:
Educational Purposes Only: This script is provided for informational and educational purposes and does not constitute financial advice. Use at your own risk.
No Warranty: The script is provided "as-is" without any guarantees or warranties regarding its accuracy or completeness. The creator is not responsible for any losses incurred from the use of this tool.
Open-Source License: This script is open-source and may be modified or redistributed in accordance with the TradingView open-source license. Proper credit to the original creator, OmegaTools, must be maintained in any derivative works.

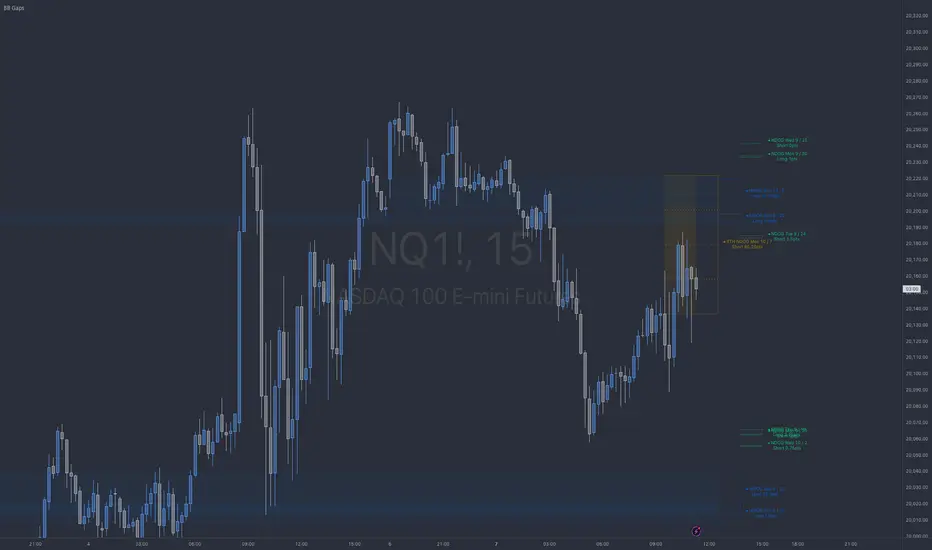
Premium & Discount Delta Volume [BigBeluga]Premium & Discount Delta Volume is an advanced volume-based tool that helps traders identify zones of market imbalances by using the concepts of premium and discount pricing, commonly taught by ICT trader. It calculates and highlights periods where the market is trading at a premium (selling pressure is stronger) or a discount (buying pressure is stronger) and dynamically plots these zones over time. The indicator also calculates delta volume between buying and selling within these zones, showing shifts in market sentiment and potential areas for reversals or continuations.
🔵 IDEA
The Premium & Discount Delta Volume indicator is rooted in the ICT (Inner Circle Trader) concept of premium and discount zones. This concept divides the price action into two key zones:
Premium Zone : This area is where the market is trading at a level where sellers dominate, leading to more selling pressure. The idea is that the price is overvalued, and a potential drop could occur as the market reverts to a balanced state.
Discount Zone : This area is where the market is undervalued, with buyers dominating and applying upward pressure. Prices in this area often indicate opportunities to buy into strength as the market moves back to equilibrium.
At the core of the indicator is the delta volume, which measures the difference between buying and selling pressure within the premium and discount zones. When the delta volume is negative, it signals a downtrend with more selling pressure, while a positive delta volume signals an uptrend with more buying pressure. These zones and their associated delta values update dynamically, providing traders with real-time insights into market strength and potential price reversals.
The equilibrium in the middle of the premium and discount zones represents the balance point between buyers and sellers. When price moves away from equilibrium, it either enters the premium zone (potentially overbought) or the discount zone (potentially oversold), helping traders make more informed decisions based on volume and price structure.
🔵 KEY FEATURES & USAGE
Premium & Discount Zones:
The indicator automatically identifies and plots premium and discount zones on the chart. Premium zones count only negative (selling) volume, while discount zones count only positive (buying) volume. These zones are key areas of interest for identifying potential price reversals or continuations based on volume pressure.
Dynamic Delta Volume Calculation:
The indicator calculates delta volume between the premium and discount zones, showing the imbalance between buyers and sellers. A positive delta volume inside the discount zone suggests strong buying pressure, while a negative delta inside the premium zone suggests strong selling pressure. This helps traders quickly identify trends or market exhaustion.
Up Trend:
Down Trend:
Real-time Updates & Equilibrium Line:
The zones update dynamically every 100 bars or after price crosses them, ensuring that traders always have the most relevant market data. The equilibrium line in the middle of the zones helps traders gauge whether the market is balanced or moving into overbought (premium) or oversold (discount) territory.
Macro and Local Period Calculations:
The indicator allows traders to customize two different periods for analysis: a smaller lookback period (e.g., 50 bars) for short-term price action and a macro period (e.g., 200 bars) for larger trends. Each period has its own premium and discount zones, allowing for a multi-timeframe view of market strength.
Macro:
Both:
Color-coded background for Volume Pressure:
The background color of the smaller period premium and discount box changes based on delta volume. A positive delta turns the background blue, indicating higher buy pressure, while a negative delta turns the background red, signaling higher sell pressure.
🔵 CUSTOMIZATION
Toggle Premium & Discount: Traders can choose to display support and resistance levels based on the high and low points of the premium and discount zones.
Premium & Discount Lookback Period: Traders can adjust the lookback period to define the length of price action to be analyzed for premium and discount zones. A shorter period focuses on more recent market activity, while a longer period provides a broader view of trends.
Macro Highs/Lows Period: The indicator also offers a macro lookback period for identifying larger market trends and key levels of buying or selling volume.
Toggle Macro Levels: Macro levels help identify long-term price extremes, and traders can toggle this feature on or off as needed.

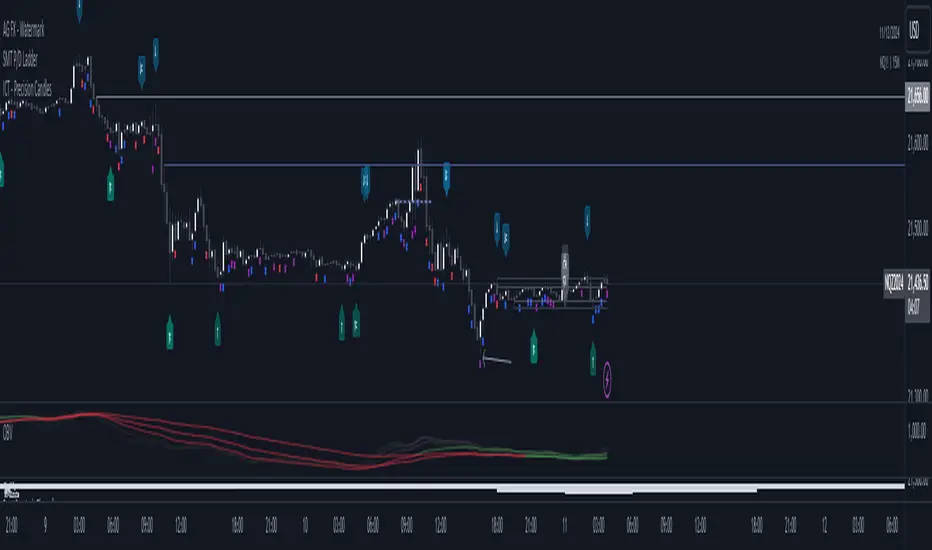
BB NWOG - NDOG - RTH NDOGThe BB Gaps Indicator is a comprehensive tool designed for traders looking to track and visualize significant opening gaps within various market sessions, including:
• New Day Opening Gaps (NDOGs): These gaps form between the closing price of the previous day and the opening price of the new day, providing insight into potential liquidity pools or imbalances.
• RTH New Day Opening Gaps (RTH NDOGs): This focuses on gaps that occur during Regular Trading Hours (RTH), capturing gaps between session closures and the next day’s open, ideal for intraday traders.
• New Week Opening Gaps (NWOGs): These gaps track the price differential between the last candle of the week and the first candle of the new trading week, providing a broader market perspective for swing traders.
Key Features:
• Dynamic Plotting: Visualize gaps with customizable extensions, box fills, and mid-range (50%) or quarter-range (25%, 75%) levels.
• Sidecar Labels: Handy sidecar labels display the gap information right on the chart for easy reference.
• Multiple Session Support: Track gaps across different trading sessions (Daily, RTH, Weekly) with adjustable plot extensions and fill styles.
• Configurable Limits: Set a maximum number of gaps to plot, ensuring your chart remains clean and clutter-free.
ICT Judas Swing | Flux Charts💎 GENERAL OVERVIEW
Introducing our new ICT Judas Swing Indicator! This indicator is built around the ICT's "Judas Swing" strategy. The strategy looks for a liquidity grab around NY 9:30 session and a Fair Value Gap for entry confirmation. For more information about the process, check the "HOW DOES IT WORK" section.
Features of the new ICT Judas Swing :
Implementation of ICT's Judas Swing Strategy
2 Different TP / SL Methods
Customizable Execution Settings
Customizable Backtesting Dashboard
Alerts for Buy, Sell, TP & SL Signals
📌 HOW DOES IT WORK ?
The strategy begins by identifying the New York session from 9:30 to 9:45 and marking recent liquidity zones. These liquidity zones are determined by locating high and low pivot points: buyside liquidity zones are identified using high pivots that haven't been invalidated, while sellside liquidity zones are found using low pivots. A break of either buyside or sellside liquidity must occur during the 9:30-9:45 session, which is interpreted as a liquidity grab by smart money. The strategy assumes that after this liquidity grab, the price will reverse and move in the opposite direction. For entry confirmation, a fair value gap (FVG) in the opposite direction of the liquidity grab is required. A buyside liquidity grab calls for a bearish FVG, while a sellside grab requires a bullish FVG. Based on the type of FVG—bullish for buys and bearish for sells—the indicator will then generate a Buy or Sell signal.
After the Buy or Sell signal, the indicator immediately draws the take-profit (TP) and stop-loss (SL) targets. The indicator has three different TP & SL modes, explained in the "Settings" section of this write-up.
You can set up alerts for entry and TP & SL signals, and also check the current performance of the indicator and adjust the settings accordingly to the current ticker using the backtesting dashboard.
🚩 UNIQUENESS
This indicator is an all-in-one suit for the ICT's Judas Swing concept. It's capable of plotting the strategy, giving signals, a backtesting dashboard and alerts feature. Different and customizable algorithm modes will help the trader fine-tune the indicator for the asset they are currently trading. Three different TP / SL modes are available to suit your needs. The backtesting dashboard allows you to see how your settings perform in the current ticker. You can also set up alerts to get informed when the strategy is executable for different tickers.
⚙️ SETTINGS
1. General Configuration
Swing Length -> The swing length for pivot detection. Higher settings will result in
FVG Detection Sensitivity -> You may select between Low, Normal, High or Extreme FVG detection sensitivity. This will essentially determine the size of the spotted FVGs, with lower sensitivies resulting in spotting bigger FVGs, and higher sensitivies resulting in spotting all sizes of FVGs.
2. TP / SL
TP / SL Method ->
a) Dynamic: The TP / SL zones will be auto-determined by the algorithm based on the Average True Range (ATR) of the current ticker.
b) Fixed : You can adjust the exact TP / SL ratios from the settings below.
Dynamic Risk -> The risk you're willing to take if "Dynamic" TP / SL Method is selected. Higher risk usually means a better winrate at the cost of losing more if the strategy fails. This setting is has a crucial effect on the performance of the indicator, as different tickers may have different volatility so the indicator may have increased performance when this setting is correctly adjusted.

ICT CheckListCredit to the owner of this script "TalesOfTrader"
The Awakening Checklist indicator is a tool designed to help traders evaluate certain key market conditions and elements before making trading decisions. It consists of a series of questions that the trader must answer using the options "Yes", "No" or "N/A" (not applicable).
“Has Asia Session ended?” : This question aims to determine if the Asian trading session has ended. The answer to this question can influence trading strategies depending on market conditions.
“Have you identified potential medium induction?” : This question concerns the identification of potential average inductions on the market. Recognizing these inductions can help traders anticipate future price movements.
"Have you identified potential PoI's": This question asks about the identification of potential points of interest on the market. These points of interest can indicate areas of significant support or resistance.
"Have you identified in which direction they are creating lQ?" : This question aims to determine in which direction market participants create liquidity (lQ). Understanding this dynamic can help make informed trade decisions.
“Have they induced Asia Range”: This question concerns the induction of the Asian range by market participants. Recognizing this induction can be important in assessing future price movements.
“Have you had a medium induction”: This question asks about the presence of a medium induction on the market. The answer to this question can influence trading prospects.
“Do you have a BoS away from the induction”: This question aims to find out if the trader has an offer (BoS) far from the identified induction. This can be a risk management strategy.
"Doas your induction PoI have imbalance": This question concerns the imbalance of points of interest (PoI) linked to induction. Recognizing this imbalance can help anticipate price movements.
“Do you have a valid target in mind”: This question aims to find out if the trader has a clear trading objective in mind. Having a goal can help guide trading decisions and manage risk.

[TTM] ICT Key Levels🌟 Overview 🌟
This tool highlights key price levels, such as highs, lows, and session opens, that can influence market moves. Based on ICT concepts, these levels help traders spot potential areas for market reversals or trend continuations.
🌟 Key Levels 🌟
🔹 Week Open (00:00 EST)
Marks the start of the trading week. This level helps track price direction and is useful for framing the Weekly candle formation using ICT’s Power of 3.
🔹 Midnight Open (00:00 EST)
The Midnight Open (MNOP) marks the start of the new trading day. Price often retraces to this level for liquidity grabs, setting up larger moves in the daily trend. It's also key for framing the Daily Power of 3 and spotting possible market manipulation.
🔹 New York Stock Exchange Open (09:30 EST)
The NYSE Open is a major liquidity event, where price seeks liquidity from earlier in the day, like stop hunts or retracements to the London or Midnight Open. This time often brings reversals or trend continuations as volatility increases.
🔹 Previous Day High/Low
These levels show where liquidity rests, often serving as targets for price revisits, ideal for reversals or continuation trades.
🔹 Previous Week High/Low
Similar to daily levels but on a larger scale. They help identify swing trades and track broader market trends.
🔹 Previous Month High/Low
These monthly levels are important for long-term traders, as price often aims to clear them before setting new trends or market cycles.
Happy Trading!
TheTickMagnet

HTF Inversion Fair Value Gap | Flux Charts💎 GENERAL OVERVIEW
Introducing our new Higher Timeframe Inversion Fair Value Gaps (IFVG) indicator! Inversion Fair Value Gaps occur when a Fair Value Gap becomes invalidated. They reverse the role of the original Fair Value Gap, making a bullish zone bearish and vice versa. This indicator finds the latest IFVG in a higher timeframe and renders it in the current chart with it's divergence. For more information about the process, read the "HOW DOES IT WORK" section of the description.
Features of the new Higher Timeframe IFVG Indicator :
Renders The Higher Timeframe IFVG
Invalidation Borders
Variety Of Zone Detection / Sensitivity / Filtering / Invalidation Settings
High Customizability
🚩 UNIQUENESS
This indicator lets you take a look at the bigger picture by rendering the latest IFVG in a higher timeframe. You can see the current IFVG divergence to see how is the price action acting around the IFVG. You also can customize the FVG Filtering method, FVG & IFVG Zone Invalidation, Detection Sensitivity etc. according to your needs to get the best performance from the indicator.
📌 HOW DOES IT WORK ?
A Fair Value Gap generally occur when there is an imbalance in the market. They can be detected by specific formations within the chart. An Inversion Fair Value Gap is when a FVG becomes invalidated, thus reversing the direction of the FVG.
This indicator then renders the IFVG in a higher timeframe in your chart like this :
The opaque dashed lines at the top and the bottom of the IFVG indicate the bars that formed the original FVG. The middle dashed line that is semi-transparent shows the candlestick that invalidated the original FVG, thus created the current IFVG. The vertical solid top & bottom wicks indicate the current divergence of the highest & lowest points to the current IFVG.
The IFVGs can act as strong support & resistance points, depending on their creation volume and invalidation volume. Traders can use them for confirmation signals to their positions.
⚙️ SETTINGS
1. General Configuration
Higher Timeframe -> The higher timeframe to detect latest IFVG from. Keep in mind that his setting must be higher than the current timeframe.
IFVG Zone Invalidation -> Select between Wick & Close price for IFVG Zone Invalidation.
2. Fair Value Gaps
FVG Zone Invalidation -> Select between Wick & Close price for FVG Zone Invalidation.
Zone Filtering -> With "Average Range" selected, algorithm will find FVG zones in comparison with average range of last bars in the chart. With the "Volume Threshold" option, you may select a Volume Threshold % to spot FVGs with a larger total volume than average.
FVG Detection -> With the "Same Type" option, all 3 bars that formed the FVG should be the same type. (Bullish / Bearish). If the "All" option is selected, bar types may vary between Bullish / Bearish.
Detection Sensitivity -> You may select between Low, Normal or High FVG detection sensitivity. This will essentially determine the size of the spotted FVGs, with lower sensitivities resulting in spotting bigger FVGs, and higher sensitivities resulting in spotting all sizes of FVGs.
3. Dasboard
You can enable / disable the mitigation dashboard and customize it here.
4. Customization
Offset -> The number of candlesticks the IFVG will be rendered to the right of the latest bar.
Width -> The width of the rendered IFVG in candlesticks.

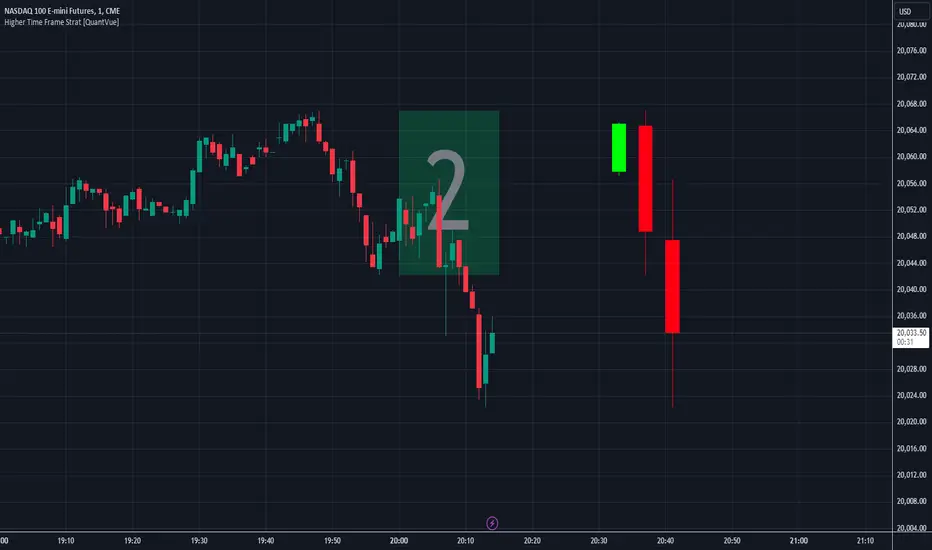
Higher Time Frame Strat [QuantVue]The Higher Time Frame Strat Indicator is a tool that helps traders visualize and analyze price action from a higher timeframe (HTF) on their current chart. It applies the Strat method, a trading strategy focused on identifying key price action setups by observing how current price bars relate to previous ones. This helps in understanding the market's structure and determining potential trading opportunities based on higher timeframe data.
Key Concepts:
Strat Basics:
Type 1 Bar (Inside Bar): The current bar's high is lower than the previous bar's high, and its low is higher than the previous bar's low. This signifies a consolidation, or indecision, as the price is contained within the previous bar's range.
Type 2 Bar (Directional Bar): The current bar either breaks above the previous bar's high (bullish) or stays above the previous bar's low (bearish), indicating a continuation in the price direction.
Type 3 Bar (Outside Bar): The current bar breaks both above the previous bar's high and below the previous bar's low, showing volatility and a potential reversal.
Higher Timeframe Visualization:
The indicator uses a user-defined higher timeframe (default: 1 hour) and plots the last three higher timeframe candles on the current chart.
Strat Classification:
When a new higher timeframe candle forms, the indicator draws a semi-transparent box around the candle's range (high to low), along with the Strat type label. This provides a visual cue to the trader about the structure of the newly formed candle and how it fits into the overall market movement.
The script classifies each higher timeframe candle as one of the Strat types (1, 2, or 3). Based on the relationship between the current candle and the previous candle's high/low, it assigns a label ("1", "2", or "3"), helping traders quickly identify the price action setup on the higher timeframe.
How to Use the Indicator:
Trend Continuation: Look for Type 2 bars, which indicate a continuation in the current trend. For example, a Type 2 up suggests the price is breaking above the previous high, potentially signaling further upward movement.
Reversals: Type 3 bars show increased volatility, where the price breaks both above and below the previous bar's range. This could indicate a reversal, so be prepared for a potential change in direction.
Consolidation: Inside bars (Type 1) signify a tightening range and can signal the beginning of a breakout once the price moves outside of the previous bar's high or low.
By combining these price action concepts with the visualization of higher timeframe data, traders can potentially get earlier entry and exits as a higher timeframe set up forms.
Time and Price Lines and Zones (fadi)
Draw a red line starting from the open at 9:30
Show dotted lines between 11 and 12 and shade it
Mark the ORB high and low from 9:30 to 10:00 and extend it in orange and shade it
In trading, time and price are two crucial elements that help traders make decisions about buying and selling assets like stocks, commodities, or currencies. Forex or futures traders may prefer to trade during the Asia, London, and New York sessions to increase the probability of price moves. Additionally, traders often focus on key levels on the chart to frame their trades.
The Time and Price Lines and Zones indicator allows traders to set an unlimited number of time- and price-based levels on a chart, with full control over how they are displayed. Traders can simply type in their desired settings, and the indicator will interpret the instructions and plot the levels on the chart.
However, as it is a scripted tool, there are some limitations, and traders should keep their inputs relatively straightforward.
How It Works
In the settings, you type in the time and price levels you'd like to see, along with the timeframes for display. Each new line will render a line, a set of lines, or a price zone within a specific time interval. You can specify starting and ending times, price levels such as highs and lows, and details like color, line style, and thickness.
The following are some settings you can use:
Time
Always required, formatted as 0 to 23 for hours (with 0 representing midnight) and 0 to 59 for minutes. You can specify just a start time or both start and end times to "box" a period.
Examples:
1 ( for 1:00 AM)
13 (for 1:00 PM)
13:50 (for 1:50 PM)
Price
Optional. If no price level is provided, the indicator will treat it as an open time window and draw vertical lines at the specified time intervals.
Color
The indicator recognizes the 17 built-in colors from TradingView ( www.tradingview.com ). You also have the option to override or create your own colors to match your color schema under settings. Silver (light gray) is the default if none is specified.
Line Style
There are three available line styles:
Solid (default)
Dashed
Dotted
Line Thickness
Line thickness can also be controlled with the following options:
Thin (default)
Medium
Thick
Fill or No Fill
When specifying two price levels, or two time periods, you can choose to keep the area between them empty or fill it with a semitransparent color. You can set this by specifying "shade," "shaded," "fill," or "filled."
Extend or Not
There are times, such as with the Open Range Breakout (ORB), where you may want to extend the zone without tracking additional price level changes. You can indicate this by specifying whether you want to extend it or not.
Additional Indicator Settings
Ignore lines that start with a defined character to instruct the indicator to ignore the line. For example, if you want to hide a line without deleting it, add # in front of it (default is #).
Hide Above Will hide all lines and zones above a defined timeframe.
Show Next Area Hours in Advance This will plot lines in advance to the right of the current price action, helping traders recognize upcoming points of interest.
Show Last X Days This controls the clutter on the screen by limiting the display to the most recent X number of days.
Fill Transparency The percentage of transparency applied to the background when a fill is specified.
Examples:
12 to 13 gray area shaded with dotted lines
Will result in two vertical lines, one at 12 noon and one at 1 PM, with the area between them shaded gray and a dotted line style.
0:00 vertical line red solid
Adds one vertical red line at midnight.
By specifying the open, high, low, and/or close price components, the indicator will interpret this as an instruction to draw a horizontal line at the specified price level. If two or more price levels are provided, each will be tracked accordingly.
Draw a red line starting from 0 open
Draws a line starting from midnight open until the end of the trading day.
Track high and low starting from 9:30 in a dashed green medium line
Tracks the day’s high and low, adjusting as new highs and lows are drawn in a dashed thicker green line from 9:30 AM until the end of trading hours.
# Asia
20 to 0 green high to low filled
# London
2:00 to 5 blue low and high filled
#New York
8:30 to 11:30 orange zone shaded orange between the high and low dotted
Adds three ICT Kill Zones for Asia, London, and New York based on their respective high and low.
8:30 to 11:30 orange zone shaded orange open close dotted
Will add a second New York zone overlapping the high and low zone.
#Draw Open Range Breakout (ORB)
9:30 to 10:00 purple extended zone
Extends the zone from 9:30 to 10:00 AM with a purple extended zone.

ICT HTF FVGs v2 (fadi)NOTICE: Instead of updating the existing ICT HTF FVGs indicator, this indicator is being published separately due to the requests to keep the original by some traders and because of the drastic change in behavior/configurations. If the original v1 version is more appropriate for your style of trading, feel free to continue to use it.
ICT HTF FVGs v2
In trading, Fair Value Gaps (FVGs) refer to market inefficiencies or imbalances that occur when buying and selling activities are not equal. These gaps can be identified on various timeframes and are used in different trading strategies.
FVGs are crucial in price action trading as they highlight the difference between the current market price of an asset and its fair value. Traders use these gaps to identify potential trading opportunities, as they often indicate areas where the market may correct itself
This indicator will overlap the higher timeframe (HTF) FVGS over the current timeframe to help traders anticipate and plan their trades.
Features
Up to 6 higher timeframes (HTF) can be overlayed on a chart
Traders can limit the number of HTF FVGs to preset number of HTFs
Lower and current timeframes can be included
Configurable spacing of HTF FVGs to prevent overlapping
Configurable Smart Expansion of FVGs based on proximity to current price
Traders can decide what constitutes a Mitigated FVG
Show or hide mitigated FVGs to declutter the chart
Flexible display settings that controls how the FVGs are displayed
Flexible labeling of the FVG levels and content
Higher Timeframes Display Settings
This indicator provides the ability to select up to 6 HTF intervals. These intervals are based on the trader's timeframes including any custom timeframes.
Timeframe Configurations
Enable or Disable a Timeframe
The Timeframe to Display
Bullish / BISI FVG Color
Bearish / SIBI FVG Color
The number of FVGs For The Selected Timeframe
Limit to the next HTFs only can be used to display the selected number of HTF FVGs. For example, if the trader selects 3 then only 3 HTF FVGs will be displayed.
Note: If either of the next two options is selected, they will take up spots from this count.
Hide lower Timeframes restricts the FVGs to higher timeframes only. If this option is disabled, it will show lower timeframes FVGs as well.
Hide Current Timeframe removes current timeframe from the selected list of HTF FVGs. If this option is disabled, it will show current timeframe FVGs as well.
Background Transparency Enable or disable the background color (shaded area) of the FVG. If it is enabled, it will set the transparency amount. The higher the value, the more transparent the background.
Extend lines controls when and how to extend the FVG levels. There are three options:
Extension Only extends the FVGs by the specified number provided below only.
Current Candle Plus Extension extends all the FVGs beyond the current candle by the number provided below.
When in Range will only extend the FVGs near current price based on the advanced settings below. This setting will use Average True Range multiplier to calculate the range (shows FVGs that are higher or lower by the average candle size multiplied by the number in Advanced section).
Mitigated shows or hides the mitigated HTF FVGs. A FVG is considered mitigated based on one of the following options:
None will ignore mitigation and show all FVGs.
Touched when a HTF FVG is touched regardless of how deep the price get inside the FVG.
Wick filled the FVG is closed by a wick or body of a candle.
Body filled the FVG is closed by the body of a candle
Wick filled half a candle's wick or body has reached the C.E. of the FVG
Body filled half a candle body has reached the C.E. of the FVG
Extend mitigated lines sets the number of candles to extend the mitigated FVG levels by for better visibility.
Important Note: Mitigation is calculated based on the timeframe of the FVG, not current timeframe.
Display
Display settings focus on how the FVGs will be displayed. The trader is in total control and there are multiple ways to overlay FVGs on the chart.
Open / Close / C.E. / Link controls the borders. Traders can enable or disable any of them as well as set the thickness and style. Link is the right border.
C.E. also offers the option of setting the bullish (BISI) and bearish (SIBI) colors of the C.E. level
Labeling controls if the labels should be displayed next to the FVG, their color, background, and font size.
Label levels to display controls which levels to show. Open, High. or the C.E.
Label display content controls what to show in the labels, the timeframe of the label, is it a BISI or a SIBI, and a label to indicate if it is the Open or the Close.
Note: if the distance between the open and close has the potential of overlapping the labels, then the indicator will only show the C.E. label for visual clarity.
Advanced Settings
Advanced settings controls some internal calculations:
Proximity factor based on daily range used to calculate possible range of FVGs within a day's range to keep the chart clean. The higher the value, the more FVGs will be shown.
Combine labels factor for visibility used to calculate the distance between the open and close and if all the labels or only the C.E. should be displayed. The higher the value, the bigger the distance for combination (smaller numbers will show more labels).
Range should be within X candles used when "When in Range" option is selected. This is the ATR multiplier used to extend the FVGs. The higher the number, the more FVGs will be extended.
Once desired settings have been achieved, the settings can be saved as default from the bottom left of the indicator settings page for future use.

ICT Asian Range and KillzonesThis TradingView indicator highlights key trading sessions and their price ranges on a chart. It identifies the Asian Range and the Killzones for both the London Open and New York Open sessions. Here’s a brief breakdown:
Asian Range:
Defines the high and low price levels during the Asian trading session (between the specified start and end hours, default 00:00 to 04:00 UTC).
Plots horizontal lines to mark the highest and lowest prices reached during the Asian session.
Adds labels showing the values of these high and low points after the session ends.
London and New York Killzones:
Identifies the “Killzones” or key trading windows for the London Open (default 06:00 to 09:00 UTC) and the New York Open (default 11:00 to 14:00 UTC).
Tracks the high and low price levels within these windows and plots rectangles ("boxes") on the chart to visualize these ranges.
The boxes are color-coded and customizable, indicating potential areas of high market activity or volatility.
Customizable Visuals:
Users can adjust the colors, border widths, and other visual properties for better clarity and chart integration.

Change in State of Delivery CISD ICT [TradingFinder] Liquidity 1🔵 Introduction
🟣 What is CISD ?
Change in State of Delivery (CISD) is a key concept in technical analysis, similar to Change of Character (ChoCh) and Market Structure Shift (MSS) in the ICT (Inner Circle Trader) and Smart Money trading styles. Like ChoCh and MSS, CISD helps traders identify critical changes in market structure and make timely entries into trades.
To determine the CISD Level, traders typically review the last 1 to 4 candles to identify the first positive or negative candle. The CISD Level is then set using the opening price of the next candle.
In this version of the indicator, support and resistance levels are defined based on liquidity, which includes patterns such as SFP (Swing Failure Pattern), fake breakout, and false breakout.
Bullish CISD :
Bearish CISD :
🔵 How to Use
🟣 Bullish CISD (Change in State of Delivery Upward)
In Bullish CISD, the trend shifts from bearish to bullish after the price hits a liquidity zone, typically indicated by patterns such as SFP, fake breakout, or false breakout.
The steps to identify Bullish CISD are as follow s:
Identify the liquidity zone (SFP, fake breakout).
Review the candles and find the first positive candle.
Set the CISD Level using the opening price of the next candle after the positive candle.
Confirm the change in state of delivery when the price closes above the CISD Level.
Enter the trade after CISD confirmation.
🟣 Bearish CISD (Change in State of Delivery Downward)
In Bearish CISD, the trader looks for a shift from a bullish to a bearish trend. This change typically occurs when the price hits a liquidity level, indicated by patterns such as SFP or false breakout.
The steps to identify Bearish CISD are :
Identify the liquidity zone.
Review the candles and find the first negative candle.
Set the CISD Level using the opening price of the next candle after the negative candle.
Confirm the change in state of delivery when the price closes below the CISD Level.
Enter a short trade after CISD confirmation.
🟣 CISD Compared to ChoCh and MSS (CISD Vs ChoCh/ MSS)
CISD, ChoCh, and MSS are all tools for identifying trend changes in the market, but they have some differences :
CISD: Focuses on a change in the state of delivery and uses liquidity patterns (SFP, fake breakout) and key candles to confirm trend reversals.
ChoCh: Identifies a change in the market’s character, often signaling rapid shifts in trend direction.
MSS: Focuses on changes in market structure and identifies the breaking of key levels as a signal of trend shifts.
🔵 Settings
🟣 CISD Logical settings
Bar Back Check : Determining the return of candles to identify the CISD level.
CISD Level Validity : CISD level validity period based on the number of candles.
🟣 SFP Logical settings
Swing period : You can set the swing detection period.
Max Swing Back Method : It is in two modes "All" and "Custom". If it is in "All" mode, it will check all swings, and if it is in "Custom" mode, it will check the swings to the extent you determine.
Max Swing Back : You can set the number of swings that will go back for checking.
🟣 CISD Display settings
Displaying or not displaying swings and setting the color of labels and lines.
🟣 SFP Display settings
Displaying or not displaying swings and setting the color of labels and lines.
🔵 Conclusion
CISD is a powerful tool for identifying trend reversals using liquidity patterns and key candle analysis. Traders can use the CISD Level to detect trend changes and find optimal entry and exit points.
This concept is similar to ChoCh and MSS but stands out with its focus on confirming trend changes through liquidity and specific patterns. With the right approach, CISD helps traders capitalize on market movements more effectively.

ICT Time Levels Description:
The Time Levels Indicator is designed to enhance trading decisions by marking significant price levels at key times throughout the trading day. This indicator specifically focuses on three crucial times: 8:30 AM, 9:30 AM, and 10:00 AM (UTC-4), which are often associated with significant market movements.
Key Features:
Customizable Time Levels: Users can toggle the display of price levels at 8:30 AM, 9:30 AM, and 10:00 AM. Each level is marked with a line on the chart, which helps traders visually identify these critical points.
Style and Color Options: Customize the appearance of each time level with different line styles (solid, dotted, dashed) and colors to match your chart preferences.
Dynamic Labeling: The indicator automatically places a label at the current price level for each time, making it easier to identify and track these levels as the day progresses.
Real-Time Updates: As the trading session unfolds, the indicator adjusts the lines and labels to reflect the latest price data at the specified times.
How It Works:
At the specified times (8:30 AM, 9:30 AM, and 10:00 AM), the indicator captures the opening price and plots a horizontal line at that level.
These lines serve as reference points, helping traders to observe how the price interacts with these key levels throughout the day.
The lines and labels are fully customizable, allowing users to adapt the indicator to their trading style and visual preferences.
Use Cases:
Market Open Strategies: Traders can use the 9:30 AM level to monitor the opening price of the New York Stock Exchange (NYSE), which often sets the tone for the trading session.
Morning Volatility: The 8:30 AM and 10:00 AM levels can be useful for identifying potential support and resistance levels during periods of increased volatility, such as economic data releases or after the market opens.
This indicator is particularly useful for intraday traders who focus on morning trading sessions and want to have a clear visual reference to guide their decisions.
Note: This script is designed to be simple yet effective, providing traders with essential information without cluttering the chart.

CRT IndicatorCandle Range Trading (CRT) Indicator
The CRT Indicator identifies potential trading opportunities by analyzing specific candlestick patterns. This script is designed to detect both bullish and bearish CRT patterns and provides visual cues directly on your chart.
Features:
Pattern Detection:
Analyzes two consecutive candles to identify the CRT pattern.
Detects both bullish and bearish setups based on the relative positions of the candles.
How It Works:
Bearish CRT Pattern:
The script identifies a bearish CRT when:
The first candle is bullish (closing price is higher than the opening price).
The second candle is bearish (closing price is lower than the opening price).
The second candle’s high exceeds the high of the first candle.
The closing price of the second candle falls within the range of the first candle.
Bullish CRT Pattern:
The script identifies a bullish CRT when:
The first candle is bearish (closing price is lower than the opening price).
The second candle is bullish (closing price is higher than the opening price).
The second candle’s low is below the low of the first candle.
The closing price of the second candle falls within the range of the first candle.
Visual Signals:
A red triangle is plotted above the candles for a bearish CRT pattern.
A green triangle is plotted below the candles for a bullish CRT pattern.
How to Use:
Monitor the chart for the appearance of red and green triangles.
Green triangles suggest potential bullish movements.
Red triangles suggest potential bearish movements.
Use these signals as part of a comprehensive trading strategy and combine with other technical indicators for best results.
Settings:
This indicator operates with default settings for detecting CRT patterns and does not include customizable parameters.
Limitations:
The CRT Indicator is based on two consecutive candles and does not account for broader market trends or other indicators.
Be aware that false signals may occur in volatile or choppy market conditions.
The indicator does not provide entry points, profit targets, or stop loss levels, which should be managed based on individual risk tolerance and strategy.
Note: The CRT Indicator is for informational purposes only and should be used in conjunction with other forms of analysis and proper risk management. Always test any strategy thoroughly before applying it to live trading.

Precision CandlesThis Pine Script is designed to help you uncover hidden divergences among multiple assets by tracking how their candles close. Imagine you're analyzing three different assets — they could be indices, currencies, or even cryptocurrencies — and you want to know when one of them is moving out of sync with the others. That’s where this script comes into play.
First, it gives you the flexibility to choose custom ticker symbols or rely on predefined ones based on different asset classes like metals, bonds, or altcoins. Once the symbols are set, the script continuously monitors the opening, high, low, and closing prices of each asset.
The magic happens when it determines the nature of each candle: is it bullish or bearish? By comparing these closing behaviors, the script checks for any discrepancies — situations where at least one asset diverges from the trend of the others. When this happens, the script plots a red "PC" marker below the bar on your chart, drawing your attention to these moments of divergence.
This tool can be invaluable for traders looking to spot unique market dynamics, identify potential trading opportunities, or simply get insights into how different assets behave in relation to each other. It's a simple but powerful way to keep an eye on correlations and anticipate shifts in market sentiment.
ICT Unicorn | Flux Charts💎 GENERAL OVERVIEW
Introducing our new ICT Unicorn Indicator! This indicator is built around the ICT's "Unicorn" strategy. The strategy uses Breaker Blocks and Fair Value Gaps for entry confirmation. For more information about the process, check the "HOW DOES IT WORK" section.
Features of the new ICT Unicorn Indicator :
Implementation of ICT's Unicorn Strategy
Toggleable Retracement Entry Method
3 Different TP / SL Methods
Customizable Execution Settings
Customizable Backtesting Dashboard
Alerts for Buy, Sell, TP & SL Signals
📌 HOW DOES IT WORK ?
The ICT Unicorn entry model merges the concepts of Breaker Blocks and Fair Value Gaps (FVGs), offering a distinct method for identifying trade opportunities. By integrating these two elements, we can have a position entry with stop-loss and take-profit targets on the potential support & resistance zones. This model is particularly reliable for trade entry, as it combines two powerful entry techniques.
An ICT Unicorn Model consists of a FVG which is overlapping with a Breaker Block of the same type. Here is an example :
When a FVG overlaps with a Breaker Block of the same type, the indicator gives a Buy or Sell signal depending on the FVG type (Bullish & Bearish). If the "Require Retracement" option is enabled in the settings, the signals are not given immediately. Instead, the current price of the ticker will need to touch the FVG once more before the signals are given.
After the Buy or Sell signal, the indicator immediately draws the take-profit (TP) and stop-loss (SL) targets. The indicator has three different TP & SL modes, explained in the "Settings" section of this write-up.
You can set up alerts for entry and TP & SL signals, and also check the current performance of the indicator and adjust the settings accordingly to the current ticker using the backtesting dashboard.
🚩 UNIQUENESS
This indicator is an all-in-one suit for the ICT's Unicorn concept. It's capable of plotting the strategy, giving signals, a backtesting dashboard and alerts feature. Different and customizable algorithm modes will help the trader fine-tune the indicator for the asset they are currently trading. Three different TP / SL modes are available to suit your needs. The backtesting dashboard allows you to see how your settings perform in the current ticker. You can also set up alerts to get informed when the strategy is executable for different tickers.
⚙️ SETTINGS
1. General Configuration
FVG Detection Sensitivity -> You may select between Low, Normal, High or Extreme FVG detection sensitivity. This will essentially determine the size of the spotted FVGs, with lower sensitivies resulting in spotting bigger FVGs, and higher sensitivies resulting in spotting all sizes of FVGs.
Swing Length -> Swing length is used when finding order block formations. Smaller values will result in finding smaller order & breaker blocks.
Require Retracement ->
a) Disabled : The entry signal is given immediately once a FVG overlaps with a Breaker Block of the same type.
b) Enabled : The current price of the ticker will need to touch the FVG once more before the entry signal is given.
2. TP / SL
TP / SL Method ->
a) Unicorn : This is the default option. The SL will be set to the lowest low of the last 100 bars with an extra offset in a Buy signal. For Sell signals, the SL will be set to the highest high of the last 100 bars with an extra offset. The TP is then set to a value using the SL value and maintaining a risk-reward ratio.
b) Dynamic: The TP / SL zones will be auto-determined by the algorithm based on the Average True Range (ATR) of the current ticker.
c) Fixed : You can adjust the exact TP / SL ratios from the settings below.
Dynamic Risk -> The risk you're willing to take if "Dynamic" TP / SL Method is selected. Higher risk usually means a better winrate at the cost of losing more if the strategy fails. This setting is has a crucial effect on the performance of the indicator, as different tickers may have different volatility so the indicator may have increased performance when this setting is correctly adjusted.

Unicorn ICT Signals [TradingFinder] Breaker Block + FVG Zones🔵 Introduction
The "ICT Unicorn Model" trading strategy in the "Inner Circle Trader" (ICT) style is one of the well-known strategies in the world of Forex and financial market trading.
The ICT methodology was developed by Michael Huddleston and is based on technical analysis and Price Action concepts.
This style focuses specifically on interpreting price movements and identifying optimal entry and exit points in the market.
In the Unicorn strategy, traders seek points where the probability of price reversal or trend continuation is high. This strategy is primarily based on recognizing and analyzing Price Action patterns and market structure.
By understanding"ICT Unicorn Model", traders can make more informed decisions about where to enter or exit trades, thereby increasing their chances of success in the market.
🟣 Understanding the Breaker Block
A Breaker Block is a specialized form of an Order Block that changes its role after a key market level is broken. Typically, an Order Block is an area on the chart where large institutional orders are likely to be placed, providing strong support or resistance.
However, when this area is breached, and the price moves in the opposite direction, it transforms into what is known as a Breaker Block. This shift indicates a reversal in market sentiment, turning the previous support into resistance or vice versa, thereby signaling a potential trend change to traders.
🟣 The Significance of the Fair Value Gap (FVG)
The Fair Value Gap (FVG) refers to an area on a price chart where the price rapidly moves through a level, leaving behind a gap. This gap represents an imbalance between supply and demand and is often seen as a potential area for price to return and fill the gap.
These zones are crucial for traders as they can indicate future price movements, providing opportunities to enter or exit trades.
🟣 Defining the ICT Unicorn Model
When an FVG overlaps with a Breaker Block, it forms a highly significant trading area known as a Unicorn. This overlap creates an ideal zone for traders to enter the market, as it combines two powerful technical signals.
The Unicorn Model is therefore considered an optimal strategy for identifying precise entry and exit points in the financial markets.
Demand ICT Unicorn Model :
Supply ICT Unicorn Model :
🔵 How to Use
🟣 Bullish ICT Unicorn
The Bullish ICT Unicorn model is applicable when the market is in an uptrend, and traders are seeking buying opportunities.
Follow these steps to identify Bullish ICT Unicorn :
Identify the Bullish Breaker Block : Locate an area where the price moved upward after breaking an Order Block. This area now acts as a Breaker Block.
Identify the Bullish FVG : Look for a Fair Value Gap near the Breaker Block.
Confirm the Unicorn : When the Bullish Breaker Block and Bullish FVG overlap, a Bullish Unicorn is confirmed. Traders can enter a buy position when the price returns to this zone.
🟣Bearish ICT Unicorn
The Bearish ICT Unicorn model is used when the market is in a downtrend, and traders are looking for selling opportunities.
To identify Bearish ICT Unicorn, follow these steps :
Identify the Bearish Breaker Block : Find an area where the price moved downward after breaking an Order Block. This area now acts as a Breaker Block.
Identify the Bearish FVG : Check if a Fair Value Gap has formed near the Breaker Block.
Confirm the Unicorn : When the Bearish Breaker Block and Bearish FVG overlap, a Bearish Unicorn is confirmed. Traders can enter a sell position when the price returns to this zone.
🔵 Setting
🟣 Global Setting
Pivot Period of Order Blocks Detector : Enter the desired pivot period to identify the Order Block.
Order Block Validity Period (Bar) : You can specify the maximum time the Order Block remains valid based on the number of candles from the origin.
Mitigation Level Breaker Block : Determining the basic level of a Breaker Block. When the price hits the basic level, the Breaker Block due to mitigation.
Mitigation Level FVG : Determining the basic level of a FVG. When the price hits the basic level, the FVG due to mitigation.
Mitigation Level Unicorn : Determining the basic level of a Unicorn Block. When the price hits the basic level, the Unicorn Block due to mitigation.
🟣 Unicorn Block Display
Show All Unicorn Block : If it is turned off, only the last Order Block will be displayed.
Demand Unicorn Block : Show or not show and specify color.
Supply Unicorn Block : Show or not show and specify color.
🟣 Breaker Block Display
Show All Breaker Block : If it is turned off, only the last Breaker Block will be displayed.
Demand Main Breaker Block : Show or not show and specify color.
Demand Sub (Propulsion & BoS Origin) Breaker Block : Show or not show and specify color.
Supply Main Breaker Block : Show or not show and specify color.
Supply Sub (Propulsion & BoS Origin) Breaker Block : Show or not show and specify color.
🟣 Fair Value Gap Display
Show Bullish FVG : Toggles the display of demand-related boxes.
Show Bearish FVG : Toggles the display of supply-related boxes.
🟣 Logic Settings
🟣 Order Block Refinement
Refine Order Blocks : Enable or disable the refinement feature. Mode selection.
🟣 FVG Filter
FVG Filter : This refines the number of identified FVG areas based on a specified algorithm to focus on higher quality signals and reduce noise.
Types of FVG filters :
Very Aggressive Filter: Adds a condition where, for an upward FVG, the last candle's highest price must exceed the middle candle's highest price, and for a downward FVG, the last candle's lowest price must be lower than the middle candle's lowest price. This minimally filters out FVGs.
Aggressive Filter: Builds on the Very Aggressive mode by ensuring the middle candle is not too small, filtering out more FVGs.
Defensive Filter: Adds criteria regarding the size and structure of the middle candle, requiring it to have a substantial body and specific polarity conditions, filtering out a significant number of FVGs.
Very Defensive Filter: Further refines filtering by ensuring the first and third candles are not small-bodied doji candles, retaining only the highest quality signals.
🟣 Alert
Alert Name : The name of the alert you receive.
Alert ICT Unicorn Model Block Mitigation :
On / Off
Message Frequency :
This string parameter defines the announcement frequency. Choices include: "All" (activates the alert every time the function is called), "Once Per Bar" (activates the alert only on the first call within the bar), and "Once Per Bar Close" (the alert is activated only by a call at the last script execution of the real-time bar upon closing). The default setting is "Once per Bar".
Show Alert Time by Time Zone :
The date, hour, and minute you receive in alert messages can be based on any time zone you choose. For example, if you want New York time, you should enter "UTC-4". This input is set to the time zone "UTC" by default.
🔵Conclusion
The Unicorn Model in ICT, utilizing the concepts of Breaker Blocks and Fair Value Gaps, provides an effective tool for identifying entry and exit points in financial markets. By offering more precise signals, this model helps traders make better decisions and minimize trading risks.
Success in applying this model requires practice and a deep understanding of market structure, but it can significantly improve trading performance.
