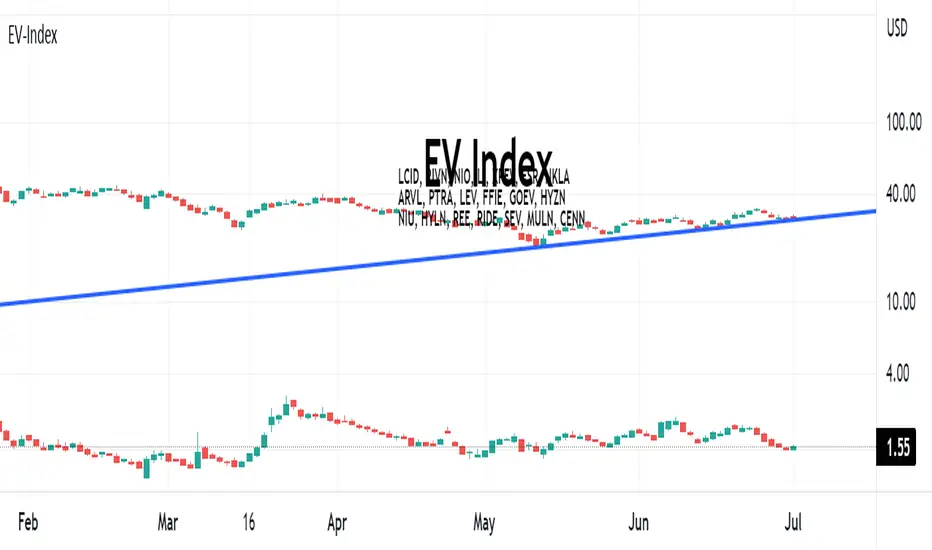
EV-IndexThis script calculates the average market cap of various EV Stocks and plots the equivalent Cenntro share price based on an outstanding share count of 261,256,205 shares. EV Stocks included in index:
LCID, RIVN, NIO, LI, XPEV, FSR, NKLA, ARVL, PTRA, LEV, FFIE, GOEV, HYZN, NIU, HYLN, REE, RIDE, SEV, MULN, CENN
Index
[Pt] Premarket Breakout StrategyThis is a 1 trade per day strategy for trading SPY or QQQ index. By default, this is designed for 1 min time frame. This was an experimental script that seems to be profitable at the time of publication.
How it works:
Pre-market high and low is defined per trading day between 9:00 to 9:30 EST.
Then we looking for the first breakout on either PM high or PM low.
- Breakout high = long trade
- Breakout low = short trade
If long trade, we wait until Stochastic RSI D signal line to hit a lower threshold (18 by default). Then we enter long when K crosses above D line.
If short trade, we wait until Stochastic RSI D signal line to hit an upper threshold (82 by default). Then we enter short when K crosses below D line.
Stop loss for long
- set to PM low if entry is above PM high + %ATR buffer
- or set to PM range + %ATR buffer
Stop loss for short
- set to PM high if entry is below PM low + %ATR buffer
- or set to PM range + %ATR buffer
Profit target is set to 2x the risk by default.
*Note: Different Stochastic RSI lengths should be used if trading 5 min time frame. See tooltip.
Happy trading~~!

Relative Volume Force IndexThis indicator can anticipate the market movements. Its posible because it calculates how much force (volume) it's necessary to move the price up or down. If it's necessary a lot of volume to move the price a little it's a reversion signal, but if a little volume could change the price whit elevate volatility, it's signal of reversion too. The indicator plots red if the market is down, and green if it's up, the size and the color of the bars cand demonstrate the movement relative force. Does it by the configurable averages. Not works well whit poor liquidity.

Nasdaq or US Composite Total VolumeBecause no NASDAQ composite index or NYSE composite index provide data volume, this script intends to use the NASDAQ Composite total volume index, index ticker : TVOLQ, or the NYSE Composite total volume index, index ticker : TVOL, as a classical volume indicator on chart.
How tu use : in the input tab choose youe prefered SMA lenght and the volume' index ticker you want to display. TVOLQ for the NASDAQ Composite total volume or TVOL for the NYSE Composite total volume.
On chart, choose to display the indicator in a new pane.

The Impossible TraderTHE IMPOSSIBLE TRADER
A simple, but effective High Freq Strategy script based on MACD or RSI trend, with extra customizable Alert Messages for Bots.
WHAT IT DOES
This script (works best at lower TimeFrames) just follow the trend of MACD or RSI on your asset.
Why it should work? Because in an upper trend, there are more chance of green candles than reds. And in dump trend there are more chance of red candles than greens.
While trend is positive, it will try to open Long orders as fast as possible at market price.
While trend is negative, it will try to open Short orders as fast as possible at market price.
HOW TO SETUP YOUR PREFERENCES
Capital : Insert a % of Margin you want to use for your positions (usually 30% is quite good)
Leverage : Choose leverage based on your plans
Trail Tick @ : This value (in Tick) tell the script "when" the "Trail Stop" order must be activated (from the Entry price)
Offset Tick @ : This is the price (in Tick) from the Trail Stop Price activated. Basically it is a Stop Loss that follow the price at a fixed distance.
SL Tick @ : Set a Stop Loss at amount Tick distance from the Entry Price. (Let's call it a Safety Stop Loss for bad decisions...)
TP Tick @ : Set a Take Profit at amount Tick distance from the Entry Price. Sometimes is better to exit in full Gain than keep positions.
Strategy : You can choose a Only Long, Only Short or Long+Short sametime strategy.
with MACD or RSI : You can try the strategy applied on MACD or applied on customizable RSI EMA
EMA : If you choosed RSI EMA, you can set any value for your testing (usually 80-120 works very nice)
Exit order after bars : Some Exchanges / Brokers apply fixed cost, and a strategy too fast could not be productive. This set will let you to delay the Exit Order on already Opened positions.
Keep Stop Loss active : If you are planning a delay for Exit Orders, sometime could be useful to keep activated Stop Loss.
Strategy Preset : Some preset I've found interesting, with good results.
BackTest Days : If there are too many results and script doesn't work, you can choose a closer range to show results.
EXTRA FEATURES
On Screen Display : OSD will show you some realtime stats about your strategy, like Asset Tick, Trading Period Range, Drawdown, Gains and not closed trade.
Alert Message : You can enter custom Long Entry/Exit and Short Entry/Exit message for your Bots (like AutoView, WunderBit, etc...). When alert is triggered, you can send custom message with {{strategy.order.comment}} in the text field
AutoView Alert Message : If you are user of AutoView, you can generate your calls. Those are tested only on Oanda with index like Sp500, US100, Us30.
TIPS ON USE
Some asset on TradingView require an higher initial capital. Go to this Script Settings -> Properties and rise Initial Capital.
Be aware of commissions and spread when evalutating a strategy. Go to this Script Settings -> Properties and set Commission and Slippage
Trail Stop and Ticks could be difficult to understand, but very profitable. Please take your time and study how it works.
Consider Tick like the minimum movement your asset can do. Ticks occurs "intra-bar", so some of your positions could be closed almost instantly.
Consider Trail Stop like a Stop Loss that keep always the same distance from your positions, but never came back . If you are in gain, say of 10 Ticks, and your Trail have 5 Ticks, this means for sure a close at minimum 5 Ticks from Entry Price.
On Screen Display will show you Ticks for your asset. This will help you on strategy settings, because not all asset responds on the same way.
ONLY LONG EXAMPLE
ONLY SHORT EXAMPLE

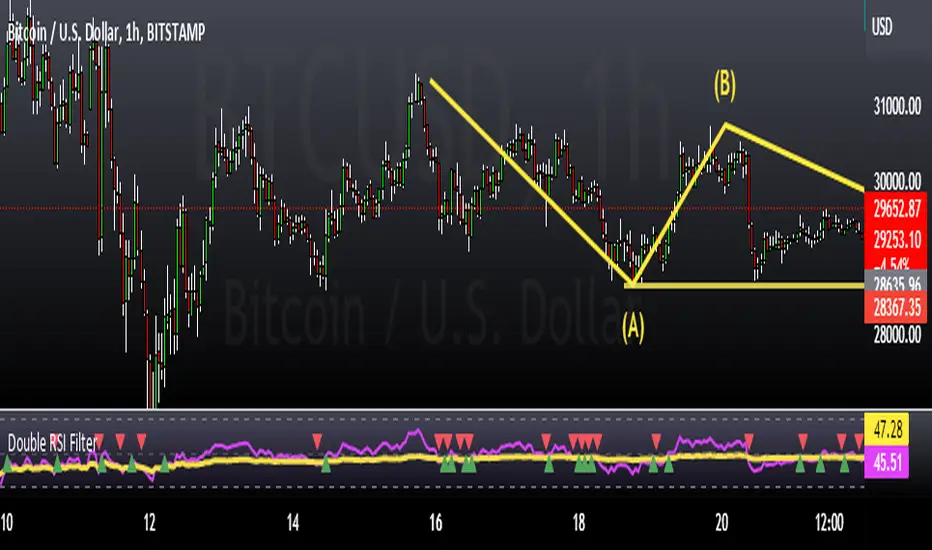
Double RSI FilterI've seen several youtubers using 2 RSI's on top of one another to filter trades for their strategies. I figured I would just code it up as an all-in-one indicator for people who have the basic package. This way they have an extra slot for another indicator if they need one and also for convenience.
Longs only when RSI 1 is above RSI 2 and shorts only when opposite. The arrows show where crosses of the RSI's occur.
Let me know if there is something else like this where it would just be very convenient to have 2 indicators on one window or other such things and I'll see if I can do something for you guys in my spare time. I'm just an amateur coder, but learning as I do more of these for people.
Thank you!
Hope this helps someone! :)
Index Reversal Range with Volatility Index or VIXWhat is the Indicator?
• The indicator is a visualization of maximum price in which the respective index can go up to in comparison with it's Volatility Index or VIX.
Who to use?
• Intraday
• Swing
• Position
• Long term Investors
• Futures
• Options
• Portfolio Managers
• Mutual Fund Managers
• Index Traders
• Volatility based Traders
• Long term Investors and Options Traders gets the maximum benefit
What timeframe to use?
• 1 Year: Position & Investors
• 6 Months: Position & Investors
• 3 Months: Swing & Position
• 1 Month: Swing & Position
• 1 Week: Swing
• 1 Day: Swing
• 1 Hour: Intraday & Swing
What are Upper and Lower lines?
• Upper Line: If the index price reach closer to the Upper line there is a high chance of reversal to Bearish trend.
• Lower Line: If the index price reach closer to the Lower line there is a high chance of reversal to Bullish trend.
• This need to be confirmed with multiple levels like Daily, Weekly, Monthly etc.
How to use?
• If the price reach closer to that level there is a high chance of reversal from the current trend.
• To identify the reversal zone of the index.
• To identify the trend.
• Option Traders can Sell a Call or Put Option from that level.
• Long term Investors, Position or Swing traders can plan for a Long entry.
• Intraday traders can use lower timeframes to do the same.
Indicator Menu
• Input VIX: Identify the VIX Symbol of your Index and type it in the box.
• For example for NIFTY Index chart type INDIAVIX in the box.
• Choose multiple timeframes according to your convenience.
How to turn on indicator Name and Value labels?
• Right side of the screen >
• Right click on the Price scale >
• Labels > Indicators and financial name labels, Indicators and financial value labels
Further Reading:
• Various videos and reading materials are available about this method.

ICT Index Futures Session LinesICT Index Futures Session Lines
Description:
The script is based on one of ICT's concepts on trading Index Futures. The script lays out the daily range from an intraday basis.
Range:
00:00 - New York Midnight
08:30 – New York Open (News events come out)
12:00/13:00 - New York Lunch (No trade time period)
13:30 - (Algorithm)
16:30 - Close
* The open, high and low lines are plotted from 00:00 to 08:30
How To Use:
You will need to check the daily bias. Prior to 8:30 you are to look for previous swing points where liquidity may exist. During the open you want to see if a high or low is taken out, and then wait for an energetic break/displacement for a potential FVG/imbalance retracement entry.
Strategy is for LTF (1 to 15m)
Default time zone is set to America/New_York (UTC New York), so lines will be plotted correctly regardless of user’s local UTC chart setting.

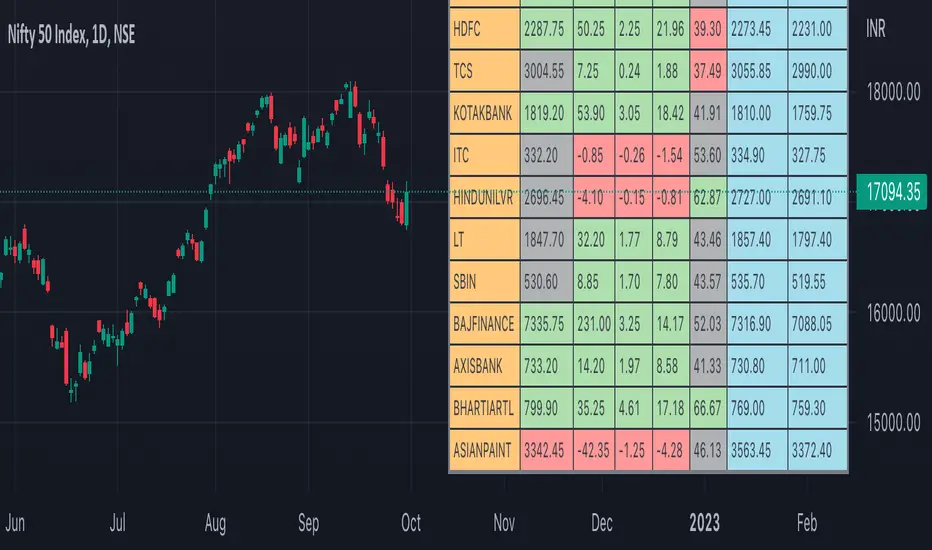
Artharjan - RSI and RSI-Moving Avg Crossover SignalsHi,
I have created "Artharjan - Index Heavy Weight Components RSI and RSI-Moving Avg Crossover Bullish/Bearish/Neutral Signal" (Short Name - ARSICROSSOVER) indicator for Traders whereby they can see the RSI and RSI Moving Average Values for Indices and Index heavyweight Components at the same time in a Dashboard.
The analysis is based on 2 different timeframes. Basically when Higher timeframe RSI is Bullish and Lower timeframe is Bearish then you enter the LONG trade when Lower Timeframe RSI shows "Bullish Reversal Signal" &
when Higher timeframe RSI is Bearish and Lower timeframe is Bullish then you enter the SHORT trade when Lower Timeframe RSI shows "Bearish Reversal Signal"
The two timeframes which I have selected by Default are Weekly (Higher timeframe) and 30 min Lower (Trade Entry) Timeframe
Also I have used to source to calculate the RSI as 5 period WMA of hlc3, if you want use raw RSI to generate crossover signals then change the source to "close" and input soothing to '1' instead of '5'
The system generates very accurate Buy and Sell Signals and when the script is range bound in its respective timeframe it shows Neutral signal
The overbought and oversold levels for Higher and Lower timeframes are set to be 60/40 and 70/30 respectively, however Traders may change these levels as per their preferences.
For intraday trades I would recommend using Higher time frame as "Daily" and Lower (Trade Entry) Timeframe as "15 min"
For Swing trades I would recommend using Higher time frame as "Weekly" and Lower (Trade Entry) Timeframe as "75 min"
For Positional trades I would recommend using Higher time frame as "Monthly" and Lower (Trade Entry) Timeframe as "Daily"
Also you can select maximum 10 Scripts at any given point in time.
My recommendation would be to use Sector Index as Script 1 and then Heavy weight components of that Sector in Script 2 to 10
This will help you to identify which Stock is responsible to pull index Up or Down and then you may decide to take either a Long Trade or Short Trade accordingly.
The Background Color and Bullish/Bearish/Neutral stages are decided based on following logic
1] If Higher timeframe RSI > Overbought Level - Stock is in a Bull Run
2] If Higher timeframe RSI > If Higher timeframe EMA of RSI = Positively Bullish
3] If Higher timeframe RSI < Oversold Level - Stock is in a Bear Run
4] If Higher timeframe RSI < If Higher timeframe EMA of RSI = Positively Bearish
5] Bulls will be said to have control if Condition 1 & 2 are true
6] Bears will be said to have control if Condition 3 & 4 are true
7] The Stock/Index will be said to be in a Neutral zone if its RSI is less than Overbought Level but greater than Oversold Level
The same rules are applicable for a Lower (Trade Entry) Timeframe
Hope you guys like this indicator and are able to make decent money by using it.
Regards
Rahul Desai
@Artharjan

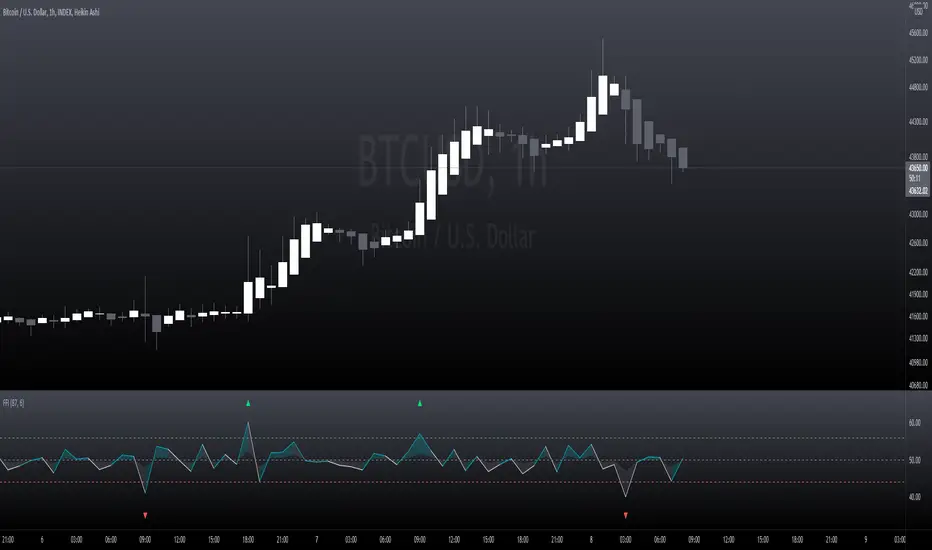
Stochastic RSI HeatmapStochastic RSI presented as a heatmap starting from the oversold (20) / overbought (80) levels respectively. The more oversold / overbought the price, the more intense the color (blue / fuchsia).

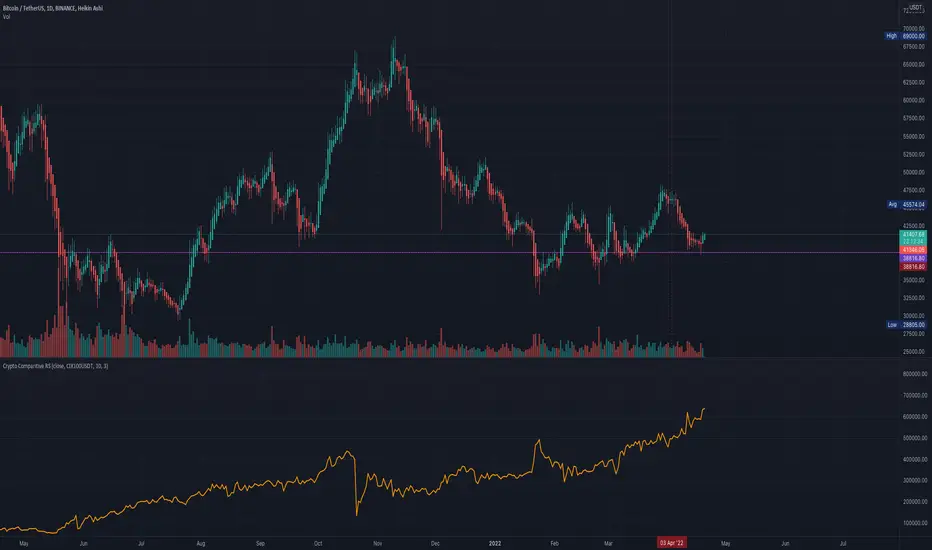
Comparative Relative Strength for Crypto (USDT/USD)Comparative Relative Strength for Crypto (USDT/USD)
An adaption of the indicator as published by © bharatTrader->
Please visit the link for details as published by the original coder.
Configured for Crypto by presetting (per filter) for CIX100 usage - either in USDT (Kucoin) or USD (Capitolcom)
Artharjan Relative StrengthHi Guys,
I have created Artharjan Relative Strength indicator which shows the comparison of a Stock (script) either with Benchmark Index or with its respective sectoral index.
If the Relative Strength value is more than Zero (Above Zero Line) then it means the Stock is outperforming the index and vise-a-versa
A moving average is also added to smooth out data series.
Traders can chose from the Benchmark/Sectoral indices as well as Moving Average Lookback period and moving average type for extra convenience.
If the Relative Strength is strong then trader can look forward to taking bullish trade and Investor can think of investing in that particular script for a long term period (Or as long as Relative Strength line does not cross below zero line)
The Default Lookback period selected is 55 (Fib number) as it covers considerable /sufficient amount of range to find out relative strength of the stock.
The Relative Strength depends on the timeframe you chose... so feel free to adjust the Lookback period from 55 to any other number depending upon your trading/investment timeframe.
Hope you guys would find this indicator useful.
Regards
Rahul Desai
@Artharjan

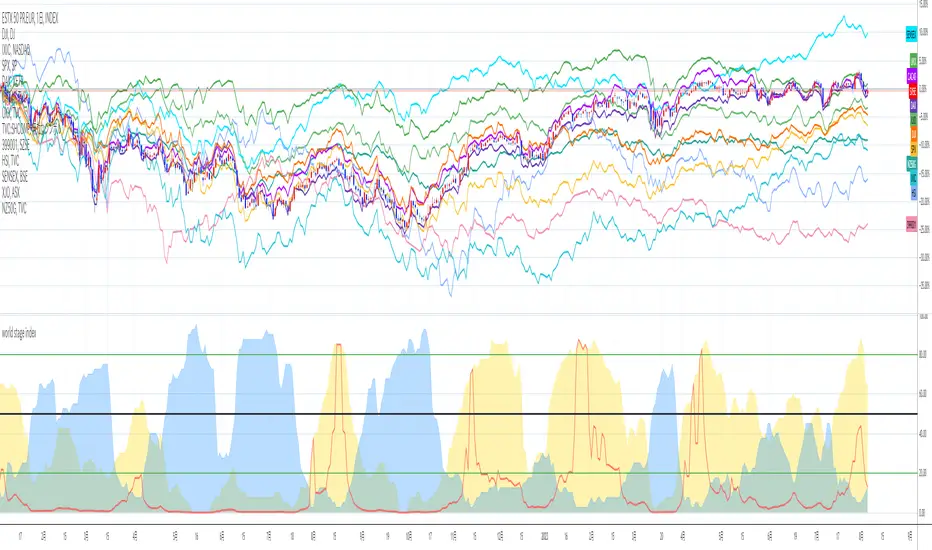
world stage index ver02This is an indicator that expresses the ratio of "stage1" and "stage4" of world index.
40 symbols are as follows
("TVC:SHCOMP" is revised to "SSE:000001")
(JAPAN, US, EUROPE, and CANADA)
OSE:NK2251!, DJ:DJI , NASDAQ:IXIC, SP:SPX , XETR:DAX, TVC:CAC40 , TVC:UKX, TSX:TSX
(ASIA)
SSE:000001, SZSE:399001, TVC:HSI, TWSE:TAIEX, BSE:SENSEX , OANDA:SG30SGD, INDEX:KSI, SET:SET
(EUROPE)
INDEX:SX5E, INDEX:FTSEMIB, SIX:SMI , BME:IBC, EURONEXT:BEL20, TVC:AEX, OMXCOP:OMXC25, XETR:0Q5X
(Pacific Ocean)
ASX:XJO, TVC:NZ50G, IDX:COMPOSITE, FTSEMYX:FBMKLCI, BMFBOVESPA:IBOV, BMV:ME , BVL:SPBLPGPT, BYMA:IMV
(Eastern Europe & Middle East)
MOEX:IMOEX, GPW:WIG20, OMXHEX:OMXH25, OMXSTO:OMXS30, DFM:DFMGI, TADAWUL:TASI, OSE:GNRI, EGX:EGX30
The criteria are as follows:
EMA5≧EMA20≧EMA40 : Stage1
EMA5≦EMA20≦EMA40 : Stage4
A.The sum of Stage1 was multiplied by 2.5 and drawn on a scale of 0 to 100, with yellow area
B.The Sum of Stage4 was multiplied by 2.5 and drawn on a scale of 0 to 100, with blue area.
C. The ratio of A/B was multiplied by 2.5 and drawn on a scale of 0 to 100, with red lines.
This idea is from Kojirou Kousi.
40 symbols of this script are partially different from Kojiro kousi's idea.
But he said the difference isn't matter.
tradingview社の上海総合指数の銘柄コード変更に合わせて、"TVC:SHCOMP" を "SSE:000001"に改訂しました。
「小次郎講師指数」に着想を得た、世界40カ国の株価指数stage状態です。
参考文献は、小次郎講師著書「世界一わかりやすい投資の勝ち方」です。
小次郎講師とは一部異なるシンボルを採用していますが、
多少の違いは余り大した問題では無いと御本人から教わった事があります。
先進国に関してはおそらくほとんど同じだと思います。
stage1の合計の%を黄色、stage4の合計の%を青色、stage1の合計/stage4の合計の%を赤で表示しています。
雰囲気で分かればいいので、正確な数字までは表示しませんでした。
個人的には現状分析以外にも、プラクティス時に世界情勢を把握するのに重宝しています。
Screener for 40+ instrumentsAs you probably know in TradingView there is a limit of 40 instruments in one custom screener.
I created a script that will allow you to scan more symbols.
The idea of it is pretty simple. You have to add a screener a few times on your screen with a different set of symbols. Then select column width (as % of your chart width) and # of the screener right to left.
Script will plot #1 screener next to the right border. For #2 and all next tables, the script will compute the needed offset and will draw it on the left. This way it will look like one table and not a few separate indicators.
I created a script with an RSI screener, but you can create more complicated examples with it.
Off course, that's not a silver bullet solution but might work for some of you.
Disclaimer
Please remember that past performance may not be indicative of future results.
Due to various factors, including changing market conditions, the strategy may no longer perform as well as in historical backtesting.
This post and the script don’t provide any financial advice.

Multi-Timeframe RSI GridThe relative strength index (RSI) is a momentum indicator that measures the magnitude of recent price changes to evaluate overbought or oversold conditions. The RSI is normally displayed as an oscillator separately from price and can have a reading from 0 to 100. This indicator displays the current RSI levels at up to 6 timeframes (of your choosing) in a grid. If the RSI levels reach overbought (above 70) or oversold (below 30) conditions, it changes the color to help you see that RSI has reached extreme levels. Note that in TradingView, when the chart is on a higher timeframe, the lower timeframe RSI levels don't calculate properly. If those conditions are met, this indicator will hide those values in the grid. If none of your selected values are available, it hides the table completely. There are configuration options, like:
Position the grid in any corner of the screen
Style customization (color, size)
Customize RSI length

Nifty / Banknifty Dashboard by RiTzNifty / Banknifty Dashboard :
Shows Values of different Indicators on current Timeframe for the selected Index & it's main constituents according to weightage in index.
customized for Nifty & Banknifty (You can customize it according to your needs for the markets/indexes you trade in)
Interpretation :-
VWAP : if LTP is trading above VWAP then Bullish else if LTP is trading below VWAP then Bearish.
ST(21,1) : if LTP is trading above Supertrend (21,1) then Bullish , else if LTP is trading below Supertrend (21,1) then Bearish.
ST(14,2) : if LTP is trading above Supertrend (14,2) then Bullish , else if LTP is trading below Supertrend (14,2) then Bearish.
ST(10,3) : if LTP is trading above Supertrend (10,3) then Bullish , else if LTP is trading below Supertrend (10,3) then Bearish.
RSI(14) : Shows value of RSI (14) for the current timeframe.
ADX : if ADX is > 75 and DI+ > DI- then "Bullish ++".
if ADX is < 75 but >50 and DI+ > DI- then "Bullish +".
if ADX is < 50 but > 25 and DI+ > DI- then "Bullish".
if ADX is above 75 and DI- > DI+ then "Bearish ++".
if ADX is < 75 but > 50 and DI- > DI+ then "Bearish+".
if ADX is < 50 but > 25 and DI- > DI+ then "Bearish".
if ADX is < 25 then "Neutral".
MACD : if MACD line is above Signal Line then "Bullish", else if MACD line is below Signal Line then "Bearish".
PDH-PDL : "< PDH > PDL" means LTP is trading between Previous Days High(PDH) & Previous Days Low(PDL) which indicates Rangebound-ness.
"> PDH" means LTP is trading above Previous Days High(PDH) which indicates Bullish-ness.
"< PDL" means LTP is trading below Previous Days Low(PDL) which indicates Bearish-ness.
Alligator : If Lips > Teeth > Jaw then Bullish.
If Lips < Teeth < Jaw then Bearish.
If Lips > Teeth and Teeth < Jaw then Neutral/Sleeping.
If Lips < Teeth and Teeth > Jaw then Neutral/Sleeping.
Settings :
Style settings :-
Dashboard Location: Location of the dashboard on the chart
Dashboard Size: Size of the dashboard on the chart
Bullish Cell Color: Select the color of cell whose value is showing Bullish-ness.
Bearish Cell Color: Select the color of cell whose value is showing Bearish-ness.
Neutral Cell Color: Select the color of cell whose value is showing Rangebound-ness.
Cell Transparency: Select Transparency of cell.
Columns Settings :-
You can select which Indicators values should be displayed/hidden.
Rows Settings :-
You can select which Stocks/Symbols values should be displayed/hidden.
Symbol Settings :-
Here you can select the Index & Stocks/Symbols
Dashboard for Index : select Nifty/Banknifty
if you select Nifty then Nifty spot, Nifty current Futures and the stocks with most weightage in Nifty index will be displayed on the Dashboard/Table.
if you select Banknifty then Banknifty spot, Banknifty current Futures and the stocks with most weightage in Banknifty index will be displayed on the Dashboard/Table.
You can Customise it according to your needs, you can choose any Symbols you want to use.
Note :- This is inspired from "RankDelta" by AsitPati and "Nifty and Bank Nifty Dashboard v2" by cvsk123 (Both these scripts are closed source!)
I'm not a pro Developer/Coder , so if there are any mistakes or any suggestions for improvements in the code then do let me know!

Fiat Flow IndexFiat Flow Index by Lysergik
This indicator compares the change in stable-coin market caps and total crypto market cap and then using those comparisons creates an index from 0 to 100.
When the index spikes and tags the upper or lower threshold levels, it is assumed that a significant inflow or outflow (respectively) of fiat in the crypto space has occurred.
Note: The data of this indicator is independent of price action. It looks only at total market cap and stablecoin market caps to derive its data points.
FX Mini-Day/Index Dividers V2This is a combination of the Mini-Day Separator Indicator, timings based off the research by Tom Henstridge/@LiquiditySniper and additional Index KZ delineations, based on ICT's 2022 Youtube Mentorship.
*It borrows some minor code from Enricoamato997 . Credit where it is due!
This is a joint effort by myself, @vbwilkes / Offseason Vince and @Tom_FOREX / TraderTom on the Index/Index Future portion.
Index Future Example
Forex Example

TPTR_Dynamic_Ratio_CorrelatorThe script provides a way to compute ratio between two indexes (or stocks) of your choice, and paints a "up-arrow" below the first candle where and when the value of the ratio exceeds your threshold of choice.
It also creates a table summarizing the value of your securities, and the value of the ratio below.
The script will also alert you with a message (automatically) when the ratio of your security_1 and security_2 exceeds the ratio.

M5 Index Alert V1.3
M5 Index Indicator
*Browse down, find "Add to favorite Indicators ", then open your Tradingview chart and apply the indicator.
This script is being used on 5 minute (5M) charts for Indices such as:
EUROPE:
- DE30EUR - DAX 40
- UK100GBP - FTSE 100
AUSTRALIA: (AUS)
- AU200AUD - ASX 200
UNITED STATES (USA):
NAS100USD - NASDAQ 100
SPX500USD - SP500
US30USD - Dow Jones / Wall Street Index
Additionally you can use it on any other Index, as well as on Gold (XAUUSD).
LOGIC:
This script will alert you on setups created when price crosses a smaller MA (default 20 SMA) against the trend direction of 20/200 SMA (default).
Then it will check if the crossing candle get's engulfed or have equal size. IF, an alert will be sent. If alert is set by the user.
ALERTS:
Alerts can be setup once per asset and timeframe. The Indicator uses Any alert () so it will alert in both directions with just one setup per asset/timeframe.
SETTINGS | Inputs
- Moving Average Long Period: 200 (default) - Set to anything
- Moving Average Short Period: 20 (default) - Set to anything
- Moving Average Type: SMA/EMA (SMA) (default)
- Candles Lookback: 0 (X previous candles that has NOT touch the smaller MA upon qualified alert before candle 1 & 2)
- Show MA Lines on Chart (True/False)
SETTINGS | Style
- Change Shapes & Placement of alert symbol.
- Change Color of MA lines color.
SETTINGS | Visibility
- De-Select all boxes except Minutes. Input 5 in the left box and 5 in the right box. Then the indi will only show when you are on the timeframe of 5 minutes.
Questions? Please Post below.
Sincerely,
Daniel & Ryan
The Hunter Trading Group

Nifty50 Participants - Top 25Nifty50 Index is calculated based on the movements of its participants. Every time you think of why is Index going up/down, who is actively dragging the index either ways, this Indicator gives you answer for the same in realtime!
This indicator will help you in pre-planning your trades based on the movements shown by different stocks of various sectors in Index calculation.
RSI column is an add-on to the participation table which will help you in getting RSI values of different stocks of Nifty 50 at a glance. You will see values getting updated in realtime in live market.
Checkout for customisations in indicator settings.
Note:
1. Participants present in this indicator and their participation percentage is taken from the official NSE website.
2. Table shows Top 25 participants by default. If you want to see less than 25 rows, you can update the input via indicator settings.
Feel free to contribute/comment changes if any! Comment in case of any suggestions :)
- Published by Soham Dixit
Fear and Greed Index CandlesticksThis colours the candlesticks based on my 'Fear and Greed Index'.
All calculations are explained in the code.
The index is mainly based upon the components of the popular fear and greed index website. I've annotated the components in the code for you to look at.
If you're interested, you can replace the final variable 'Total' (within the 'barcolor' function at the very end) with any of the final outputs of the subcomponents to see the results of that single part.
Red = Greed
Green = Fear
Enjoy!

VolatilityDivergenceRedGreen by STTAName: VolatilityDivergenceRedGreen by STTA
- Underlying and implied volatiliy normally show negative correlated behavior (price rises, vola falls and vice versa)
- This study shows symbols in on candles in chart where Undelying and corresponding vola index show same bahvior for 1,2 or 3 consecutive bars. (price rises and vola rises and vice versa)
- This situation is called Vola Divergence. Red, when prices and vola fall; green, when price and vola rise
- This information can be used to detect possible end of Up/Down-Swings.
- User can configure if rising or falling or both price movements shall be displayed.
- This study can be used with root symbols, which provide corresponding volatility indices.
- supported Root Symbols: SPX, NDQ, DJI, RUT, CL, XLE, GC, SI, EUR, HSI, FXI, EWZ, AMZN, AAPL, GS, GOOG, IBM, DEU40
- in all other symbols, no symbols are displayed.
Inputs
- underlying displayed in chart
Settings/Parameter
- each Divergence can be switched off/on separately
- output of each displayed symbol can be configured
Outputs
- RedDiv1: first bar with rising price and rising volatility index
- GreenDiv1: first bar with falling price and falling volatility index
- RedDiv2: second bar in a row with rising price and rising volatility index
- GreenDiv2: second bar with falling price and falling volatility index
- RedDiv3: third bar in a row with rising price and rising volatility index
- GreenDiv3: third bar in a row with falling price and falling volatility index
