NCTA Cycle FinderCycle Finder
The NCTA Cycle Finder is one of three technical indicators that are part of the Profit Flow Analytics.
New Cycle Trading and Analytics is a group of traders creating market analytics for traders. The objective is to take complex combinations of multiple technical pattern indicators and present to the trader a simple, single entry signal.
The NCTA Cycle Finder is designed to identify the beginning of new, trending cycles. It is excellent in short 1, 3, and 5 minute timeframes for futures traders and short term options traders. Longer timeframes such as the 5, 10, and 30 minute timeframes work well for options traders.
This indicator consists of a simple, single entry indicator designed to provide an entry very close to the shift on the intra-day cycle. It provides a warning that a cycle shift may be coming by printing a grey bar. Bars above the zero line imply a possible new long cycle developing. Grey bars below the zero line imply a possible new short cycle is developing.
Once the indicator has confirmed a new cycle is developing, a dark blue or red bar will print. Dark blue above the zero line is the trader’s signal to go long. A dark red signal below the zero line is the traders signal to go short. The indicator is designed to filter out false signals and provide the trader with an optimum timing of capturing an entry/exit very close to the beginning / ending of a cycle.
Using the NCTA Cycle Finder, the Profit Flow Oscillator, and Trend Consensus indicators together, offers traders an opportunity to lock in profits and enter the same trending cycle more than one time. This is an excellent opportunity to open trend continuation trades. The NCTA Cycle Finder is excellent when used across more than one timeframe to confirm alignment. For example, monitoring the 5 minute signals and confirming alignment with the 1 minute chart improves the probability of entering a profitable trade.
HOW TO USE: Use the grey bar prints to be ready for a signal and the possible direction. Go long when a blue bar appears and go short when a red bar appears. The print of these signals very closely identify the beginning of a new cycle
The NCTA Cycle Finder, which is part of the Profit Flow Analytics set of indicators, is traded in a live trading room every market day, hosted by our friends at Options Money Maker.
To learn more about the NCTA Cycle Finder and the other two indicators, which are part of Profit Flow Analytics, use the following link:
www.newcycletrading.com
NQZ2019
SP:SPX
Indexes

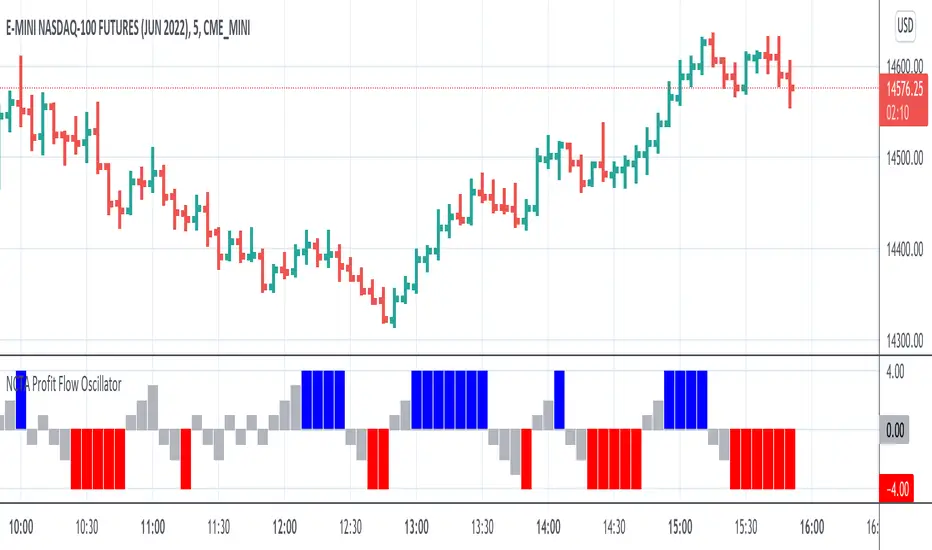
NCTA Profit Flow OscillatorProfit Flow Oscillator
The Profit Flow Oscillator is one of two technical pattern indicators that are part of the Profit Flow Analytics.
New Cycle Trading and Analytics is a group of traders creating market analytics for traders. The objective is to take complex combinations of multiple technical pattern indicators and present to the trader a simple, single signal entry.
The Profit Flow Oscillator is excellent in short 1, 3, and 5 minute timeframes for futures traders and short term options traders. Longer timeframes such as the 5, 10, and 30 minute timeframes work well for options traders.
The Profit Flow Oscillator consists of a simple, single entry indicator designed to provide an entry very close to the shift on the intra-day cycle. It is designed to filter out false signals and provide the trader with an optimum timing of an entry.
HOW TO USE: Go long when a blue bar appears and go short when a red bar appears. These prints very closely identify the beginning of a new cycle
The Profit Flow Oscillator, which is part of the Profit Flow Analytics set of indicators, is traded in a live trading room every market day, hosted by our friends at Options Money Maker.
To learn more and to get a free trial of the Profit Flow Oscillator, use the following link:
www.newcycletrading.com
NQU2019
SP:SPX
NCTA Trend ConsensusTrend Consensus Indicator
The Trend Consensus Indicator is one of two technical pattern indicators that are part of the Profit Flow Analytics.
New Cycle Trading and Analytics is a group of traders creating market analytics for traders. The objective is to take complex combinations of multiple technical pattern indicators and present to the trader a simple, single signal entry.
The Trend Consensus Indicator is excellent in short 1, 3, and 5 minute timeframes for futures traders and short term options traders. Longer timeframes such as the 5, 10, and 30 minute timeframes work well for options traders.
The Trend Consensus Indicator consists of a simple, single entry indicator designed to provide an entry very close to the shift on the intra-day cycle. It is designed to filter out false signals and provide the trader with an optimum timing of an entry. The signal consists of an early indication of a possible entry followed by a confirming/entry signal. It is very simple to monitor and recognize the entry.
HOW TO USE: Go long when a dark blue bar appears as long as there is at least one light or dark blue bar immediately preceding it. Go short when a dark red bar appears as long as there is at least one light or dark red bar immediately preceding it.
The Trend Consensus Indicator, which is part of the Profit Flow Analytics set of indicators, is traded in a live trading room every market day, hosted by our friends at Options Money Maker.
To learn more and to get a free trial of the Trend Consensus Indicator, as part of the Profit Flow Analytics use the following link:
www.newcycletrading.com
NQU2019
SP:SPX

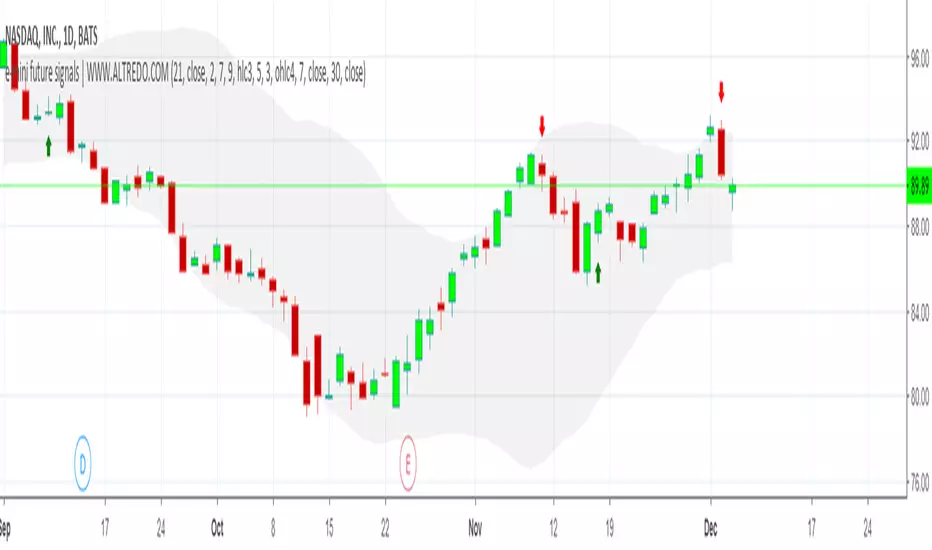
NASDAQ 1D TRADING SIGNALS | DAY TRADING SIGNALSNASDAQ 1D TRADING SIGNALS FOR SHORT-TERM AND MEDIUM-TERM TRADING!
✅ Based on trend analysis, includes Moving Average, Volatility indicators.
✅ This strategy can be used alone or alongside other strategies for better success.
✅ Real-time NASDAQ trading signals
The indicator provides an easy and fast way to determine the trend direction and possible reversals.
Green : Uptrend. Long trading
Red : Downtrend. Short trading

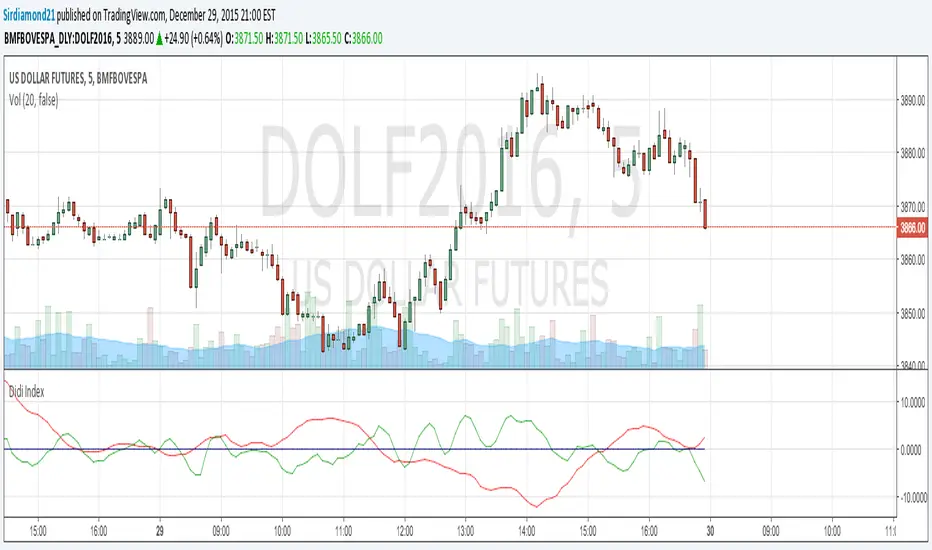
Didi IndexIndicator developed by Brazilian and analyst Odir Aguiar (Didi), consists of "Moving Averages", known for the famous needles Didi, which allows the visualization of reversal points.
The concept is very simple, when you insert 3 Moving Averages on display, one of three periods, an 8 and the other 20, there appears the formation of the indicator which works on an axis or center line 0. The needles occur when the intersection of averages comes closest to the line 0.