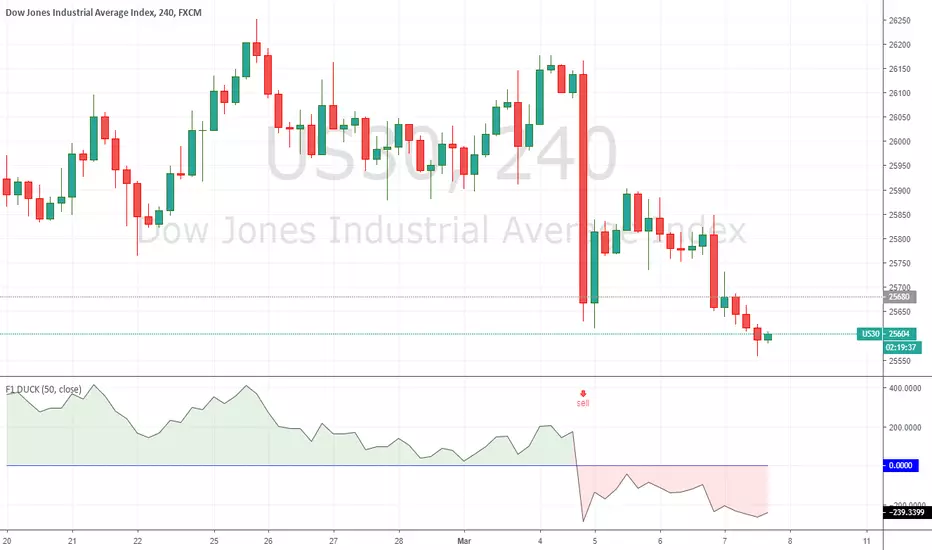
F1 DUCK - TAD SYSTEMTAD System
The acronym TAD stands for TURTLE, ATOM and DUCK.
With the TAD System, traders know when to BUY or SELL easily without any hassle.
The TAD System was founded by Mr Fred Tam, the principal lecturer in F1 Academy of Technical Analysis.
A revolution mechanical trading system designed to make trading easy for beginners and non-experienced traders.
The TAD System is basically a combination of 3 indicators which are included into the TAD System to make trading as simple as possible.
For more information and if you require access for the indicators please do not hesitate to contact us by dropping a message or visit us at:
f1traderacademy.com
Click on “Add to Favorite Scripts” to include the F1 DUCK indicator onto your charting platform.
How simple is the system?
With the three BUY arrows aligned accordingly with the TURTLE, ATOM and DUCK indicators, this triggers an affirmative BUY signal and vice versa.
With the three SELL arrows aligned accordingly with the TURTLE, ATOM and DUCK indicators, this triggers an affirmative SELL signal and vice versa.
The DUCK indicator is to be used alongside with the TURTLE and ATOM indicators.
As with all 3 indicators used alongside, it becomes the TAD System.
To complete your TAD System setup you still require:
To add the F1 TURTLE indicator as favorite script:
To add the F1 ATOM indicator as favorite script:
Indices
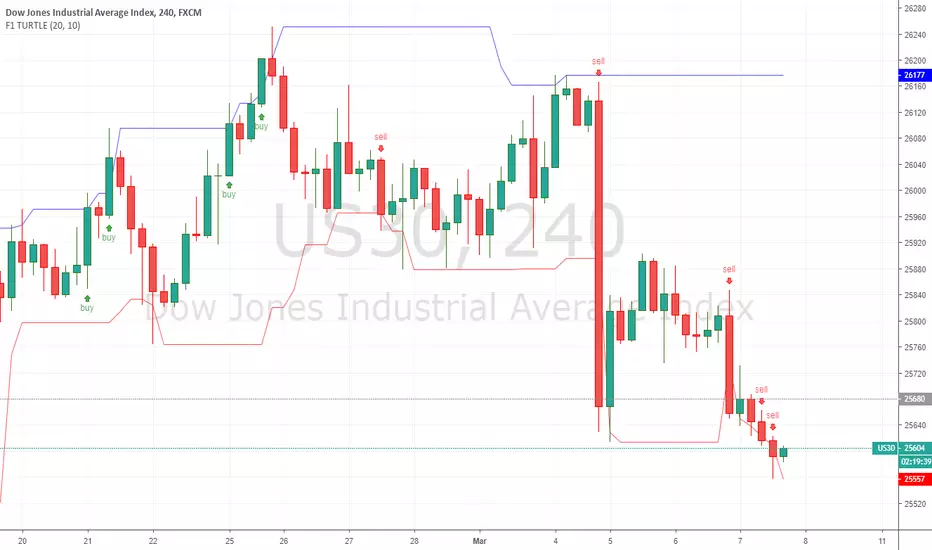
F1 TURTLE - TAD SYSTEMTAD System
The acronym TAD stands for TURTLE, ATOM and DUCK.
With the TAD System, traders know when to BUY or SELL easily without any hassle.
The TAD System was founded by Mr Fred Tam, the principal lecturer in F1 Academy of Technical Analysis.
A revolution mechanical trading system designed to make trading easy for beginners and non-experienced traders.
The TAD System is basically a combination of 3 indicators which are included into the TAD System to make trading as simple as possible.
For more information and if you require access for the indicators please do not hesitate to contact us by dropping a message or visit us at:
f1traderacademy.com
Click on “Add to Favorite Scripts” to include the F1 TURTLE indicator onto your charting platform.
How simple is the system?
With the three BUY arrows aligned accordingly with the TURTLE, ATOM and DUCK indicators, this triggers an affirmative BUY signal and vice versa.
With the three SELL arrows aligned accordingly with the TURTLE, ATOM and DUCK indicators, this triggers an affirmative SELL signal and vice versa.
The TURTLE indicator is to be used alongside with the ATOM and DUCK indicators.
As with all 3 indicators used alongside, it becomes the TAD System.
To complete your TAD System setup you still require:
To add the F1 ATOM indicator as favorite script:
To add the F1 DUCK indicator as favorite script:
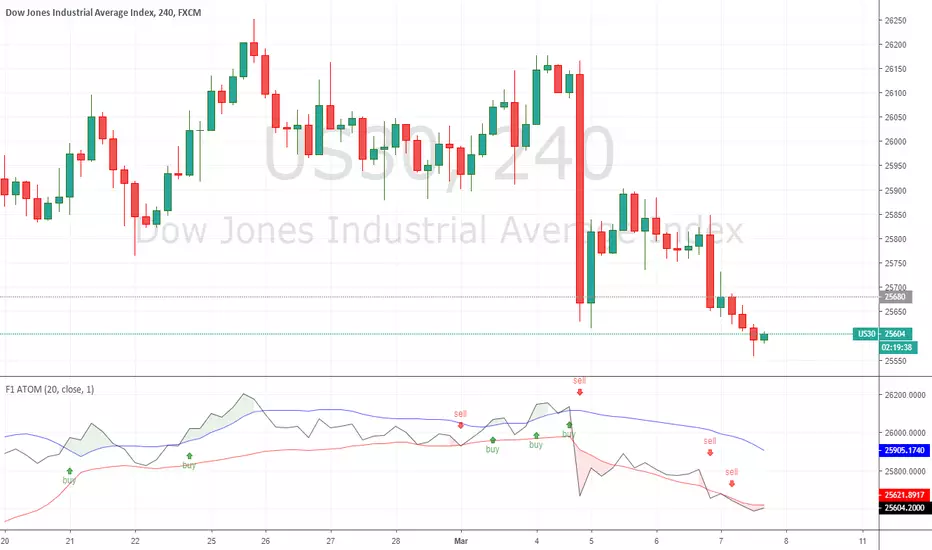
F1 ATOM - TAD SYSTEMTAD System
The acronym TAD stands for TURTLE, ATOM and DUCK.
With the TAD System, traders know when to BUY or SELL easily without any hassle.
The TAD System was founded by Mr Fred Tam, the principal lecturer in F1 Academy of Technical Analysis.
A revolution mechanical trading system designed to make trading easy for beginners and non-experienced traders.
The TAD System is basically a combination of 3 indicators which are included into the TAD System to make trading as simple as possible.
For more information and if you require access for the indicators please do not hesitate to contact us by dropping a message or visit us at:
f1traderacademy.com
Click on “Add to Favorite Scripts” to include the F1 ATOM indicator onto your charting platform.
How simple is the system?
With the three BUY arrows aligned accordingly with the TURTLE, ATOM and DUCK indicators, this triggers an affirmative BUY signal and vice versa.
With the three SELL arrows aligned accordingly with the TURTLE, ATOM and DUCK indicators, this triggers an affirmative SELL signal and vice versa.
The ATOM indicator is to be used alongside with the TURTLE and DUCK indicators.
As with all 3 indicators used alongside, it becomes the TAD System.
To complete your TAD System setup you still require:
To add the F1 TURTLE indicator as favorite script:
To add the F1 DUCK indicator as favorite script:
Lazy Trend System 2019latest, more powerful and applicable on FX, indices, stocks and cryptocurrencies!

Stock Market Indices Correlations HeatmapHello friends,
I'm excited to share one of my insightful tools. This indicator visualizes how major global stock indices move relative to your selected instrument, helping you instantly spot market-wide strength, weakness, or divergence.
🛠 How It Works
The indicator calculates Pearson correlation coefficients between your selected symbol and 28 major stock indices , including S&P 500, NASDAQ, DAX, NIKKEI, and many more. Each color is selected according to the correlation value:
Green hues show positive correlations (instruments moving together).
Red hues show negative correlations (instruments moving in opposite directions).
Lighter or transparent colors indicate weak or no correlation.
You can customize the correlation lookback period (default 14 bars ), select your preferred data source (close, open, etc.), and choose from multiple professional color palettes to best match your charting style.
🔥 Key Features
Comprehensive Global Coverage — Correlations across 28 major indices from North America, Europe, and Asia.
Multiple Palettes — Choose from 8 professional color palettes (Blue/Red, Spectral, Viridis, etc.) for better visual clarity.
Adjustable Lookback — Set correlation calculation period from 1 to any number of bars.
Dynamic Data Requests — Real-time updates for all tracked indices using TradingView's request.security.
Smart Alerts — Receive alerts when all indices align positively or negatively — a sign of broad market sentiment extremes.
Performance Optimized — Efficient data handling ensures smooth operation even with multiple requests per bar.
Enhanced UI — Streamlined settings panel for fast palette and source adjustments.
Non-Repainting — Uses only historical data, ensuring stable readings.
If you'd like access or have any questions, feel free to reach out to me directly via DM.
👋 Good luck and happy trading!
Paid script

Is Open equal to High or LowMany people are watching opening price on each time axis. Opening price is very important.
This indicator displays OHLC Open as a line in multiple time frame.
If open is close to high or low, the color of the line changes.
The fact that they are close means the strength of the market flow and the firmness of that price range.
Note:
The color of the line will not be fixed until bar is closed.
And when using, please set arbitrary coefficient according to each market.
Coefficient e.g.
EURUSD: 0.00005
BTCUSD: 1
DJI: 5
BTCJPY: 100
USDJPY: 0.01
NI225: 2

Snorlax 1DayIndicesHigher percent chance of long and short is arrows, lower chance is circles. Take profit quickly on shorts, parameters work best on indices. Be very cautious when the SMA Fast/Slow gap begins to narrow, false signals are higher there.

Strategy - Bobo's Pivot ATR SwingHi there, welcome to my pivot ATR swing bot. I put this out there with source code hidden to see what ideas others have to use it. Also if there are any coders of trading systems out there who wanted to work with me to put this into a form that could trade automatically we could both use... I'd welcome that kind of collaboration and will happily share the underlying rules of this and the more highly developed version that isn't public.
But as it is, the signals are free for all, use them as you wish and at your own risk. If you want to discuss the code, strategy or ideas, I'm around fairly regularly just message.
The bot is fairly simple design that will give you signals for long and short intraday/week on equity futures / CFDs / ETFs. You'll see it backtests fairly well on an hourly SPX500 chart as configured. You will need to set up certain parameters to account for any different timeframes and markets you wish to trade. For me it's most effective pick out a few good swing trades per week in equity futures. However part of the idea of putting this in the public domain is to see if other people will have good but different ideas how to use it. Please share with me if so :).
The basic concept is a series of 3 lines that define the area and movement we wish to trade. The daily pivot is the central line (blue). We are looking to capture reversions to this middle line from extremes (red and green). Therefore the bot will signal exit at the close of every candle that has passed through the pivot.
Entry is decided by the outer bands around the blue line. Red is the top band, green the bottom. As configured, these are simply placed a daily ATR value apart, centred around the pivot. You can change this quite a lot though, so let's go through the settings:
Pivot Timeframe - simple, a daily pivot is calculated from the previous day's values (high + low + close)/3 . BUt the same calculation can be applied to any length candle, day, minute, month or whatever. This makes the middle target line more or less responsive to recent price action.
ATR Band Timeframe - When we calculate the average range, we need to know what candle length makes up our series. Daily candles is the default, but you can change that here.
ATR Lookback - When we calculate the average range, we need to know how many instances of the timeframe (day, minute, hour etc) we look back to create an average. The lower the lookback value, the more the width of the bands (the distance from pivot) will change quickly based on the volatility of previous candles. The higher the lookback value, the more stable the band width will be to recent volatility.
ATR divisor - The ATR value above is divided by this value, before being added or subtracted to the pivot to create the red and green lines. Default value is 2, and this means the distance from the red band to the green band will be equal to 1 ATR, as calculated according to the parameters above. Setting this to 1 would mean that each band is one ATR away from pivot (ie the bands got wider apart). Set this to 4, and it means that it is only 1/2 an ATR from green to red.
Take Profit / Stop Loss. - We know what a stop and profit target are, but worth nothing that a 0 value disables stop loss or profit targets. The bot will still close positions when crossing pivot.
Also, note the mintick value of the instrument you apply this to. For example for the CFD chart SPX500 the mintick value is 0.1. So a 100 value for stop loss = 10 points on SPX500. but if you were to trade the same thing basically, but the emini future ES, the mintick value is 0.25. So for a 10 point stop on the ES chart, you would need a value of 40 in this bot. US30 and YM have convenient mintick values of 1. Currencies can be a bit of a nightmare :).

Ppsignal Average True Range IndicatorPpsignal atr measures candle true ranges when there are a breakdown o breakout of range, we have a buy or sell signals


