Double KAMA + VWMAThis study combines a fast and slow Kaufman Adaptive Moving Averages (KAMA) with a fast and slow Volume-Weighted Moving Average(VWMA).
The KAMA is definitely one of our favorite moving averages because it takes into account volatility and filters out false signals during periods of insignificant or horizontal price movement. This results in more patient, less impulsive trading. At its most basic, the KAMA's value remains relatively close in value to the price when volatility is low then lags slightly behind it during highly volatile movements and larger trends.
We've plotted two Kaufman's Adaptive Moving Averages:
-The first KAMA is the slow KAMA, which we use as a trend filter. It is shown on the graph as the thicker solid line that alternates between green and red. When the trend filter KAMA is bullish, the line turns green. It then turns red when bearish. Users can adjust the lengths of the fast and slow EMA for the KAMA's calculation in the input option menu, but it is important to remember that the number of periods should remain high in comparison to the fast KAMA as this allows it to track long-term price movements and trends.
-We then include a fast KAMA which has shorter EMA Lengths to focus in on movements within a smaller timeframe.
NOTE: The fast KAMA is only plotted when the trend filter KAMA is generating bullish signals. It is shown as the alternating pink and teal line above the main green line. When the fast KAMA is increasing, its line and the area between it and the slow KAMA are filled teal. When the fast KAMA is falling, its line and the area between the fast and slow KAMA lines are colored pink. This helps with timing exits.
Lastly, we've included a fast and slow VWMA to time long entries. These are only plotted when the Trend Filter KAMA is bearish. The fast VWMA is the teal solid line under the trend filter KAMA and the slow VWMA is the pink line. Optimal entries will occur when the fast VWMA crosses above the slow VWMA. When the slow VWMA is greater than the fast VWMA, the area between the two lines is filled red, while the same area is filled teal when the fast VWMA is greater than the slow.
I've included entry signals (shown on the screenshot as the lime green background highlights), but this is the basic version of the indicator. If you're interested in taking a look at the full version with alerts and entry + exit signals, feel free to send us a message!
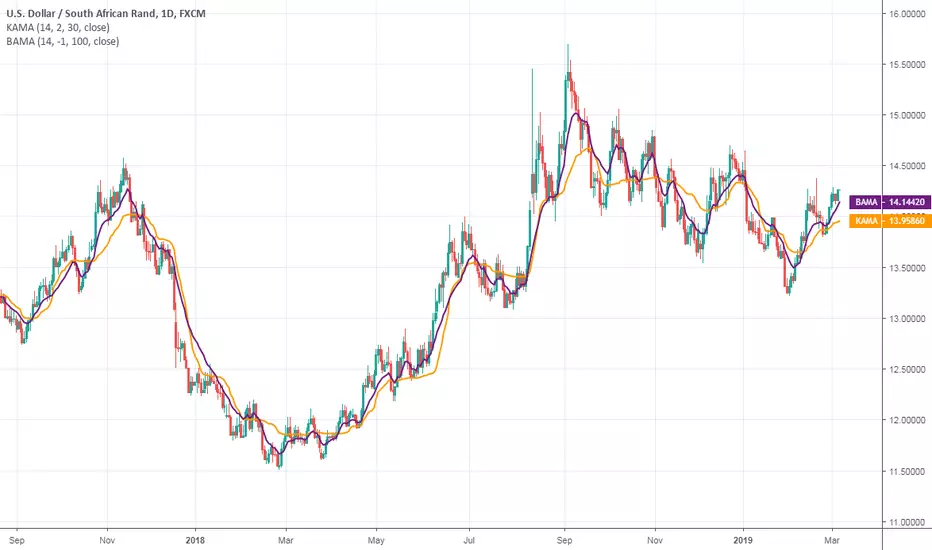
Kaufman's Adaptive Moving Average (KAMA)

Koby's 3 average MACD indicatorThis MACD is averaging 3 different MACD; KAMA MACD, ZLEMA MACD, and normal MACD.
Can find easier MACD's divergence and convergence than normal MACD.
And more smoothly drawing than ZLEMA MACD (KZ_MACD) which is I've made before.
Koby's ZLEMA MACD and KAMA signalUsing zero lag ema for MACD line, and using KAMA for MACD's signal line.
Test version.
This has MACD and signal cross alert, and 0 line alert.
Moving Average CrossoverIt was planned as an addition to Moving Average Smoothness Benchmark and Profitable Moving Average Crossover , but can be used standalone.
Supports 62 types of well-known moving averages and allows full-featured customization.
Supported types of averages and filters:
AEMA , Adaptive Exponential MA (by Vitali Apirine)
AHMA , Ahrens MA (by Richard D. Ahrens)
ALMA , Arnaud Legoux MA (by Arnaud Legoux and Dimitris Kouzis-Loukas)
ALF , Adaptive Laguerre Filter (by John F. Ehlers)
AMA , Adaptive MA (by Vitali Apirine)
ARSI , Adaptive RSI
BAMA , Bryant Adaptive MA (by Michael R. Bryant)
BF2 , Butterworth Filter with 2 poles
BF3 , Butterworth Filter with 3 poles
DEMA , Double Exponential MA (by Patrick G. Mulloy)
DWMA , Double Weighted (Linear) MA
EDCF , Ehlers Distance Coefficient Filter (by John F. Ehlers)
EDSMA , Ehlers Deviation-Scaled MA (by John F. Ehlers)
EHMA , Exponential Hull MA
EMA , Exponential MA
EVWMA , Elastic Volume Weighted MA (by Christian P. Fries)
FRAMA , Fractal Adaptive MA (by John F. Ehlers)
GF1 , Gaussian Filter with 1 pole
GF2 , Gaussian Filter with 2 poles
GF3 , Gaussian Filter with 3 poles
GF4 , Gaussian Filter with 4 poles
HFSMA , Hampel Filter on Simple Moving Average
HFEMA , Hampel Filter on Exponential Moving Average
HMA , Hull MA (by Alan Hull)
HWMA , Henderson Weighted MA (by Robert Henderson)
IDWMA , Inverse Distance Weighted MA
IIRF , Infinite Impulse Response Filter (by John F. Ehlers)
JAMA , Jurik Adaptive MA (by Mark Jurik)
JMA , Jurik MA (by Mark Jurik, )
KAMA , Kaufman Adaptive MA (by Perry J. Kaufman)
LF , Laguerre Filter (by John F. Ehlers)
LMA , Leo MA (by ProRealCode' user Leo)
LSMA , Least Squares MA (Moving Linear Regression)
MAMA (by John F. Ehlers)
FAMA , Following Adaptive MA (by John F. Ehlers)
MD , McGinley Dynamic (by John R. McGinley)
MHLMA , Middle-High-Low MA (by Vitali Apirine)
MNMA , McNicholl MA (by Dennis McNicholl)
NSMA , Moving Average 3.0 on SMA (by Manfred G. Dürschner)
NEMA , Moving Average 3.0 on EMA (by Manfred G. Dürschner)
NWMA , Moving Average 3.0 on WMA (by Manfred G. Dürschner)
NVWMA , Moving Average 3.0 on VWMA (by Manfred G. Dürschner)
PEMA , Pentuple Exponential MA (by Bruno Pio)
PWMA , Parabolic Weighted MA
QMA , Quick MA (by John McCormick)
QEMA , Quadruple Exponential MA (by Bruno Pio)
REMA , Regularized Exponential MA (by Chris Satchwell)
RMA , Running MA (by J. Welles Wilder)
RMF , Recursive Median Filter (by John F. Ehlers )
RMTA , Recursive Moving Trend Average (by Dennis Meyers)
SHMMA , Sharp Modified MA (by Joe Sharp)
SMA , Simple MA
SSF2 , Super Smoother Filter with 2 poles (by John F. Ehlers)
SSF3 , Super Smoother Filter with 3 poles (by John F. Ehlers)
SWMA , Sine Weighted MA
TEMA , Triple Exponential MA (by Patrick G. Mulloy)
TMA , Triangular MA (generalized by John F. Ehlers)
T3 , (by Tim Tillson)
VIDYA , Variable Index Dynamic Average (by Tushar S. Chande)
VWMA , Volume Weighted MA (by Buff P. Dormeier)
WMA , Weighted (Linear) MA
ZLEMA , Zero Lag Exponential MA (by John F. Ehlers and Ric Way)

Bryant Adaptive Moving Average@ChartArt got my attention to this idea.
This type of moving average was originally developed by Michael R. Bryant (Adaptrade Software newsletter, April 2014). Mr. Bryant suggested a new approach, so called Variable Efficiency Ratio (VER), to obtain adaptive behaviour for the moving average. This approach is based on Perry Kaufman' idea with Efficiency Ratio (ER) which was used by Mr. Kaufman to create KAMA.
As result Mr. Bryant got a moving average with adaptive lookback period. This moving average has 3 parameters:
Initial lookback
Trend Parameter
Maximum lookback
The 2nd parameter, Trend Parameter can take any positive or negative value and determines whether the lookback length will increase or decrease with increasing ER.
Changing Trend Parameter we can obtain KAMA' behaviour
To learn more see www.adaptrade.com
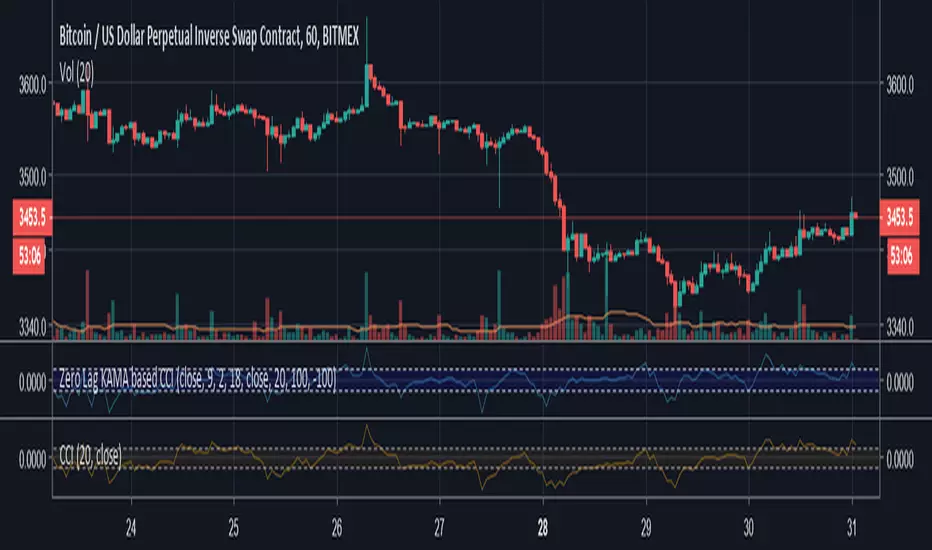
Zero Lag KAMA based CCIExperiment that uses an (optional) Zero Lag adjustment and KAMA instead of the default SMA to calculate the CCI.
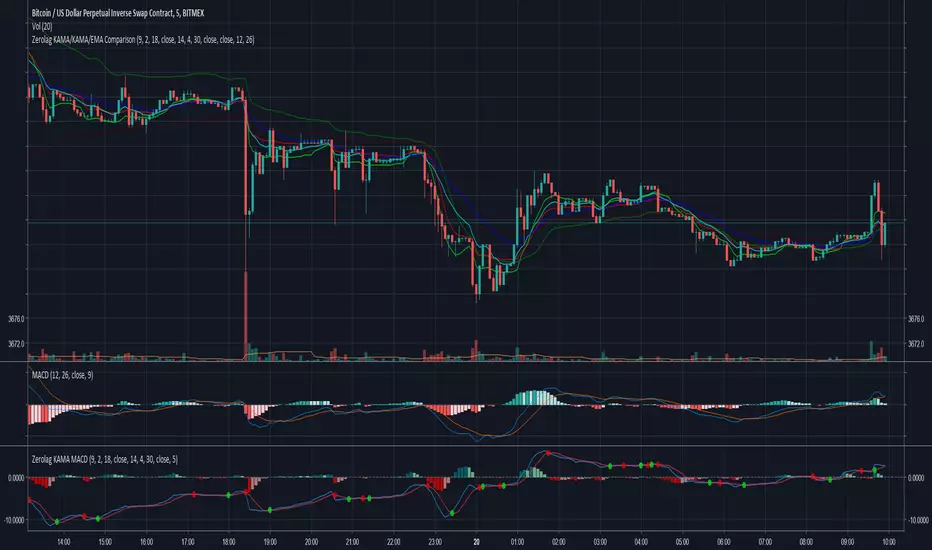
Zerolag KAMA MACDExperimental Zero Lag Adjusted KAMA based MACD.
Uses Kaufman's Adaptive Moving Average (KAMA) instead of the standard EMAs to calculate the MACD with an optional application of the zero lag adjustment.
Significant differences in momentum changes (zero line crossovers), often earlier signal line crossovers and differences in divergences.
Chart displays :
Top : Zero lag adjusted KAMA based MACD
Middle : Unadjusted KAMA based MACD
Bottom : Standard MACD
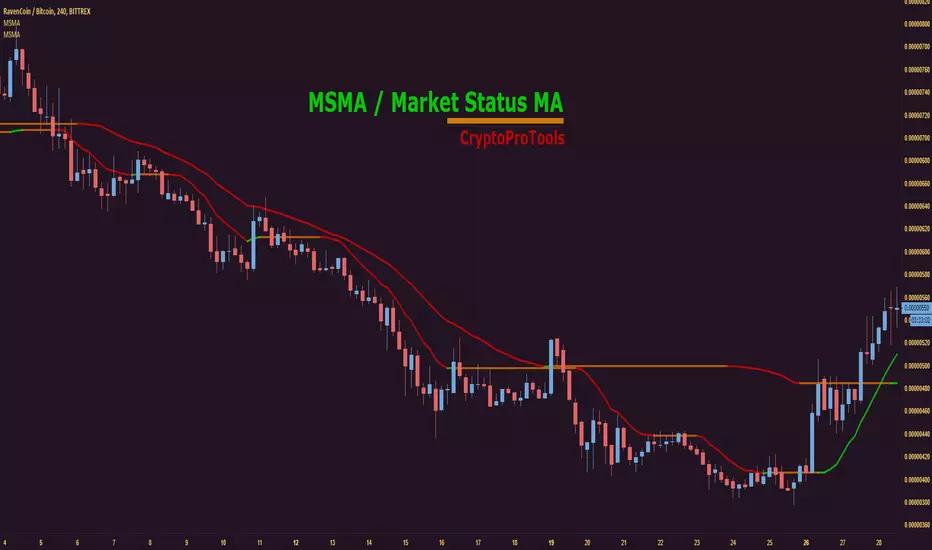
Market Status Moving AverageGet a quick easy view of the current market status.
Examples used above are lengths 6 and 15, but you can tweak to your liking.
Want to stop sweating the small stuff and see the bigger picture? Try increasing the length to 50, 100 etc
Green = Bullish
Orange = Consolidation / Flat
Red = Bearish
--------------------------------------------------------------------
--------------------------------------------------------------------
Check out some of our other recent releases below :
Kaufman Adaptive Moving AverageKaufman Adaptive Moving Average script.
This indicator was originally developed by Perry J. Kaufman (`Smarter Trading: Improving Performance in Changing Markets`, 1995).

colorsi just put it for for who ever want it.. it has some issue of repaint . put on 1 day frame in hlc box ,so it can solve the issue to some extent. based on Marco code with some modification
i hope someone will be able to fix the code and make it better :)
MA Study: Different Types and More [NeoButane]A study of moving averages that utilizes different tricks I've learned to optimize them. Included is Bollinger Bands, Guppy (GMMA) and Super Guppy.
The method used to make it MtF should be more precise and smoother than regular MtF methods that use the security function. For intraday timeframes, each number represents each hour, with 24 equal to 1 day. For daily, 3 is 3 day, for weekly, 4 is the 4 weekly, etc. If you're on a higher timeframe than the one selected, the length will not change.
Log-space is used to make calculations work on many cryptos. The rules for color changing Guppy is changed to make it not as choppy on MAs other than EMA. Note that length does not affect SWMA and VWAP and source does not affect VWAP.
A short summary of each moving average can be found here: medium.com
List of included MAs:
ALMA: Arnaud Legoux
Double EMA
EMA: Exponential
Hull MA
KAMA: Kaufman Adaptive
Linear Regression Curve
LSMA: Least Squares
SMA: Simple
SMMA/RMA: Smoothed/Running
SWMA: Symm. Weighted
TMA: Triangular
Triple EMA
VWMA: Volume Weighted
WMA: Weighted
ZLEMA: Zero Lag
VWAP: Vol Weighted Average
Welles Wilder MA

KAMA: Kaufman Adaptive Moving Average x2/LogCalculation begins at the beginning of the bar, eliminating incorrect moving average weighting at the very beginning of the ticker you're watching. This is important for new stocks, futures, altcoins, etc.
The inputs for the fast/slow alphas are now normal integers, with the calculation (2 / (y + 1)) for alpha added after input.
Comes with two moving averages and a setting for geometric mean/log. Source is adjustable but using the close works best, especially with how this particular MA is calculated in the first place. Besides that, this is mostly the same as other KAMAs on TradingView, but I'd like to say I put a bit more care into this one.
It is important to know that the acceptable length for KAMA is within the boundaries of the alpha lengths. For example, the default lengths are 2 and 30 for alpha, so the acceptable length for KAMA is within 2-30.
stockcharts.com
www.technicalindicators.net

Caribbean AlertsHi!
This is the alert script for the Caribbean strategy. I'm using with autoview. Use with care.

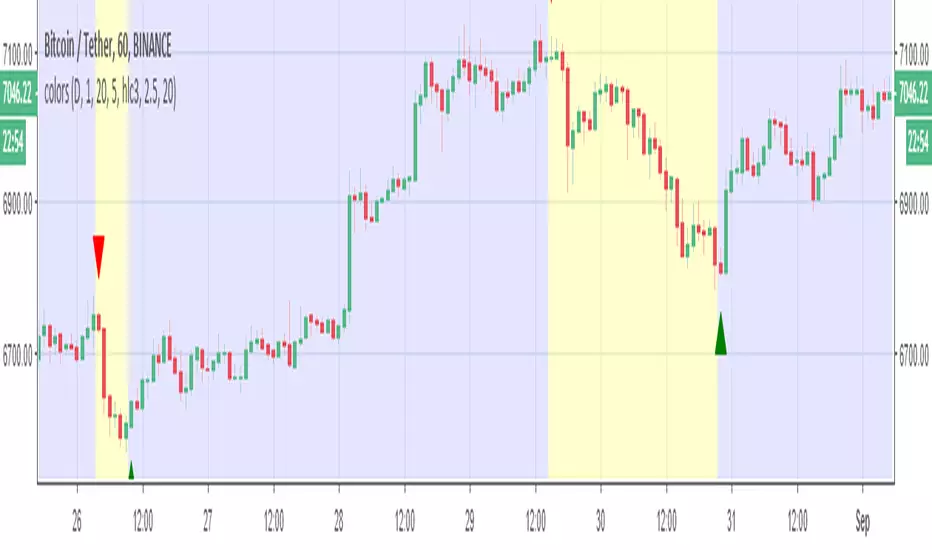
linear-heikenThis model is based on two things
1. Heiken-Kaufman model made by marco (seen in red green arrow)
2. the colour coding is linear regression (green-up period) and (yellow-down period)
alerts inside

Adaptive Moving AverageAdaptive Moving Average indicator script. This indicator was originally developed by Vitali Apirine (Stocks & Commodities V.36:5: Adaptive Moving Averages).

KAMA Divergence [DW]This study is a simple experiment that expresses divergences between price and Kaufman's Adaptive Moving Average as a percentage. The result is then smoothed using KAMA to provide a signal line.

Fibonacci Period KAMA SeriesThis study is a simple experiment using Kaufman's Adaptive Moving Average that plots a base average with a period of your choice, then plots averages with periods multiplied by Fibonacci numbers 2 through 34.
Kaufman Moving Average Adaptive (KAMA) StrategyEveryone wants a short-term, fast trading trend that works without large
losses. That combination does not exist. But it is possible to have fast
trading trends in which one must get in or out of the market quickly, but
these have the distinct disadvantage of being whipsawed by market noise
when the market is volatile in a sideways trending market. During these
periods, the trader is jumping in and out of positions with no profit-making
trend in sight. In an attempt to overcome the problem of noise and still be
able to get closer to the actual change of the trend, Kaufman developed an
indicator that adapts to market movement. This indicator, an adaptive moving
average (AMA), moves very slowly when markets are moving sideways but moves
swiftly when the markets also move swiftly, change directions or break out of
a trading range.

Kaufman's Adaptive Moving Average BandsKaufman's Adaptive Moving Average with 6 Bands at a time and trend direction.

Kaufman Adaptive Moving Average (day)The KAMA will not change when the interval changes from day to something like 5 minutes or 30 minutes. Allows for more precise trading with the same indicator on a different interval.