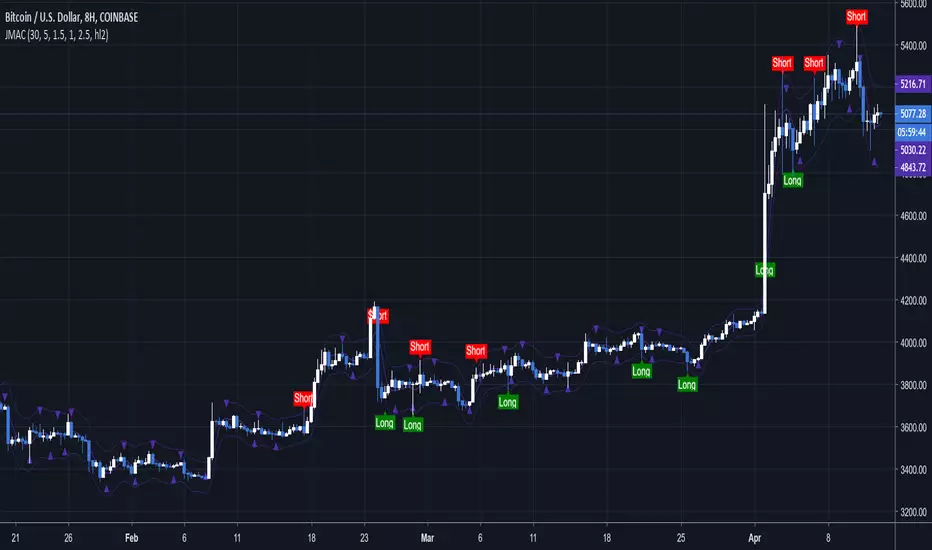
+ ALMA Trend DetectorHi, again. Here I have a nice moving average script designed to get you into trends and keep you in trends until the opportune moment comes to exit. And, as with any indicator, or suite of indicators, designed to get one into trends and keep him/her in a trend, they do not do so well in chop/ranging/mean reversion conditions, though I would say this one is better than most, otherwise I wouldn’t be fitting it into my trading system.
This is a huge improvement, in my opinion, over an indicator I found recently, and like quite a bit by samsmilesam, which you can find here: www.tradingview.com
In this adaptation of his script I changed a bunch of things, but kept the spirit of the indicator true.
This indicator utilizes three different length Arnaud Legoux moving averages, known for being extremely low lag, and incredibly adjustable (though I find the original authors settings excellent).
While he has buy and sell signals triggering regardless of the fast and slow ma’s position to the trending ma, I actually take the trending ma into account. Furthermore, I wouldn’t say I coded in signals indicating buying and selling, but that I coded in signs that answer the question “what kind of trend are we in?” as well as possible ideal trade exits (which couuuuuld also be taken as entries, but aren’t necessarily meant to).
So, the deets on this:
1) 5 period, 20 period, and 70 period ALMAs. Fast, slow and trend. All customizable independent of each other (unlike the sam’s). All three also change color based on their own individual trends.
2) Uptrends are identified when price is closing above the Trend ma, and both Fast and Slow ma’s are above the Trend ma, and vice versa for downtrends. There are in-between points when a trend is not identified, and this is when price closes above or below the Trend ma, but the other two ma’s have not crossed it. Background color is used to identify the trend.
3) Trade exits are based on closing price and Fast and Slow ma’s relative to the Trend ma, once again. To signal exiting an uptrend price must close below both Fast and Slow ma’s and both Fast and Slow ma’s must be above the Trend ma; and vice versa for exiting a down trend. Obviously there may be false signals, but there are fewer signals, and I think it’s a better strategy than most. I prefer to filter out as much noise as possible. There’s little worse in my opinion than an indicator that gives too many false signals, but obviously it’s impossible to remove them all. Some discretion is necessary on the part of the trader.
4) So what does this mean for trade entries? Well, you can certainly enter a trade on a signal for an exit (go long on a short exit signal) if the chart looks good for that. Or you can wait for trend confirmation with the background color, entering on a pullback to the ma’s perhaps. Or you can enter in the “no man’s land” in between trends. If you’ve exited and price continues on trending your best bet would be to wait for a pullback into the ma’s or a s/r level, or look for the next candle that closes beyond the Fast and Slow ma’s. These are just thoughts of mine.
5) Lastly, there are alert conditions set for uptrends, downtrends and both long and short exits!
Enjoy the indicator! I think with some sort of bands or channels for those times when the market is rangebound or in chop, you could really crush it with this.
Keltnerchannel

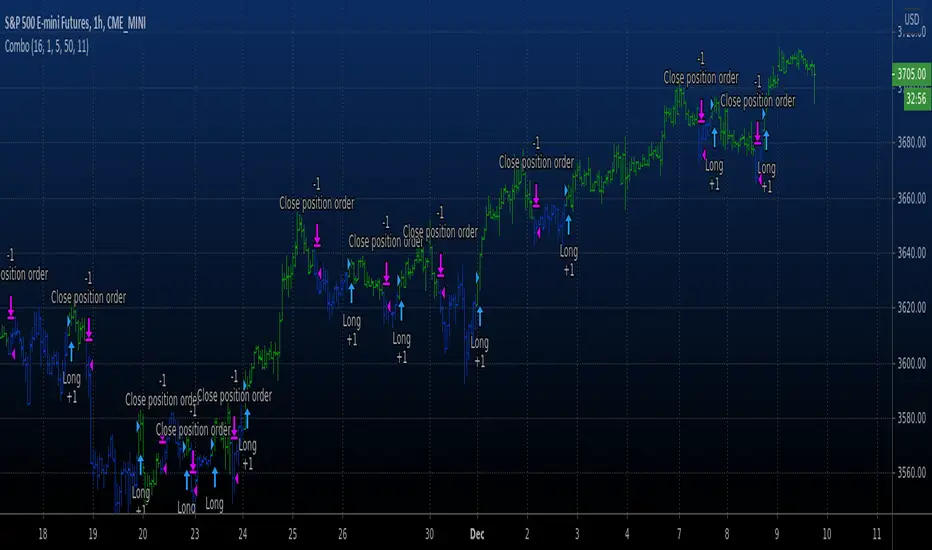
Optimized Keltner Channels Strategy for BTCThis strategy is optimized for Bitcoin with the Keltner Channel Strategy, which is TradingView's built-in strategy. In the original Keltner Channel Strategy, it was difficult to predict the timing of entry because the Buy and Sell signals floated in the middle of the candle in real time. This strategy is convenient because if the bitcoin price hits the top or bottom of the Keltner Channel and closes the closing price, you can enter Buy or Sell at the next candle start price. In addition, this strategy provides a visual plot of the price (bprice, sprice) at which the candle is closed by hitting Keltner Channel.
▶ Usefulness and Originality
- Convenient Buy and Sell entry compared to the original Keltner Channel Strategy
- Optimized for BTCUSD market (maximizing profits)
___________________________________________
이 전략은 TradingView의 Built-in 전략인 Keltner Channel Strategy를 비트코인에 맞게 최적화되었습니다. 기존의 Keltner Channel Strategy는 Buy, Sell 신호가 캔들 중간에 실시간으로 떠서 진입 시점을 예측하기 어려운 불편함이 있었지만 이 전략은 비트코인 가격이 Keltner Channel 상단 혹은 하단을 찍고 종가를 마감하면 그 다음 캔들 시작가에서 Buy 혹은 Sell 진입이 가능하여 편리합니다. 또한, 이 전략은 Keltner Channel을 만나서 캔들을 마감한 가격 (bprice, sprice)을 시각적으로 plot을 제공하여 타점 및 차트를 보기에 편리합니다.

Keltner Channel [LINKUSDT] 1HThis is a long-only strategy tested on LINK/USDT, 1 hour bar, from Feb 2019. The entry is determined by the breakout of upper Keltnel Channel and when the +DI is higher than 32. Instead of a fixed stop-loss from the original script , I change the exit to the middle band of the Keltnel Channel. 1st profit target will close 20% of the position. 2nd profit target will close 30% of the position. While the remaining 50% position will be closed when the price closes below the middle band of the Keltnel Channel, to take advantage of big trend. All parameters are adjustable. I added another option to enable or disable the ribbon trend filter.
My thoughts: For the same period, LINK appreciated 3000%. So I guess most in and out strategies couldn’t beat a buy and hold strategy during this period. But this doesn’t mean that this strategy is not feasible as each strategy is designed to only take advantage of a certain pattern or behavior of the market. Also, short term strategies allow you to use leverage and hence enable you to use you capital efficiently. Commission is set to 0.1%, taking account of the slippage.
Suggestion: Please perform walk forward analysis before you use real money for trading. Parameters need to be adjusted from time to time depends on your analysis. Can try using ATR for profit targets as over a longer term, the volatility might drop hence a high fixed % profit targets might not be realistic.
Any suggestions are welcome!

Combo Backtest 123 Reversal & Keltner Channel This is combo strategies for get a cumulative signal.
First strategy
This System was created from the Book "How I Tripled My Money In The
Futures Market" by Ulf Jensen, Page 183. This is reverse type of strategies.
The strategy buys at market, if close price is higher than the previous close
during 2 days and the meaning of 9-days Stochastic Slow Oscillator is lower than 50.
The strategy sells at market, if close price is lower than the previous close price
during 2 days and the meaning of 9-days Stochastic Fast Oscillator is higher than 50.
Second strategy
The Keltner Channel, a classic indicator
of technical analysis developed by Chester Keltner in 1960.
The indicator is a bit like Bollinger Bands and Envelopes.
WARNING:
- For purpose educate only
- This script to change bars colors.
Keltner Color count [DinhChienFX]Use the synchronization of the 3 lines Basis, Upper, Lower to calculate whether the trend will continue or not.
1. Color the 3 lines Basis, Upper, Lower of the Keltner channel
- If the value of 3 Basis, Upper, and Lower lines in front of a candle increases, fill in green.
- If the value of 3 Basis, Upper, and Lower lines in front of one candle decreases, color in red.
- If 1 of the 3 lines Basis, Upper, and Lower are not in the same direction, paint in gray.
2. Identify the trend.
a. Assign a score for the channel color.
... If blue plus 1 point.
... If red subtracts 1 point.
... If gray gives 0 points.
b. Formula for calculating trend:
Take the total number of past candles. If total> 0 is an Up trend. If total <0 is the downtrend. If total = 0 is sideways.
...Uptrend
...Downtrend
Example: Counting 25 past candles equates to 1 day + 1 hour to determine a trend.

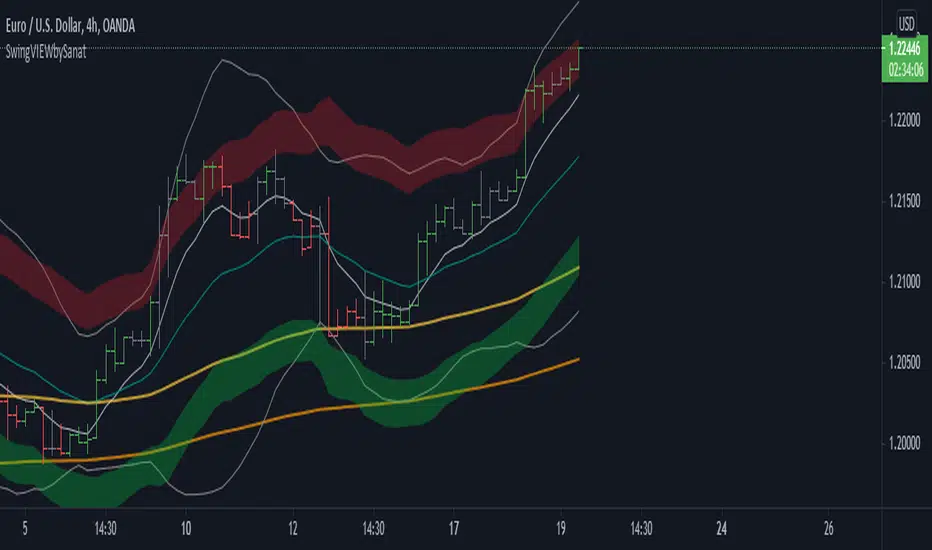
SVIEWThis is momentum based indicator
Input
1. Two EMA
2. Stochastic
Thought process
1. Difference between fast and slow ema has a oscillating nature.
2. Stochastic %k %d crossover gives early signals
3. early entry gives low risk high reward setup
Calculation
1. A= EMA (fast) - EMA (slow)
2. B =Stochastic(%K)-Stochastic(%D)
When A is increasing and B is positive, bar is green
When A is decreasing and B is negative, bar is red
Else, bar is black
Use
This is an early entry signal system. When used with Channel trading system, it gives high probability, low risk high reward setups
Example
When price has breached below -2 Keltner channel, and impulse candle turns green, go long (or sell put options )
29 minutes ago
Release Notes:
This is combination of
1. Ema diff
2. stochastic
3. Keltner channel
4. Bollinger bands
5. bunch of EMAs
Thought process
1. Difference between fast and slow ema has a oscillating nature.
2. Stochastic %k %d crossover gives early signals
3. early entry gives low risk high reward setup
Calculation
1. A= EMA (fast) - EMA (slow)
2. B =Stochastic(%K)-Stochastic(%D)
When A is increasing and B is positive, bar is green
When A is decreasing and B is negative, bar is red
Else, bar is black
Use
This is an early entry signal system. When used with Channel trading system, it gives high probability, low risk high reward setups
Example
When price has breached below -2 Keltner channel, and impulse candle turns green, go long (or sell put options )

Keltner Channel AlertSimple Keltner Indicator with a custom alert.
The alert should ring when any Band has the price crossing.

CBG Keltner ChannelsHere's an updated version of the CBG Keltner Channel indicator.
1. Added a new option for painting bars and backgrounds.
- Option 5 will paint up bars if the midline moving average is moving up and price is above the control moving average. It will paint down bars if the opposite is true. If neither are true, it will paint a neutral color. The neutral color defaults to gray bars and no color for backgrounds.
2. I've also added a 3rd band.
The chart here shows the default settings except for the inner band which is turned off.
NSDT Triple KeltnerA different spin on Keltner Channels. Using 3 channels of varying widths provides a good visual for potential entries off of extremes. Normal channel is center, green and red "zones" could be used as potential entry/exit areas, and the outside yellow zones may be viewed as extremes (signifying potential breakouts or strong reversal areas).

OneGreenCandle - Hull Keltner Channel
The Keltner Channel, a classic indicator of technical analysis developed by Chester Keltner in 1960.
The indicator is a bit like Bollinger Bands and Envelopes.
This variation uses the Hull Moving Average as the centre line for the channel.

Keltner | Bollinger | SqueezePercent B (%B), it's derivation Percent K (%K) and squeeze indicator combined in one.
blue line = bollinger %
orange line = keltner %
red background = squeeze*
squeeze = bollinger bands are inside (encapsulated by) keltner channel


Keltner Channels ProHello Fellow Traders!
Script Info
Keltner Channel uses Average True Range and Bollinger Bands uses Standard Deviation.
And if you compare the two, you’ll realize Keltner Channel is “smoother” version to Bollinger Bands.
I have included a one hour backtest including slippage and 0.075% commissions to meet most exchanges standards, as you can see it fairs quite well using the opportunities BUY & Sell the Keltner Channel breakouts.
FEATURES
------------------------
*Goat Alerts & Autoview Ready*
- Easy to Use
- DCA
- Take Profit
- Stop Loss
You can get access to any of my scripts by visiting my Website, all links are down below!

Keltner Channel Alerts [QuantNomad]This is a script with alerts for standard Keltner Channer Strategy you can find in TradingView.
Use "Once Per Bar" option when creating alerts.

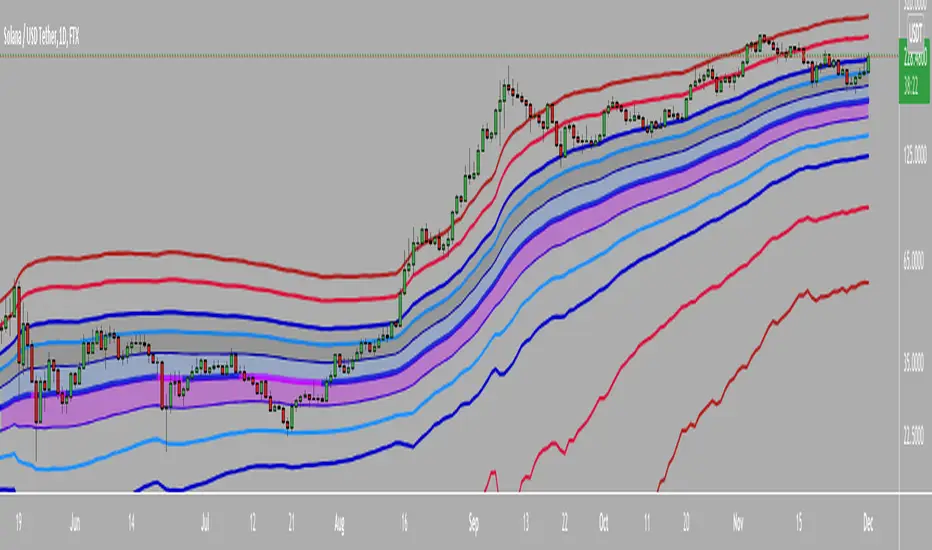
Cuban's Reversion BandsThere are quite a few band indicators out there, ATR, VWAP, Bollinger, Fib, etc. however, I could never find anything that could scale accurately during periods of high volatility. That brought me to writing this indicator.
These bands use my Volume-Weighted Anchored Trend (VWAT) for the basis and highlight the standard deviation that you might expect high probability reversals to occur from.
I use these bands in my own trading system. The default settings are quite effective but you're able to modify the std multiplier within the settings as you see fit.
Generally, I would only play reversals during a ranging environment, however even if the market is trending, these bands will assist in spotting a weakening trend.
An ideal trend reversal would be a wick into the outer band, followed shortly by a weaker sweep of the previous move and wicking the inner band.
Hopefully you'll find this useful in your trading!

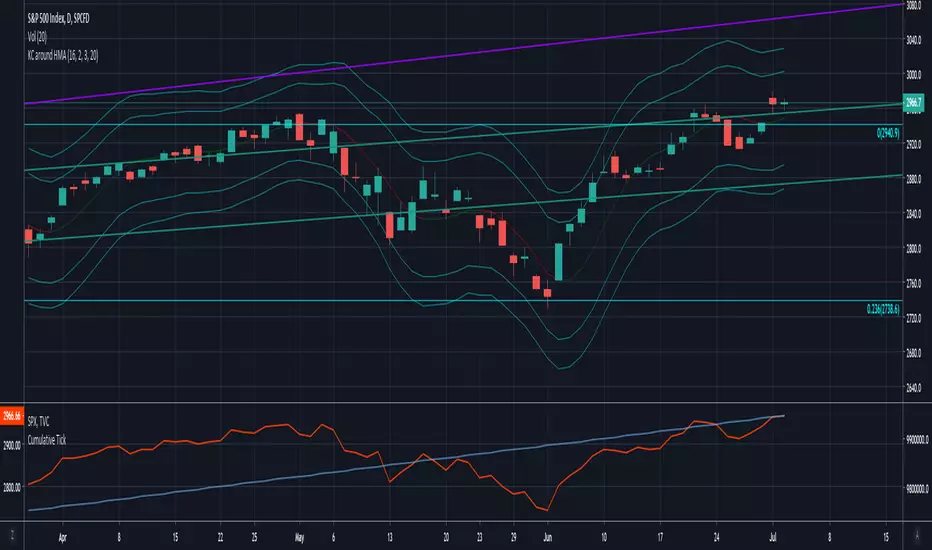
Keltner Channels around Hull MAKeltner Channels around Hull Moving Average
Script shared upon request. No guarantees on accuracy.
Volatility BandsWe used Marc Chaikin’s Chaikin Volatility as somewhat of a baseline for this indicator and then built on it. Like Chaikin Volatility, our indicator draws primarily upon high-low spreads to quantify a security’s volatility. It also has similarities to Keltner Channels as it uses ATR rather than standard deviations in its calculation of the different bands.
Inputs:
int ‘len0’, lookback window for fast EMA of high-low ranges.
int ‘len1’, lookback window for slow EMA of high-low ranges.
int ‘len2’, lookback window for slow EMA of closing prices.
float ‘m0’, ATR multiplier for first upper and lower volatility bands.
float ‘m1’, ATR multiplier for second upper and lower volatility bands.
float ‘m2’, ATR multiplier for third upper and lower volatility bands.
int ‘lenATR’, window length for ATR calculation.
Output: 3 Upper and Lower Volatility Bands (6 total).
1. Compute High Low Spread for current period.
hlr = (high – low)
2. Calculate Exponential Moving Average of HLR at length len0
fastEMA = ema(hlr, len0)
3. Calculate Exponential Moving average of HLR at length len1 (where len1 > len0)
slowEMA = ema(hlr, len1)
4. Get EMA of closing prices at length len2(where len2 > len1 and len1 > len0)
priceEMA = ema(close, len2)
5. Use adjusted Chaikin Volatility Formula to quantify volatility
v = (fastEMA – slowEMA) / slowEMA
6. Calculate three upper and three lower volatility bands (6 total):
ex:
upper0 = priceEMA + ((1 – cv) * (atrMult0 * atr(lenATR)))
lower0 = priceEMA – ((1 – cv) * (atrMult0 * atr(lenATR)))
One possible way to use this indicator is to enter a long position when the security’s price falls below the lowest volatility band and then exit when it crosses above the third upper band. This seems to get the best results for quick, high frequency trading. Another approach is to enter a position when the bands begin to break out from a compact state and the width between them increases.
Still tweaking the idea, so any feedback would be appreciated.

Jurik Zones — SharkCIAHere we have modified a keltner channel calculated using the Jurik Moving Average. This is a cleaner and longer term version of JMA Channels.

Rumpy's McGinley's Dynamic Bollinger Bands and Keltner ChannelUses volume weighted (optional) applied to the McGinley Dynamic for the basis of either a Bollinger Band or Keltner Channel.
When volume weighting is enabled it uses a volume weighted standard deviation to calculate the bollinger width.
Keltner channel also uses the McGinley formula to calculate the ATR used to determine the width of the channel.
Both the 1x and 2x standard dev and ATR multiples had significant PA interaction so both intervals are plotted to the BB and KC.
---------------------------------------
If you find it useful please consider a tip/donation :
BTC - 3BMEXEDyWJ58eXUEALYPadbn1wwWKmf6sA
---------------------------------------
Keltner Channel :

Super Moving Average
Plots one of several types of moving average types
Supports ATR/Kelter Channels
Supports Bollinger Bands
Velocity squeezes shown on the moving average to identify possible turning points
Supports ATR based stop for MA Trend Reversals
MA Trend reversal alert conditions
See related Moving Average Ribbon script.

Jurik Channels — SharkCIAThis is a keltner channel calculated using the Jurik Moving Average.
Special thanks to auroagwei www.tradingview.com
Special thanks to everget www.tradingview.com
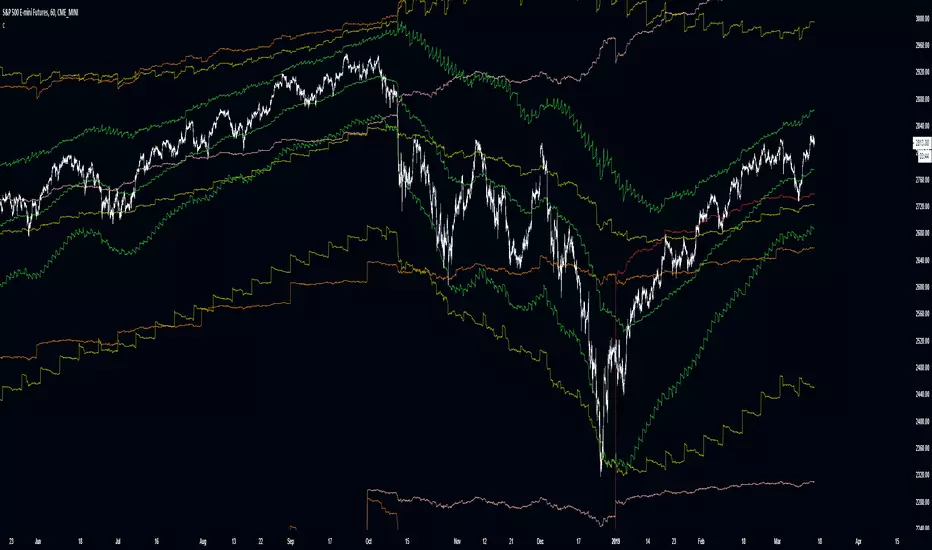
Improved Multi-Timeframe (MTF) 21 TRC - plots same as live dataThis multi-timeframe 21-period true range channel uses an improved calculation to accurately calculate the indicator's value with every new bar on the time frame your chart is set to. Previously the indicator only recalculated with every new update on the timeframe used in its security function. This means that this improved script plots the real, current value of your indicator across your chosen timeframes on your chart's resolution and no longer only plots only the indicator's monthly/weekly/daily/4 hour/ect closing value on the your chart.
This indicator uses a similar calculation the "Keltner Channel" indicator.
Input values are fixed to their default (close,21,3) configuration to make this indicator's improved calculation possible.
When using "Plot Higher Timeframe?" the script will set the indicator to only plot its value in closest larger timeframe. This option overrides the two following options. For example, when using the daily resolution , only the weekly value will plot, or when using the one hour (60m) resolution, only the 4 hour (240m) value will plot.
The "Omit Higher Timeframes?" option will set the indicator to only plot starting from the 1/2/3/4/5/6/7th closest larger timeframe. For example, when using the daily resolution and this option set to 0, all values from the weekly resolution and up will plot, but if set to 1, all values from the monthly resolution and up will plot instead.
The "Plot Yearly/Quarterly/Monthly/Weekly/Daily/4 Hour/1 Hour/15 Minute/5 Minute?" options allow enabling/disabling a specific timeframe. All are enabled by default. For example, if you do not want the yearly value of the indicator to ever plot, you can disable the "Plot Yearly?" option.