ATR% Table BoxATR Label Box. What this does Shows a live ATR% box Turns green if ATR% ≤ 5% Turns red if ATR% > 5% Updates only on the last bar (no clutter)Pine Script® indicatorby JWCHarris1
Watermark by HAZEDEnhanced Watermark - Clean Chart Labeling A professional watermark indicator for traders who want clean, customizable chart identification. Features: - Show/hide: Exchange prefix, timeframe, price change %, volume - 9 positioning options - place anywhere on your chart - Custom text styling - normal or spaced text modes - Full color control - including transparency settings - Size customization - independent sizing for each element - Personal signature - add your trading brand - Custom symbols - personalize arrows and indicators Perfect for: Content creators, educational posts, professional setups, and social media sharing. Easy to use: Works immediately with smart defaults. Fully customizable to match your style. Clean charts, professional presentation.Pine Script® indicatorby hazedoptionsUpdated 24
StyleLibraryLibrary "StyleLibrary" A small library of Pine Script functions that return built-in style variables. method sizeStyle(size) Takes a `string` that returns the corresponding built-in size style variable. Namespace types: series string, simple string, input string, const string Parameters: size (string) : A `string` representing a built-in size style: `"Tiny"`, `"Small"`, `"Normal"`, `"Large"`, `"Huge"`, `"Auto"`. Returns: The respective built-in size style variable. method sizeStyle(size) Takes a `sizeStyle` that returns the corresponding built-in size style variable. Namespace types: series sizeStyle Parameters: size (series sizeStyle) : A `sizeStyle` representing a built-in size style variable. Returns: The respective built-in size style variable. method lineStyle(style) Takes a `string` that returns the corresponding built-in line style variable. Namespace types: series string, simple string, input string, const string Parameters: style (string) : A `string` representing a built-in line style: `"Dashed"`, `"Dotted"`, `"Solid"`. Returns: The respective built-in line style variable. method lineStyle(style) Takes a `lineStyle` that returns the corresponding built-in line style variable. Namespace types: series lineStyle Parameters: style (series lineStyle) : A `lineStyle` representing a built-in line style variable. Returns: The respective built-in line style variable. method labelStyle(style) Takes a `string` that returns the corresponding built-in label style variable. Namespace types: series string, simple string, input string, const string Parameters: style (string) : A `string` representing a built-in label style: `"Arrow Down"`, `"Arrow Up"`, `"Circle"`, `"Cross"`, `"Diamond"`, `"Flag"`, `"Label Center"`, `"Label Down"`, `"Label Left"`, `"Label Lower Left"`, `"Label Lower Right"`, `"Label Right"`, `"Label Up"`, `"Label Upper Left"`, `"Label Upper Right"`, `"None"`, `"Square"`, `"Text Outline"`, `"Triangle Down"`, `"Triangle Up"`, `"XCross"`. Returns: The respective built-in label style variable. method labelStyle(style) Takes a `labelStyle` that returns the corresponding built-in label style variable. Namespace types: series labelStyle Parameters: style (series labelStyle) : A `labelStyle` representing a built-in label style variable. Returns: The respective built-in label style variable. method fontStyle(font) Takes a `string` that returns the corresponding built-in font style variable. Namespace types: series string, simple string, input string, const string Parameters: font (string) : A `string` representing a built-in font style: `"Default"`, `"Monospace"`. Returns: The respective built-in font style variable. method positionStyle(position) Takes a `string` that returns the corresponding built-in position style variable. Namespace types: series string, simple string, input string, const string Parameters: position (string) : A `string` representing a built-in position style: `"Bottom Center", `"Bottom Left", `"Bottom Right", `"Middle Center", `"Middle Left", `"Middle Right", `"Top Center", `"Top Left", `"Top Right". Returns: The respective built-in position style variable. method displayStyle(display) Takes a `simple string` that returns the corresponding built-in display style variable. Namespace types: simple string, input string, const string Parameters: display (simple string) : A `simple string` representing a built-in display style: `"All"`, `"Data Window"`, `"None"`, `"Pane"`, `"Price Scale"`, `"Status Line"`. Returns: The respective built-in display style variable.Pine Script® libraryby joebausUpdated 5
DeleteArrayType█ OVERVIEW Here are common functions usually delete drawing once array of drawing is recall. Method is used as in pine script version 5 instead of custom function. It is an upgrade from DeleteArrayObject , which may not support overload parameter in future. Library "DeleteArrayType" TODO: Delete array type especially for drawings method deleteLabel(id) TODO: Delete array Namespace types: array Parameters: id (array) Returns: TODO: label.delete() method deleteLine(id) TODO: Delete array Namespace types: array Parameters: id (array) Returns: TODO: line.delete() method deleteLineFill(id) TODO: Delete array Namespace types: array Parameters: id (array) Returns: TODO: linefill.delete() method deletePolyLine(id) TODO: Delete array Namespace types: array Parameters: id (array) Returns: TODO: polyline.delete() method deleteBox(id) TODO: Delete array Namespace types: array Parameters: id (array) Returns: TODO: box.delete() method deleteTable(id) TODO: Delete array Namespace types: array Parameters: id (array) Returns: TODO: table.delete()Pine Script® libraryby RozaniGhani-RG7
Multi MAs mit LabelA MA (Moving Average) is useful to identify a trend of an assets. The TradingView builtin indicator "Exponential Moving Average" is useful, but limited in some aspects: Bound to the active timeframe (e.g. h1) One MA per indicator instance. Makes it confusing when using multiple In reality to want to have multiple MAs with different types (EMA, SMA), length and timeframes on your chart to identify trading opportunities. As an example you can use the daily EMA12 and EMA21 to identify the trend and EMA200 on the h4 to enter a trade. That's what this script is used for. The provided script is an extension to the indicator powered by chipmonk (link to profile below). The original script let you add up to 8 EMAs that can be bound to any timeframe and length. The timeframe and length is displayed on the chart next to EMA. Unfortunately you can only add EMAs (Exponential Moving Averages) and no SMAs (Simple Moving Averages). That's why the script was extended. You can now choose the type (EMA or SMA) for up to 8 MAs. Links Profile of chipmonk Indicator by chipmonk Pine Script® indicatorby MrC0inSiXUpdated 77146
Price Cross Time Custom Range Interactive█ OVERVIEW This indicator was a time-based indicator and intended as educational purpose only based on pine script v5 functions for ta.cross() , ta.crossover() and ta.crossunder() . I realised that there is some overlap price with the cross functions, hence I integrate them into Custom Range Interactive with value variance and overlap displayed into table. This was my submission for Pinefest #1 , I decided to share this as public, I may accidentally delete this as long as i keep as private. █ INSPIRATION Inspired by design, code and usage of CAGR. Basic usage of custom range / interactive, pretty much explained here . Credits to TradingView. █ FEATURES 1. Custom Range Interactive 2. Label can be resize and change color. 3. Label show tooltip for price and time. 4. Label can be offset to improve readability. 5. Table can show price variance when any cross is true. 6. Table can show overlap if found crosss is overlap either with crossover and crossunder. 7. Table text color automatically change based on chart background (light / dark mode). 8. Source 2 is drawn as straight line, while Source 1 will draw as label either above line for crossover, below line for crossunder and marked 'X' if crossing with Source 2's line. 9. Cross 'X' label can be offset to improve readability. 10. Both Source 1 and Source 2 can select Open, Close, High and Low, which can be displayed into table. █ LIMITATIONS 1. Table is limited to intraday timeframe only as time format is not accurate for daily timeframe and above. Example daily timeframe will give result less 1 day from actual date. 2. I did not include other sources such external source or any built in sources such as hl2, hlc3, ohlc4 and hlcc4. █ CODE EXPLAINATION I pretty much create custom function with method which returns tuple value. method crossVariant(float price = na, chart.point ref = na) => cross = ta.cross( price, ref.price) over = ta.crossover( price, ref.price) under = ta.crossunder(price, ref.price) Unfortunately, I unable make the labels into array which i plan to return string value by getting the text value from array label, hence i use label.all and add incremental int value as reference. series label labelCross = na, labelCross.delete() var int num = 0 if over num += 1 labelCross := label.new() if under num += 1 labelCross := label.new() if cross num += 1 labelCross := label.new() I realised cross value can be overlap with crossover and crossunder, hence I add bool to enable force overlap and add additional bools. series label labelCross = na, labelCross.delete() var int num = 0 if forceOverlap if over num += 1 labelCross := label.new() if under num += 1 labelCross := label.new() if cross num += 1 labelCross := label.new() else if cross and over num += 1 labelCross := label.new() if cross and under num += 1 labelCross := label.new() if cross and not over and not under num += 1 labelCross := label.new() █ USAGE / EXAMPLES Pine Script® indicatorby RozaniGhani-RG163
Zigzag Chart Points█ OVERVIEW This indicator displays zigzag based on high and low using latest pine script version 5 , chart.point which using time, index and price as parameters. Pretty much a strip down using latest pine script function, without any use of library . This allow pine script user to have an idea of simplified and cleaner code for zigzag. █ CREDITS LonesomeTheBlue █ FEATURES 1. Label can be show / hide including text can be resized. 2. Hover to label, can see tooltip will show price and time. 3. Tooltip will show date and time for hourly timeframe and below while show date only for day timeframe and above. █ NOTES 1. I admit that chart.point just made the code much more cleaner and save more time. I previously using user-defined type(UDT) which quite hassle. 2. I have no plan to extend this indicator or include alert just I thinking to explore log.error() and runtime.error() , which I may probably release in other publications. █ HOW TO USE' Pretty much similar inside mentioned references, which previously I created. █ REFERENCES 1. Zigzag Array Experimental 2. Simple Zigzag UDT 3. Zig Zag Ratio Simplified 4. Cyclic RSI High Low With Noise Filter 5. Auto AB=CD 1 to 1 Ratio ExperimentalPine Script® indicatorby RozaniGhani-RGUpdated 77 1 K
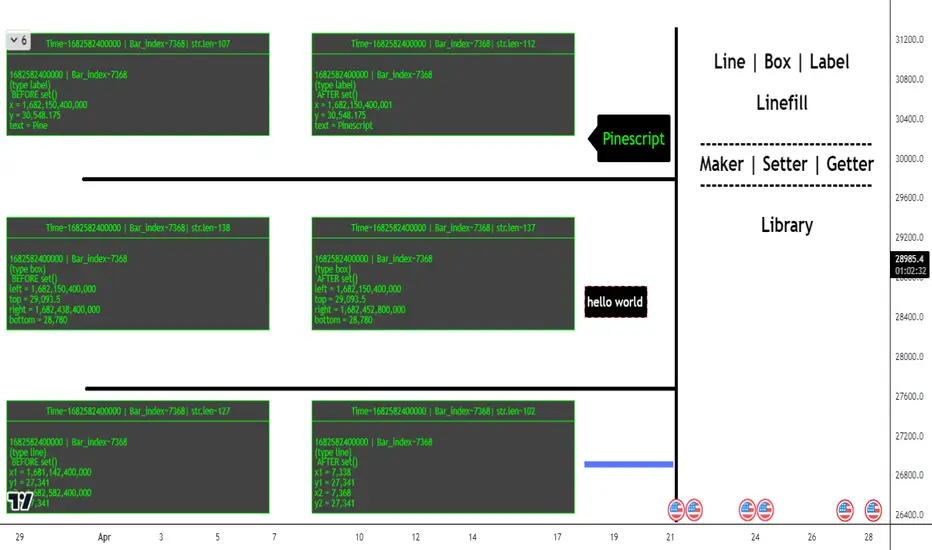
ObjectHelpersLibrary "ObjectHelpers" Line | Box | Label | Linefill -- Maker, Setter, Getter Library TODO: add table functionality set(object) set all params for `line`, `box`, `label`, `linefill` objects with 1 function *** ## Overloaded *** ``` method set(line Line, int x1=na, float y1=na, int x2=na, float y2=na,string xloc=na,string extend=na,color color=na,string style=na,int width=na,bool update=na) => line ``` ### Params - **Line** `line` - line object | `required` - **x1** `int` - value to set x1 - **y1** `float` - value to set y1 - **x2** `int` - value to set x2 - **y2** `float` - value to set y2 - **xloc** `int` - value to set xloc - **yloc** `int` - value to set yloc - **extend** `string` - value to set extend - **color** `color` - value to set color - **style** `string` - value to set style - **width** `int` - value to set width - **update** `bool` - value to set update *** ``` method set(box Box,int left=na,float top=na,int right=na, float bottom=na,color bgcolor=na,color border_color=na,string border_style=na,int border_width=na,string extend=na,string txt=na,color text_color=na,string text_font_family=na,string text_halign=na,string text_valign=na,string text_wrap=na,bool update=false) => box ``` ### Params - **Box** `box` - box object - **left** `int` - value to set left - **top** `float` - value to set top - **right** `int` - value to set right - **bottom** `float` - value to set bottom - **bgcolor** `color` - value to set bgcolor - **border_color** `color` - value to set border_color - **border_style** `string` - value to set border_style - **border_width** `int` - value to set border_width - **extend** `string` - value to set extend - **txt** `string` - value to set _text - **text_color** `color` - value to set text_color - **text_font_family** `string` - value to set text_font_family - **text_halign** `string` - value to set text_halign - **text_valign** `string` - value to set text_valign - **text_wrap** `string` - value to set text_wrap - **update** `bool` - value to set update *** ``` method set(label Label,int x=na,float y=na, string txt=na,string xloc=na,color color=na,color textcolor=na,string size=na,string style=na,string textalign=na,string tooltip=na,string text_font_family=na,bool update=false) => label ``` ### Paramas - **Label** `label` - label object - **x** `int` - value to set x - **y** `float` - value to set y - **txt** `string` - value to set text add`"+++"` to the _text striing to have the current label text concatenated to the location of the "+++") - **textcolor** `color` - value to set textcolor - **size** `string` - value to set size - **style** `string` - value to set style (use "flip" ,as the style to have label flip to top or bottom of bar depending on if open > close and vice versa) - **text_font_family** `string` - value to set text_font_family - **textalign** `string` - value to set textalign - **tooltip** `string` - value to set tooltip - **update** `bool` - update label to next bar *** ``` method set(linefill Linefill=na,line line1=na,line line2=na,color color=na) => linefill ``` ### Params - **linefill** `linefill` - linefill object - **line1** `line` - line object - **line2** `line` - line object - **color** `color` - color Parameters: object (obj) Returns: `line`, `box`, `label`, `linefill` method set(Line, x1, y1, x2, y2, xloc, extend, color, style, width, update) set the location params of a line with 1 function auto detects time or bar_index for xloc param Namespace types: series line Parameters: Line (line) : `line` - line object | `required` x1 (int) : `int` - value to set x1 y1 (float) : `float` - value to set y1 x2 (int) : `int` - value to set x2 y2 (float) : `float` - value to set y2 xloc (string) : `int` - value to set xloc extend (string) : `string` - value to set extend color (color) : `color` - value to set color style (string) : `string` - value to set style width (int) : `int` - value to set width update (bool) : `bool` - value to set update Returns: `line` method set(Box, left, top, right, bottom, bgcolor, border_color, border_style, border_width, extend, txt, text_color, text_font_family, text_halign, text_valign, text_wrap, update) set the location params of a box with 1 function Namespace types: series box Parameters: Box (box) : `box` - box object | `required` left (int) : `int` - value to set left top (float) : `float` - value to set top right (int) : `int` - value to set right bottom (float) : `float` - value to set bottom bgcolor (color) : `color` - value to set bgcolor border_color (color) : `color` - value to set border_color border_style (string) : `string` - value to set border_style border_width (int) : `int` - value to set border_width extend (string) : `string` - value to set extend txt (string) : `string` - value to set _text text_color (color) : `color` - value to set text_color text_font_family (string) : `string` - value to set text_font_family text_halign (string) : `string` - value to set text_halign text_valign (string) : `string` - value to set text_valign text_wrap (string) : `string` - value to set text_wrap update (bool) : `bool` - value to set update Returns: `box` method set(Label, x, y, txt, xloc, color, textcolor, size, style, textalign, tooltip, text_font_family, update) set the location params of a label with 1 function auto detects time or bar_index for xloc param Namespace types: series label Parameters: Label (label) : `label` | `required` x (int) : `int` - value to set x y (float) : `float` - value to set y txt (string) : `string` - value to set text add`"+++"` to the _text striing to have the current label text concatenated to the location of the "+++") xloc (string) color (color) textcolor (color) : `color` - value to set textcolor size (string) : `string` - value to set size style (string) : `string` - value to set style (use "flip" ,as the style to have label flip to top or bottom of bar depending on if open > close and vice versa) textalign (string) : `string` - value to set textalign tooltip (string) : `string` - value to set tooltip text_font_family (string) : `string` - value to set text_font_family update (bool) : `bool` - update label to next bar Returns: `label` method set(Linefill, line1, line2, color) change the 1 or 2 of the lines in a linefill object Namespace types: series linefill Parameters: Linefill (linefill) line1 (line) : `line` - line object line2 (line) : `line` - line object color (color) : `color` - color Returns: `linefill` get(object) get all of the location variables for `line`, `box`, `label` objects or the line objects from a `linefill` *** ## Overloaded *** ``` method get(line Line) => ``` ### Params - **Line** `line` - line object | `required` *** ``` method get(box Box) => ``` ### Params - **Box** `box` - box object | `required` *** ``` method get(label Label) => ``` ### Paramas - **Label** `label` - label object | `required` *** ``` method get(linefill Linefill) => ``` ### Params - **Linefill** `linefill` - linefill object | `required` Parameters: object (obj) Returns: ` ` method get(Line) Gets the location paramaters of a Line Namespace types: series line Parameters: Line (line) : `line` - line object Returns: method get(Box) Gets the location paramaters of a Box Namespace types: series box Parameters: Box (box) : `box` - box object Returns: method get(Label) Gets the `x`, `y`, `text` of a Label Namespace types: series label Parameters: Label (label) : `label` - label object Returns: method get(Linefill) Gets `line 1`, `line 2` from a Linefill Namespace types: series linefill Parameters: Linefill (linefill) : `linefill` - linefill object Returns: method set_x(Line, x1, x2) set the `x1`, `x2` of a line *** ### Params - **Line** `line` - line object | `required` - **x1** `int` - value to set x1 | `required` - **x2** `int` - value to set x2 | `required` Namespace types: series line Parameters: Line (line) : `line` - line object x1 (int) : `int` - value to set x1 x2 (int) : `int` - value to set x2 Returns: `line` method set_y(Line, y1, y2) set `y1`, `y2` of a line *** ### Params - **Line** `line` - line object | `required` - **y1** `float` - value to set y1 | `required` - **y2** `float` - value to set y2 | `required` Namespace types: series line Parameters: Line (line) : `line` - line object y1 (float) : `float` - value to set y1 y2 (float) : `float` - value to set y2 Returns: `line` method Line(x1, y1, x2, y2, extend, color, style, width) Similar to `line.new()` but can detect time or bar_index for xloc param and has defaults for all params but `x1`, `y1`, `x2`, `y2` *** ### Params - **x1** `int` - value to set - **y1** `float` - value to set - **x2** `int` - value to set - **y2** `float` - value to set - **extend** `string` - extend value to set line - **color** `color` - color to set line - **style** `string` - style to set line - **width** `int` - width to set line Namespace types: series int, simple int, input int, const int Parameters: x1 (int) : `int` - value to set y1 (float) : `float` - value to set x2 (int) : `int` - value to set y2 (float) : `float` - value to set extend (string) : `string` - extend value to set line color (color) : `color` - color to set line style (string) : `string` - style to set line width (int) : `int` - width to set line Returns: `line` method Box(left, top, right, bottom, extend, border_color, bgcolor, text_color, border_width, border_style, txt, text_halign, text_valign, text_size, text_wrap) similar to box.new() with the but can detect xloc param and has defaults for everything but location params *** ### Params - **left** `int` - value to set - **top** `float` - value to set - **right** `int` - value to set - **bottom** `float` - value to set - **extend** `string` - extend value to set box - **border_color** `color` - color to set border - **bgcolor** `color` - color to set background - **text_color** `color` - color to set text - **border_width** `int` - width to set border - **border_style** `string` - style to set border - **txt** `string` - text to set - **text_halign** `string` - horizontal alignment to set text - **text_valign** `string` - vertical alignment to set text - **text_size** `string` - size to set text - **text_wrap** `string` - wrap to set text Namespace types: series int, simple int, input int, const int Parameters: left (int) : `int` - value to set top (float) : `float` - value to set right (int) : `int` - value to set bottom (float) : `float` - value to set extend (string) : `string` - extend value to set box border_color (color) : `color` - color to set border bgcolor (color) : `color` - color to set background text_color (color) : `color` - color to set text border_width (int) : `int` - width to set border border_style (string) : `string` - style to set border txt (string) : `string` - text to set text_halign (string) : `string` - horizontal alignment to set text text_valign (string) : `string` - vertical alignment to set text text_size (string) : `string` - size to set text text_wrap (string) : `string` - wrap to set text Returns: `box` method Label(txt, x, y, yloc, color, textcolor, style, size, textalign, text_font_family, tooltip) Similar to label.new() but can detect time or bar_index for xloc param and has defaults for all params but x, y, txt, tooltip *** ### Params - **txt** `string` - string to set - **x** `int` - value to set - **y** `float` - value to set - **yloc** `string` - y location to set - **color** `color` - label color to set - **textcolor** `color` - text color to set - **style** `string` - style to set - **size** `string` - size to set - **textalign** `string` - text alignment to set - **text_font_family** `string` - font family to set - **tooltip** `string` - tooltip to set Namespace types: series string, simple string, input string, const string Parameters: txt (string) : `string` - string to set x (int) : `int` - value to set y (float) : `float` - value to set yloc (string) : `string` - y location to set color (color) : `color` - label color to set textcolor (color) : `color` - text color to set style (string) : `string` - style to set size (string) : `string` - size to set textalign (string) : `string` - text alignment to set text_font_family (string) : `string` - font family to set tooltip (string) : `string` - tooltip to set Returns: `label` obj Fields: obj (series__string)Pine Script® libraryby FFriZzUpdated 6
Price & Percentage Change LabelFairly straightforward script that allows you to plot the current price and % either above the last candle and/or to the right of it. There's also 2 price "follow" lines that you can turn off and on, much like the bid/ask line that's built in to TV. You can also choose to enable a specific % above/below current price to give you an idea on where price would be with a move north or south by X % amount from current price. Pine Script® indicatorby MYNAMEISBRANDONUpdated 22125
Educational: lines, linefill, labels & boxesThis educational script contains different examples regarding lines , linefill , labels & boxes First part shows the use of array.new() without first retrieving line.new() which then are put in a linefill.new() At every start of the week a linefill.new() is added with the top line being previous Weekly high , and the bottom line being previous Weekly low , if close doesn't go above top line, or below bottom line, both lines will be made longer with 1 bar_index ( line.set_x2 ), otherwise the lines stop, and change color Please read the comments in the script as well Cheers!Pine Script® indicatorby fikira1010229
Dragon Double RSI Overbought-Oversold With LabelThis indicator consist of tow RSI length that user can customize it. like length, overbought, oversold. like length, overbought, oversold. also it has one moving average where the user can select from different types of moving averages, price sources, lookback periods and resolutionsPine Script® indicatorby Dragon_trader95Updated 44123
DeleteArrayObject█ OVERVIEW Delete array object according to array size such as label, line, linefill, box and table. █ CREDITS HeWhoMustNotBeNamedPine Script® libraryby RozaniGhani-RG3
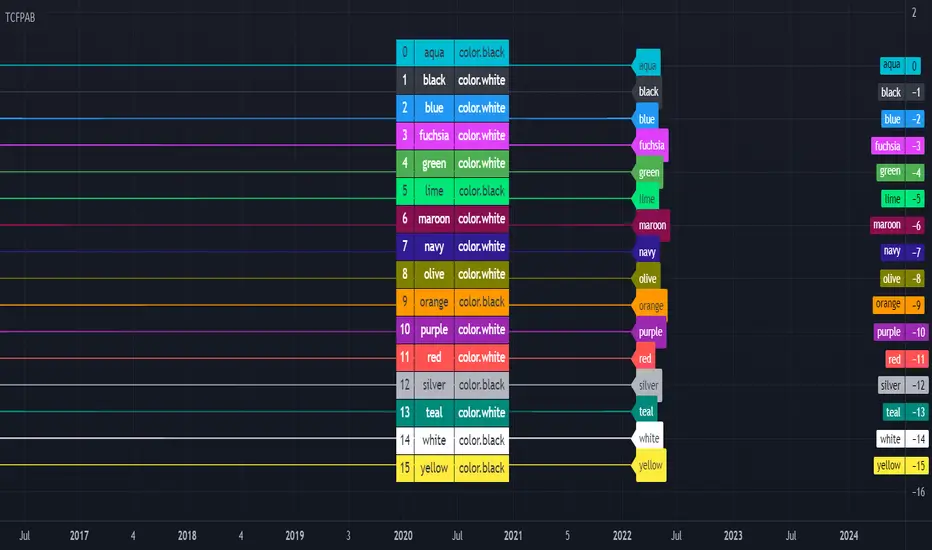
[HELPER] Table Color For Pairing Black And White█ OVERVIEW This helper intend to simplify which color pair better with black or white color, may help some pine coders. █ INSPIRATION This color choice was inspired during plot especially user enable dark color theme. Color displayed at table and label are based on Indicator name label and Indicator last value label displayed at Scales. █ FEATURES Color can be tick to be inverted color. Display table by changing table position and font size. Pine Script® indicatorby RozaniGhani-RGUpdated 1172
ObjectStackLibrary "ObjectStack" init() push() push() push() push() push() nextIndex() nextIndex() nextIndex() nextIndex() nextIndex() delete() delete() delete() delete() delete() cleanOldest() cleanOldest() cleanOldest() cleanOldest() cleanOldest() Pine Script® libraryby cryptolinxUpdated 10
Hold Up A Second! (Demo)This indicator is sample code that you can customize. It selectively displays a label based on how severe a warning should be. Simply add it to your chart, then open the code to make a copy for your own use. Normally I would make this a library, but because libraries can't retain state (yet) and pine script doesn't allow classes (yet), I thought this would be nice to share as I find value in it myself.Pine Script® indicatorby Electrified50
LabelHelperLibrary "LabelHelper" Utility for managing active labels on the chart. add(level, txt, labelColor, textColor) For displaying a lable at the last bar. Parameters: level : The value to display the label at. txt : The text to show on the label. labelColor : The color of the label. textColor : The text color of the label. Returns: The label being managed.Pine Script® libraryby ElectrifiedUpdated 19
INDIGO - Cloud System ©INDIGO Cloud System © This script shows the monthly dip and peak zones and the daily highs & lows. The green zone is the dip zone. It's the place to enter a long position if you think there is or will be a reversal. The red zone is the peak zone. It's the place to enter a short position if you think there is or will be a reversal. The script uses the INDIGO Cloud System ©, the Ultimate RSI and the Market Direction Indicator to find an entry at the most optimal point in space and time. The exit for the long trade is on the purple line and the exit for the short trade is on the blue line. It also has an RSI exit to minimize the risk of a sudden reversal in the wrong direction while in trade. You can set TP and SL to see the effects of it on the chart. Be aware that these change a lot of trades so use it wisely. The labels are connected to alerts to notify you of a possible entry or exit. This script uses the Ultimate RSI by ChrisMoody, thanks for creating this Chris ! This script also uses the Market Direction Indicator by LazyBear, great script ! You can use the MD Filter to filter out some bad trades. It decreases losses but also some profits. Experiment with the settings, each pairing needs different settings. --> Use this script at your own risk. Do your own research, never invest money you're not willing to lose and never put your trust in one indicator ! To my best knowledge this script doesn't repaint. I never use the close and only use high/low when value can't be untrue again. If you find repainting in this script PLEASE let me know ! Feel free to contact me for questions or feedback. Enjoy the script :) Pine Script® indicatorby TrendSniper1989Updated 44270
LabelsLibrary "Labels" Functions to create labels, from simple to complex. labelSimple() Creates a label each time a condition is true. All label parameters can be customised. _condition The condition which must evaluate true for the label to be printed. _x The x location. _y The y location. _text The text to print on the label. _color The colour of the label. _textColor The colour of the text. _style The style of the label. _yloc The y location type. Returns An unnamed label object with the supplied characteristics. To give it a name, assign the output of the function to a label variable, as in the example below. labelLast() Creates a label each time a condition is true. All label parameters can be customised. + Option to keep only the most recent label. + Option to display the label a configurable number of bars ahead. _offset How many bars ahead to draw the label. _keepLast If true (the default), keeps only the most recent label. If false, prints labels up to the TradingView limit. _condition The condition which must evaluate true for the label to be printed. _y The y location. _text The text to print on the label. _color The colour of the label. _textColor The colour of the text. _style The style of the label. _yloc The y location type. Returns A named label object with the supplied characteristics. labelTextAndFloat() Creates a label each time a condition is true. All label parameters can be customised. Option to keep only the most recent label. Option to display the label a configurable number of bars ahead; otherwise the x location is fixed at the bar time. + Prints (optional) text and a floating-point number on the next line. _offset How many bars ahead to draw the label. _float The floating-point number that you want to display on the label. _keepLast If true (the default), keeps only the most recent label. If false, prints labels up to the TradingView limit. _condition The condition which must evaluate true for the label to be printed. _y The y location. _text The text to print on the label. _color The colour of the label. _textColor The colour of the text. _style The style of the label. _yloc The y location type. Returns A named label object with the supplied characteristics. labelTextAndFloatSigFig() Creates a label each time a condition is true. All label parameters can be customised. Option to keep only the most recent label. Option to display the label a configurable number of bars ahead; otherwise the x location is fixed at the bar time. Prints (optional) text and a floating-point number on the next line + to a given number of significant figures. _offset How many bars ahead to draw the label. _sigNumFig The number of significant figures to display the floating-point number to. _float The floating-point number that you want to display on the label. _keepLast If true (the default), keeps only the most recent label. If false, prints labels up to the TradingView limit. _condition The condition which must evaluate true for the label to be printed. _y The y location. _text The text to print on the label. _color The colour of the label. _textColor The colour of the text. _style The style of the label. _yloc The y location type. Returns A named label object with the supplied characteristics. labelTextAndFloatDecimals() Creates a label each time a condition is true. All label parameters can be customised. Option to keep only the most recent label. Option to display the label a configurable number of bars ahead. Prints (optional) text and a floating-point number on the next line + to a given number of decimal places. _offset How many bars ahead to draw the label. _decimals The number of decimal places to display the floating-point number to. _float The floating-point number that you want to display on the label. _keepLast If true (the default), keeps only the most recent label. If false, prints labels up to the TradingView limit. _condition The condition which must evaluate true for the label to be printed. _y The y location. _text The text to print on the label. _color The colour of the label. _textColor The colour of the text. _style The style of the label. _yloc The y location type. Returns A named label object with the supplied characteristics.Pine Script® libraryby SimpleCryptoLifeUpdated 1130
SignalProcessingClusteringKMeansLibrary "SignalProcessingClusteringKMeans" K-Means Clustering Method. nearest(point_x, point_y, centers_x, centers_y) finds the nearest center to a point and returns its distance and center index. Parameters: point_x : float, x coordinate of point. point_y : float, y coordinate of point. centers_x : float array, x coordinates of cluster centers. centers_y : float array, y coordinates of cluster centers. @ returns tuple of int, float. bisection_search(samples, value) Bissection Search Parameters: samples : float array, weights to compare. value : float array, weights to compare. Returns: int. label_points(points_x, points_y, centers_x, centers_y) labels each point index with cluster index and distance. Parameters: points_x : float array, x coordinates of points. points_y : float array, y coordinates of points. centers_x : float array, x coordinates of points. centers_y : float array, y coordinates of points. Returns: tuple with int array, float array. kpp(points_x, points_y, n_clusters) K-Means++ Clustering adapted from Andy Allinger. Parameters: points_x : float array, x coordinates of the points. points_y : float array, y coordinates of the points. n_clusters : int, number of clusters. Returns: tuple with 2 arrays, float array, int array.Pine Script® libraryby RicardoSantos88100
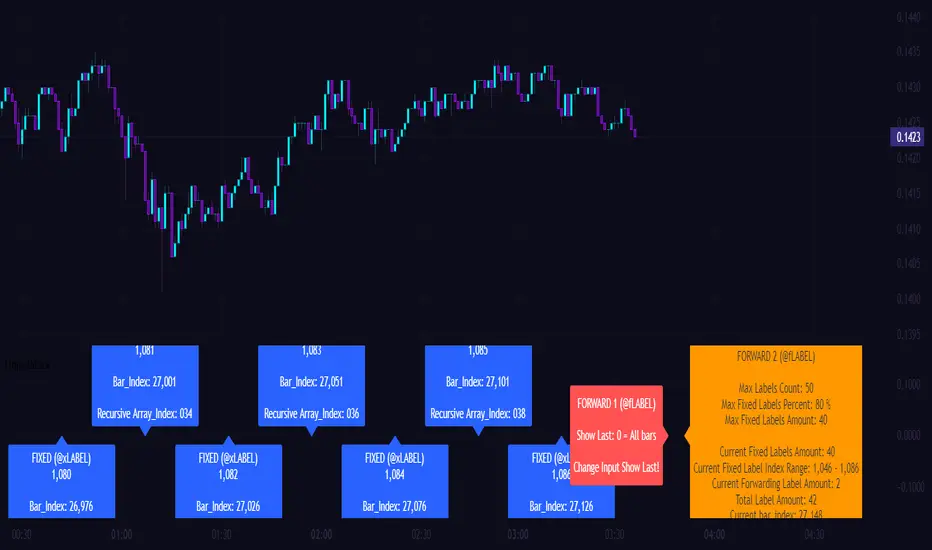
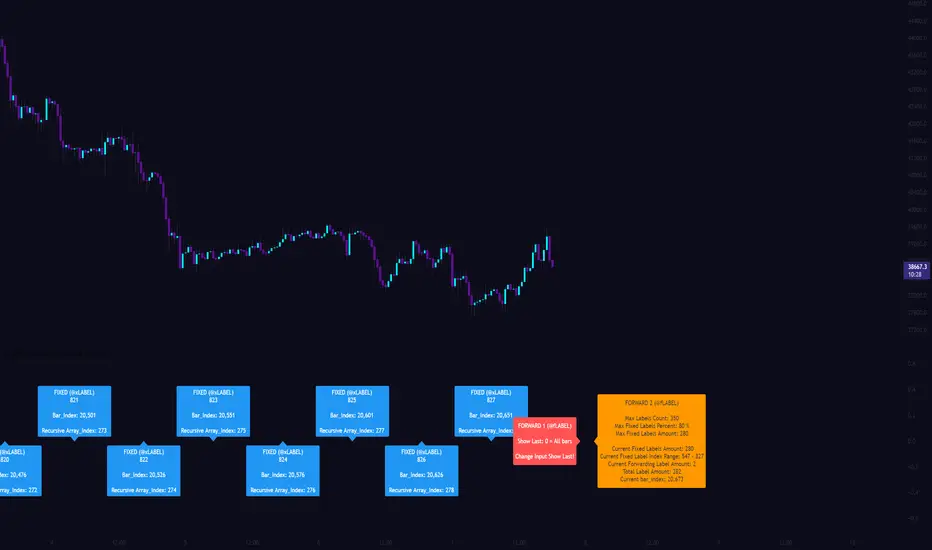
[CLX][#03] Object-Stack (Labels/Lines/Boxes)This script shows an example of how to manage objects (lines/labels/boxes) and prevent the need of garbage collecting and missing objects. You only have to push your object into the right array. *_FIXED (left-lock) or *_FORWARD (right-lock) We hope you enjoy it! 🎉 CRYPTOLINX - jango_blockchained 😊👍 Disclaimer: Trading success is all about following your trading strategy and the indicators should fit within your trading strategy, and not to be traded upon solely. The script is for informational and educational purposes only. Use of the script does not constitute professional and/or financial advice. You alone have the sole responsibility of evaluating the script output and risks associated with the use of the script. In exchange for using the script, you agree not to hold cryptolinx TradingView user liable for any possible claim for damages arising from any decision you make based on use of the script.Pine Script® indicatorby cryptolinxUpdated 3331
Pinescript - Common Label & Line Array Functions Library by RRBPinescript - Common Label & Line Array Functions Library by RagingRocketBull 2021 Version 1.0 This script provides a library of common array functions for arrays of label and line objects with live testing of all functions. Using this library you can easily create, update, delete, join label/line object arrays, and get/set properties of individual label/line object array items. You can find the full list of supported label/line array functions below. There are several libraries: - Common String Functions Library - Standard Array Functions Library - Common Fixed Type Array Functions Library - Common Label & Line Array Functions Library - Common Variable Type Array Functions Library Features: - 30 array functions in categories create/update/delete/join/get/set with support for both label/line objects (45+ including all implementations) - Create, Update label/line object arrays from list/array params - GET/SET properties of individual label/line array items by index - Join label/line objects/arrays into a single string for output - Supports User Input of x,y coords of 5 different types: abs/rel/rel%/inc/inc% list/array, auto transforms x,y input into list/array based on type, base and xloc, translates rel into abs bar indexes - Supports User Input of lists with shortened names of string properties, auto expands all standard string properties to their full names for use in functions - Live Output for all/selected functions based on User Input. Test any function for possible errors you may encounter before using in script. - Output filters: hide all excluded and show only allowed functions using a list of function names - Output Panel customization options: set custom style, color, text size, and line spacing Usage: - select create function - create label/line arrays from lists or arrays (optional). Doesn't affect the update functions. The only change in output should be function name regardless of the selected implementation. - specify num_objects for both label/line arrays (default is 7) - specify common anchor point settings x,y base/type for both label/line arrays and GET/SET items in Common Settings - fill lists with items to use as inputs for create label/line array functions in Create Label/Line Arrays section - specify label/line array item index and properties to SET in corresponding sections - select label/line SET function to see the changes applied live Code Structure: - translate x,y depending on x,y type, base and xloc as specified in UI (required for all functions) - expand all shortened standard property names to full names (required for create/update* from arrays and set* functions, not needed for create/update* from lists) to prevent errors in label.new and line.new - create param arrays from string lists (required for create/update* from arrays and set* functions, not needed for create/update* from lists) - create label/line array from string lists (property names are auto expanded) or param arrays (requires already expanded properties) - update entire label/line array or - get/set label/line array item properties by index Transforming/Expanding Input values: - for this script to work on any chart regardless of price/scale, all x*,y* are specified as % increase relative to x0,y0 base levels by default, but user can enter abs x,price values specific for that chart if necessary. - all lists can be empty, contain 1 or several items, have the same/different lengths. Array Length = min(min(len(list*)), mum_objects) is used to create label/line objects. Missing list items are replaced with default property values. - when a list contains only 1 item it is duplicated (label name/tooltip is also auto incremented) to match the calculated Array Length - since this script processes user input, all x,y values must be translated to abs bar indexes before passing them to functions. Your script may provide all data internally and doesn't require this step. - at first int x, float y arrays are created from user string lists, transformed as described below and returned as x,y arrays. - translated x,y arrays can then be passed to create from arrays function or can be converted back to x,y string lists for the create from lists function if necessary. - all translation logic is separated from create/update/set functions for the following reasons: - to avoid redundant code/dependency on ext functions/reduce local scopes and to be able to translate everything only once in one place - should be faster - to simplify internal logic of all functions - because your script may provide all data internally without user input and won't need the translation step - there are 5 types available for both x,y: abs, rel, rel%, inc, inc%. In addition to that, x can be: bar index or time, y is always price. - abs - absolute bar index/time from start bar0 (x) or price (y) from 0, is >= 0 - rel - relative bar index/time from cur bar n (x) or price from y0 base level, is >= 0 - rel% - relative % increase of bar index/time (x) or price (y) from corresponding base level (x0 or y0), can be <=> 0 - inc - relative increment (step) for each new level of bar index/time (x) or price (y) from corresponding base level (x0 or y0), can be <=> 0 - inc% - relative % increment (% step) for each new level of bar index/time (x) or price (y) from corresponding base level (x0 or y0), can be <=> 0 - x base level >= 0 - y base level can be 0 (empty) or open, close, high, low of cur bar - single item x1_list = "50" translates into: - for x type abs: "50, 50, 50 ..." num_objects times regardless of xloc => x = 50 - for x type rel: "50, 50, 50 ... " num_objects times => x = x_base + 50 - for x type rel%: "50%, 50%, 50% ... " num_objects times => x_base * (1 + 0.5) - for x type inc: "0, 50, 100 ... " num_objects times => x_base + 50 * i - for x type inc%: "0%, 50%, 100% ... " num_objects times => x_base * (1 + 0.5 * i) - when xloc = xloc.bar_index each rel*/inc* value in the above list is then subtracted from n: n - x to convert rel to abs bar index, values of abs type are not affected - x1_list = "0, 50, 100, ..." of type rel is the same as "50" of type inc - x1_list = "50, 50, 50, ..." of type abs/rel/rel% produces a sequence of the same values and can be shortened to just "50" - single item y1_list = "2" translates into (ragardless of yloc): - for y type abs: "2, 2, 2 ..." num_objects times => y = 2 - for y type rel: "2, 2, 2 ... " num_objects times => y = y_base + 2 - for y type rel%: "2%, 2%, 2% ... " num_objects times => y = y_base * (1 + 0.02) - for y type inc: "0, 2, 4 ... " num_objects times => y = y_base + 2 * i - for y type inc%: "0%, 2%, 4% ... " num_objects times => y = y_base * (1 + 0.02 * i) - when yloc != yloc.price all calculated values above are simply ignored - y1_list = "0, 2, 4" of type rel% is the same as "2" with type inc% - y1_list = "2, 2, 2" of type abs/rel/rel% produces a sequence of the same values and can be shortened to just "2" - you can enter shortened property names in lists. To lookup supported shortened names use corresponding dropdowns in Set Label/Line Array Item Properties sections - all shortened standard property names must be expanded to full names (required for create/update* from arrays and set* functions, not needed for create/update* from lists) to prevent errors in label.new and line.new - examples of shortened property names that can be used in lists: bar_index, large, solid, label_right, white, left, left, price - expanded to their corresponding full names: xloc.bar_index, size.large, line.style_solid, label.style_label_right, color.white, text.align_left, extend.left, yloc.price - all expanding logic is separated from create/update* from arrays and set* functions for the same reasons as above, and because param arrays already have different types, implying the use of final values. - all expanding logic is included in the create/update* from lists functions because it seemed more natural to process string lists from user input directly inside the function, since they are already strings. Creating Label/Line Objects: - use study max_lines_count and max_labels_count params to increase the max number of label/line objects to 500 (+3) if necessary. Default number of label/line objects is 50 (+3) - all functions use standard param sequence from methods in reference, except style always comes before colors. - standard label/line.get* functions only return a few properties, you can't read style, color, width etc. - label.new(na, na, "") will still create a label with x = n-301, y = NaN, text = "" because max default scope for a var is 300 bars back. - there are 2 types of color na, label color requires color(na) instead of color_na to prevent error. text_color and line_color can be color_na - for line to be visible both x1, x2 ends must be visible on screen, also when y1 == y2 => abs(x1 - x2) >= 2 bars => line is visible - xloc.bar_index line uses abs x1, x2 indexes and can only be within 0 and n ends, where n <= 5000 bars (free accounts) or 10000 bars (paid accounts) limit, can't be plotted into the future - xloc.bar_time line uses abs x1, x2 times, can't go past bar0 time but can continue past cur bar time into the future, doesn't have a length limit in bars. - xloc.bar_time line with length = exact number of bars can be plotted only within bar0 and cur bar, can't be plotted into the future reliably because of future gaps due to sessions on some charts - xloc.bar_index line can't be created on bar 0 with fixed length value because there's only 1 bar of horiz length - it can be created on cur bar using fixed length x < n <= 5000 or - created on bar0 using na and then assigned final x* values on cur bar using set_x* - created on bar0 using n - fixed_length x and then updated on cur bar using set_x*, where n <= 5000 - default orientation of lines (for style_arrow* and extend) is from left to right (from bar 50 to bar 0), it reverses when x1 and x2 are swapped - price is a function, not a line object property Variable Type Arrays: - you can't create an if/function that returns var type value/array - compiler uses strict types and doesn't allow that - however you can assign array of any type to another array of any type creating an arr pointer of invalid type that must be reassigned to a matching array type before used in any expression to prevent error - create_any_array2 uses this loophole to return an int_arr pointer of a var type array - this works for all array types defined with/without var keyword and doesn't work for string arrays defined with var keyword for some reason - you can't do this with var type vars, only var type arrays because arrays are pointers passed by reference, while vars are actual values passed by value. - you can only pass a var type value/array param to a function if all functions inside support every type - otherwise error - alternatively values of every type must be passed simultaneously and processed separately by corresponding if branches/functions supporting these particular types returning a common single type result - get_var_types solves this problem by generating a list of dummy values of every possible type including the source type, tricking the compiler into allowing a single valid branch to execute without error, while ignoring all dummy results Notes: - uses Pinescript v3 Compatibility Framework - uses Common String Functions Library, Common Fixed Type Array Functions Library, Common Variable Type Array Functions Library - has to be a separate script to reduce the number of local scopes/compiled file size, can't be merged with another library. - lets you live test all label/line array functions for errors. If you see an error - change params in UI - if you see "Loop too long" error - hide/unhide or reattach the script - if you see "Chart references too many candles" error - change x type or value between abs/rel*. This can happen on charts with 5000+ bars when a rel bar index x is passed to label.new or line.new instead of abs bar index n - x - create/update_label/line_array* use string lists, while create/update_label/line_array_from_arrays* use array params to create label/line arrays. "from_lists" is dropped to shorten the names of the most commonly used functions. - create_label/line_array2,4 are preferable, 5,6 are listed for pure demonstration purposes only - don't use them, they don't improve anything but dramatically increase local scopes/compiled file size - for this reason you would mainly be using create/update_label/line_array2,4 for list params or create/update_label/line_array_from_arrays2 for array params - all update functions are executed after each create as proof of work and can be disabled. Only create functions are required. Use update functions when necessary - when list/array params are changed by your script. - both lists and array item properties use the same x,y_type, x,y_base from common settings - doesn't use pagination, a single str contains all output - why is this so complicated? What are all these functions for? - this script merges standard label/line object methods with standard array functions to create a powerful set of label/line object array functions to simplify manipulation of these arrays. - this library also extends the functionality of Common Variable Type Array Functions Library providing support for label/line types in var type array functions (any_to_str6, join_any_array5) - creating arrays from either lists or arrays adds a level of flexibility that comes with complexity. It's very likely that in your script you'd have to deal with both string lists as input, and arrays internally, once everything is converted. - processing user input, allowing customization and targeting for any chart adds a whole new layer of complexity, all inputs must be translated and expanded before used in functions. - different function implementations can increase/reduce local scopes and compiled file size. Select a version that best suits your needs. Creating complex scripts often requires rewriting your code multiple times to fit the limits, every line matters. P.S. Don't rely too much on labels, for too often they are fables. List of functions*: * - functions from other libraries are not listed 1. Join Functions Labels - join_label_object(label_, d1, d2) - join_label_array(arr, d1, d2) - join_label_array2(arr, d1, d2, d3) Lines - join_line_object(line_, d1, d2) - join_line_array(arr, d1, d2) - join_line_array2(arr, d1, d2, d3) Any Type - any_to_str6(arr, index, type) - join_any_array4(arr, d1, d2, type) - join_any_array5(arr, d, type) 2. GET/SET Functions Labels - label_array_get_text(arr, index) - label_array_get_xy(arr, index) - label_array_get_fields(arr, index) - label_array_set_text(arr, index, str) - label_array_set_xy(arr, index, x, y) - label_array_set_fields(arr, index, x, y, str) - label_array_set_all_fields(arr, index, x, y, str, xloc, yloc, label_style, label_color, text_color, text_size, text_align, tooltip) - label_array_set_all_fields2(arr, index, x, y, str, xloc, yloc, label_style, label_color, text_color, text_size, text_align, tooltip) Lines - line_array_get_price(arr, index, bar) - line_array_get_xy(arr, index) - line_array_get_fields(arr, index) - line_array_set_text(arr, index, width) - line_array_set_xy(arr, index, x1, y1, x2, y2) - line_array_set_fields(arr, index, x1, y1, x2, y2, width) - line_array_set_all_fields(arr, index, x1, y1, x2, y2, xloc, extend, line_style, line_color, width) - line_array_set_all_fields2(arr, index, x1, y1, x2, y2, xloc, extend, line_style, line_color, width) 3. Create/Update/Delete Functions Labels - delete_label_array(label_arr) - create_label_array(list1, list2, list3, list4, list5, d) - create_label_array2(x_list, y_list, str_list, xloc_list, yloc_list, style_list, color1_list, color2_list, size_list, align_list, tooltip_list, d) - create_label_array3(x_list, y_list, str_list, xloc_list, yloc_list, style_list, color1_list, color2_list, size_list, align_list, tooltip_list, d) - create_label_array4(x_list, y_list, str_list, xloc_list, yloc_list, style_list, color1_list, color2_list, size_list, align_list, tooltip_list, d) - create_label_array5(x_list, y_list, str_list, xloc_list, yloc_list, style_list, color1_list, color2_list, size_list, align_list, tooltip_list, d) - create_label_array6(x_list, y_list, str_list, xloc_list, yloc_list, style_list, color1_list, color2_list, size_list, align_list, tooltip_list, d) - update_label_array2(label_arr, x_list, y_list, str_list, xloc_list, yloc_list, style_list, color1_list, color2_list, size_list, align_list, tooltip_list, d) - update_label_array4(label_arr, x_list, y_list, str_list, xloc_list, yloc_list, style_list, color1_list, color2_list, size_list, align_list, tooltip_list, d) - create_label_array_from_arrays2(x_arr, y_arr, str_arr, xloc_arr, yloc_arr, style_arr, color1_arr, color2_arr, size_arr, align_arr, tooltip_arr, d) - create_label_array_from_arrays4(x_arr, y_arr, str_arr, xloc_arr, yloc_arr, style_arr, color1_arr, color2_arr, size_arr, align_arr, tooltip_arr, d) - update_label_array_from_arrays2(label_arr, x_arr, y_arr, str_arr, xloc_arr, yloc_arr, style_arr, color1_arr, color2_arr, size_arr, align_arr, tooltip_arr, d) Lines - delete_line_array(line_arr) - create_line_array(list1, list2, list3, list4, list5, list6, d) - create_line_array2(x1_list, y1_list, x2_list, y2_list, xloc_list, extend_list, style_list, color_list, width_list, d) - create_line_array3(x1_list, y1_list, x2_list, y2_list, xloc_list, extend_list, style_list, color_list, width_list, d) - create_line_array4(x1_list, y1_list, x2_list, y2_list, xloc_list, extend_list, style_list, color_list, width_list, d) - create_line_array5(x1_list, y1_list, x2_list, y2_list, xloc_list, extend_list, style_list, color_list, width_list, d) - create_line_array6(x1_list, y1_list, x2_list, y2_list, xloc_list, extend_list, style_list, color_list, width_list, d) - update_line_array2(line_arr, x1_list, y1_list, x2_list, y2_list, xloc_list, extend_list, style_list, color_list, width_list, d) - update_line_array4(line_arr, x1_list, y1_list, x2_list, y2_list, xloc_list, extend_list, style_list, color_list, width_list, d) - create_line_array_from_arrays2(x1_arr, y1_arr, x2_arr, y2_arr, xloc_arr, extend_arr, style_arr, color_arr, width_arr, d) - update_line_array_from_arrays2(line_arr, x1_arr, y1_arr, x2_arr, y2_arr, xloc_arr, extend_arr, style_arr, color_arr, width_arr, d) Pine Script® indicatorby RagingRocketBull1313271
Remember Rules Label - incl. Text Function with different colorsHi BIG PLAYERS Each of us makes mistakes and exceptions confirm the rule. However, if you disregard the rules of trading, you lose your money - without any ifs and buts! I have therefore created a reminder label for myself, which trading approaches I always want to stick to. These rules serve me as a guideline when I should trade. Through the permanent reminder I set myself the goal of not trading too early and impatiently. The biggest problem of all traders is overtrading: the constant swaying back and forth between greed and fear. This must always be kept in mind. Because trading is in principle very simple: stick to your own rules. Keep a logbook and for my sake, record every trade as a screenshot in a PowerPoint presentation. Then you can see your mistakes in the past trades and recognize your background, why loss trades have arisen - you can also determine profit trades: As a rule, profits arise when you strictly adhere to your trading rules. If you compare a company with a trader, then it is generally a similar procedure. company view a company plans its annual development with budget and forecast. a company compares monthly between actual values and plan values and draws conclusions from the differences. trader view a trader should handle and plan his trade with all rules. a trader should compare the result after the trade with the planned trade and discuss conclusions from possible differences. I hope I could help other traders with this. Kind regards NXT2017Pine Script® indicatorby NXT201733302
Day's Buy Sell Volume label This indicator looks simple but it was bit tricky to code and to make it work on all time frames . I have used array in this to showcase the use of array, array give you more flexibly. It works on all time frame 1m 2m 3m 5m 10m 15m 30m 60m 120m. When the time frame is greater than the or equal to "D" it will show the current bar volume only. Total volume is made up of buying volume and selling volume. Buying volume is the number of shares, contracts, or lots that were associated with buying trades, and selling volume is the number that were associated with selling trades. This indicator shows two labels green one is showing the buying volume of the current day and the red label is showing the selling volume of the current day. I am making this code available to all. This code is for Total volume is made up of buying volume and selling volume. Buying volume is the number of shares, contracts, or lots that were associated with buying trades, and selling volume is the number that were associated with selling trades. //thanks to @Doc6272 who asked to make this indicator LabelPine Script® indicatorby TJalamUpdated 9696 1.1 K