LibTmFrLibrary "LibTmFr"
This is a utility library for handling timeframes and
multi-timeframe (MTF) analysis in Pine Script. It provides a
collection of functions designed to handle common tasks related
to period detection, session alignment, timeframe construction,
and time calculations, forming a foundation for
MTF indicators.
Key Capabilities:
1. **MTF Period Engine:** The library includes functions for
managing higher-timeframe (HTF) periods.
- **Period Detection (`isNewPeriod`):** Detects the first bar
of a given timeframe. It includes custom logic to handle
multi-month and multi-year intervals where
`timeframe.change()` may not be sufficient.
- **Bar Counting (`sinceNewPeriod`):** Counts the number of
bars that have passed in the current HTF period or
returns the final count for a completed historical period.
2. **Automatic Timeframe Selection:** Offers functions for building
a top-down analysis framework:
- **Automatic HTF (`autoHTF`):** Suggests a higher timeframe
(HTF) for broader context based on the current timeframe.
- **Automatic LTF (`autoLTF`):** Suggests an appropriate lower
timeframe (LTF) for granular intra-bar analysis.
3. **Timeframe Manipulation and Comparison:** Includes tools for
working with timeframe strings:
- **Build & Split (`buildTF`, `splitTF`):** Functions to
programmatically construct valid Pine Script timeframe
strings (e.g., "4H") and parse them back into their
numeric and unit components.
- **Comparison (`isHigherTF`, `isActiveTF`, `isLowerTF`):**
A set of functions to check if a given timeframe is
higher, lower, or the same as the script's active timeframe.
- **Multiple Validation (`isMultipleTF`):** Checks if a
higher timeframe is a practical multiple of the current
timeframe. This is based on the assumption that checking
if recent, completed HTF periods contained more than one
bar is a valid proxy for preventing data gaps.
4. **Timestamp Interpolation:** Contains an `interpTimestamp()`
function that calculates an absolute timestamp by
interpolating at a given percentage across a specified
range of bars (e.g., 50% of the way through the last
20 bars), enabling time calculations at a resolution
finer than the chart's native bars.
---
**DISCLAIMER**
This library is provided "AS IS" and for informational and
educational purposes only. It does not constitute financial,
investment, or trading advice.
The author assumes no liability for any errors, inaccuracies,
or omissions in the code. Using this library to build
trading indicators or strategies is entirely at your own risk.
As a developer using this library, you are solely responsible
for the rigorous testing, validation, and performance of any
scripts you create based on these functions. The author shall
not be held liable for any financial losses incurred directly
or indirectly from the use of this library or any scripts
derived from it.
buildTF(quantity, unit)
Builds a Pine Script timeframe string from a numeric quantity and a unit enum.
The resulting string can be used with `request.security()` or `input.timeframe`.
Parameters:
quantity (int) : series int Number to specifie how many `unit` the timeframe spans.
unit (series TFUnit) : series TFUnit The size category for the bars.
Returns: series string A Pine-style timeframe identifier, e.g.
"5S" → 5-seconds bars
"30" → 30-minute bars
"120" → 2-hour bars
"1D" → daily bars
"3M" → 3-month bars
"24M" → 2-year bars
splitTF(tf)
Splits a Pine‑timeframe identifier into numeric quantity and unit (TFUnit).
Parameters:
tf (string) : series string Timeframe string, e.g.
"5S", "30", "120", "1D", "3M", "24M".
Returns:
quantity series int The numeric value of the timeframe (e.g., 15 for "15", 3 for "3M").
unit series TFUnit The unit of the timeframe (e.g., TFUnit.minutes, TFUnit.months).
Notes on strings without a suffix:
• Pure digits are minutes; if divisible by 60, they are treated as hours.
• An "M" suffix is months; if divisible by 12, it is converted to years.
autoHTF(tf)
Picks an appropriate **higher timeframe (HTF)** relative to the selected timeframe.
It steps up along a coarse ladder to produce sensible jumps for top‑down analysis.
Mapping → chosen HTF:
≤ 1 min → 60 (1h) ≈ ×60
≤ 3 min → 180 (3h) ≈ ×60
≤ 5 min → 240 (4h) ≈ ×48
≤ 15 min → D (1 day) ≈ ×26–×32 (regular session 6.5–8 h)
> 15 min → W (1 week) ≈ ×64–×80 for 30m; varies with input
≤ 1 h → W (1 week) ≈ ×32–×40
≤ 4 h → M (1 month) ≈ ×36–×44 (~22 trading days / month)
> 4 h → 3M (3 months) ≈ ×36–×66 (e.g., 12h→×36–×44; 8h→×53–×66)
≤ 1 day → 3M (3 months) ≈ ×60–×66 (~20–22 trading days / month)
> 1 day → 12M (1 year) ≈ ×(252–264)/quantity
≤ 1 week → 12M (1 year) ≈ ×52
> 1 week → 48M (4 years) ≈ ×(208)/quantity
= 1 M → 48M (4 years) ≈ ×48
> 1 M → error ("HTF too big")
any → error ("HTF too big")
Notes:
• Inputs in months or years are restricted: only 1M is allowed; larger months/any years throw.
• Returns a Pine timeframe string usable in `request.security()` and `input.timeframe`.
Parameters:
tf (string) : series string Selected timeframe (e.g., "D", "240", or `timeframe.period`).
Returns: series string Suggested higher timeframe.
autoLTF(tf)
Selects an appropriate **lower timeframe LTF)** for intra‑bar evaluation
based on the selected timeframe. The goal is to keep intra‑bar
loops performant while providing enough granularity.
Mapping → chosen LTF:
≤ 1 min → 1S ≈ ×60
≤ 5 min → 5S ≈ ×60
≤ 15 min → 15S ≈ ×60
≤ 30 min → 30S ≈ ×60
> 30 min → 60S (1m) ≈ ×31–×59 (for 31–59 minute charts)
≤ 1 h → 1 (1m) ≈ ×60
≤ 2 h → 2 (2m) ≈ ×60
≤ 4 h → 5 (5m) ≈ ×48
> 4 h → 15 (15m) ≈ ×24–×48 (e.g., 6h→×24, 8h→×32, 12h→×48)
≤ 1 day → 15 (15m) ≈ ×26–×32 (regular sessions ~6.5–8h)
> 1 day → 60 (60m) ≈ ×(26–32) per day × quantity
≤ 1 week → 60 (60m) ≈ ×32–×40 (≈5 sessions of ~6.5–8h)
> 1 week → 240 (4h) ≈ ×(8–10) per week × quantity
≤ 1 M → 240 (4h) ≈ ×33–×44 (~20–22 sessions × 6.5–8h / 4h)
≤ 3 M → D (1d) ≈ ×(20–22) per month × quantity
> 3 M → W (1w) ≈ ×(4–5) per month × quantity
≤ 1 Y → W (1w) ≈ ×52
> 1 Y → M (1M) ≈ ×12 per year × quantity
Notes:
• Ratios for D/W/M are given as ranges because they depend on
**regular session length** (typically ~6.5–8h, not 24h).
• Returned strings can be used with `request.security()` and `input.timeframe`.
Parameters:
tf (string) : series string Selected timeframe (e.g., "D", "240", or timeframe.period).
Returns: series string Suggested lower TF to use for intra‑bar work.
isNewPeriod(tf, offset)
Returns `true` when a new session-aligned period begins, or on the Nth bar of that period.
Parameters:
tf (string) : series string Target higher timeframe (e.g., "D", "W", "M").
offset (simple int) : simple int 0 → checks for the first bar of the new period.
1+ → checks for the N-th bar of the period.
Returns: series bool `true` if the condition is met.
sinceNewPeriod(tf, offset)
Counts how many bars have passed within a higher timeframe (HTF) period.
For daily, weekly, and monthly resolutions, the period is aligned with the trading session.
Parameters:
tf (string) : series string Target parent timeframe (e.g., "60", "D").
offset (simple int) : simple int 0 → Running count for the current period.
1+ → Finalized count for the Nth most recent *completed* period.
Returns: series int Number of bars.
isHigherTF(tf, main)
Returns `true` when the selected timeframe represents a
higher resolution than the active timeframe.
Parameters:
tf (string) : series string Selected timeframe.
main (bool) : series bool When `true`, the comparison is made against the chart's main timeframe
instead of the script's active timeframe. Optional. Defaults to `false`.
Returns: series bool `true` if `tf` > active TF; otherwise `false`.
isActiveTF(tf, main)
Returns `true` when the selected timeframe represents the
exact resolution of the active timeframe.
Parameters:
tf (string) : series string Selected timeframe.
main (bool) : series bool When `true`, the comparison is made against the chart's main timeframe
instead of the script's active timeframe. Optional. Defaults to `false`.
Returns: series bool `true` if `tf` == active TF; otherwise `false`.
isLowerTF(tf, main)
Returns `true` when the selected timeframe represents a
lower resolution than the active timeframe.
Parameters:
tf (string) : series string Selected timeframe.
main (bool) : series bool When `true`, the comparison is made against the chart's main timeframe
instead of the script's active timeframe. Optional. Defaults to `false`.
Returns: series bool `true` if `tf` < active TF; otherwise `false`.
isMultipleTF(tf)
Returns `true` if the selected timeframe (`tf`) is a practical multiple
of the active skript's timeframe. It verifies this by checking if `tf` is a higher timeframe
that has consistently contained more than one bar of the skript's timeframe in recent periods.
The period detection is session-aware.
Parameters:
tf (string) : series string The higher timeframe to check.
Returns: series bool `true` if `tf` is a practical multiple; otherwise `false`.
interpTimestamp(offStart, offEnd, pct)
Calculates a precise absolute timestamp by interpolating within a bar range based on a percentage.
This version works with RELATIVE bar offsets from the current bar.
Parameters:
offStart (int) : series int The relative offset of the starting bar (e.g., 10 for 10 bars ago).
offEnd (int) : series int The relative offset of the ending bar (e.g., 1 for 1 bar ago). Must be <= offStart.
pct (float) : series float The percentage of the bar range to measure (e.g., 50.5 for 50.5%).
Values are clamped to the range.
Returns: series int The calculated, interpolated absolute Unix timestamp in milliseconds.
LTF

Multi Channel GRID & DCA LTF [trade_lexx]Multi Channel GRID & DCA LTF
Usage Guide
Part 1: The concept and general possibilities of the "Multi Channel GRID & DCA LTF" strategy
Introduction
Welcome to the guide to "Multi Channel GRID & DCA LTF", a powerful and versatile automated trading strategy for the TradingView platform. This tool was developed for traders who are looking for flexibility, control and a high degree of adaptability to various market conditions.
The strategy is based on a hybrid approach that combines two popular and time-tested techniques.:
1. GRID (grid trading): The classic method of averaging a position is by placing a grid of limit orders.
2. DCA (Dollar Cost averaging): Smart position averaging based on signals from external indicators.
However, "Multi Channel GRID & DCA LTF" goes far beyond the simple combination of these two techniques. The strategy includes a number of unique and innovative features, such as cascading MultiGRID grids for dealing with extreme volatility, Channel Mode range trading mode for profiting from sideways movement, and Low Time Frame analysis (LTF) to achieve surgical accuracy in backtesting. Deep customization options for risk management, capital, take profits, and stop losses allow you to configure a strategy for almost any trading style, asset, and timeframe.
The basic idea: How does it work?
Let's take a detailed look at each of the key concepts embedded in the logic of the strategy.
1. GRID — Automatic placement of buy and sell orders at certain price intervals.
This is a fundamental mode of operation. Its main goal is to systematically improve the average entry price for a position if the market is going against you.
* The principle of operation: After opening the base (first) order (`BO`), the strategy automatically places a series of pending limit orders (here they are called "safety orders" or "SO") at certain price intervals. For a long position, orders are placed below the entry price, and for a short position, orders are placed higher.
* Target: When the price moves against an open position, it consistently hits and executes safety orders. Each such execution adds additional volume to the position at a more favorable price, thereby shifting the overall average entry price (`position_avg_price') closer to the current market price. This means that a much smaller corrective movement will be required to gain ground.
* Flexibility: You have full control over the geometry of the grid: the number of safety orders, the percentage distance between them (`SO Step`), and you can even set a coefficient that will increase this step for each subsequent order (`SO Multiplier`), creating an expanding grid.
2. DCA (Signal Averaging) — Smart Averaging
This mode adds an additional layer of analysis to the averaging process. Instead of just buying/selling at the set price levels, the strategy waits for a confirmation signal.
* Working principle: You can connect any external indicator (for example, RSI, CCI, or even your own complex signal system) to the strategy, which outputs numerical values. As standard, 1 is used for a long signal, and -1 is used for a short signal. The strategy will place the next averaging order only at the moment when it receives the appropriate signal.
* Goal: To average a position not just during a fall (or a rise for a short), but at the moments that your main trading system considers the most favorable for this. This allows you to avoid "catching falling knives" and enter only if there are good reasons.
3. Hybrid Mode (GRID+DCA) is the best of the previous two modes
This mode is designed for maximum filtering and control. It requires two conditions to be fulfilled simultaneously.
* Working principle: The safety order will be executed only if the price has reached the calculated grid level and a confirmation signal has been received from your external indicator. If a confirmation signal is received from an external indicator, the next calculated grid level activates the limit order.
* Goal: To create the most reliable averaging system that protects against premature entries and requires double confirmation (both by price and indicator) before increasing the position size.
4. MultiGRID — Adaptation to extreme volatility
This is one of the most powerful and unique features of a strategy designed to survive and make a profit in the face of strong, protracted trends or "black swans".
* The problem it solves: The usual grid of orders has a limited depth. If the price goes beyond the last safety order, the strategy loses the opportunity to average and becomes vulnerable.
* The principle of operation: The MultiGRID function allows you to create "cascades" — several grids following one another. When all the orders of the first grid are executed, the strategy does not stop. Instead, she can activate the second, third (and so on) a grid of orders. The new grid can be activated by one of two triggers:
1. Offset: The new grid is activated when the price passes another set percentage deviation from the last executed order.
2. Signal: The new grid is activated when a signal is received from an external indicator.
* Goal: To significantly expand the working range of the strategy. This allows it to adapt to strong market movements that would "break" the usual grid, and continue to effectively average a position at a much greater depth of decline or growth.
5. Channel Mode — Trading in the range
This feature turns a standard averaging strategy into a machine for "farming" profits within a price channel that is formed during a sideways market movement.
* The problem it solves: In the standard grid strategy, after partially closing a take profit position, the volume of this part "leaves" the trade until the deal is fully closed. You are missing the opportunity to reuse this capital.
* Operating principle: When Channel Mode is enabled, the following happens. Suppose the price went against you, executed several safety orders, and then turned around and reached one of the partial take profits. At this point, the strategy is:
1. Fixes the profit, as it should be.
2. Instantly places a new limit order to buy (or sell for a short) at exactly the same price level where the last triggered safety order was executed. The volume of this order is equal to the volume of the part that was just closed for take profit.
3. If the price goes down again and executes this "repeat" order, the strategy immediately sets a corresponding take profit for it at the level where the previous profit was taken.
* Goal: To create a continuous buy-sell cycle within the local range (channel). The lower limit of the channel is the price of the last averaging, and the upper limit is the price of a partial take profit. This allows you to repeatedly profit from sideways price fluctuations, without waiting for the full closure of the main, large transaction.
6. LTF (Lower Timeframe Analysis) — Surgical precision of backtesting
This feature is critically important for obtaining reliable results during historical testing (backtesting) of grid strategies.
* The problem it solves: The standard testing mechanism in TradingView has a serious limitation. Working, for example, on a 4-hour chart, he sees only 4 candle points: Open, High, Low and Close. He does not know in what order the price moved within these 4 hours. He could have touched High first and then Low, or vice versa. For grid strategies, this is fatal — the engine can show that a take profit has been executed, although in reality the price first went down, collected the entire grid of orders and only then turned around.
* How it works: When you turn on the LTF mode, the strategy for each candle on your main chart (for example, 4H) requests and analyzes all candles from the lower timeframe you specified (for example, 1-minute). Then it virtually trades the entire price path for these minute candles, executing orders, take profits and stop losses in the sequence in which they would occur in reality. It works in the single take profit mode of the Grid strategy.
* Goal: To provide the most realistic and reliable backtest that reflects the real dynamics of the market. This allows you to avoid false expectations and accurately assess the potential performance of the strategy.
// ------------------------
Part 2: Detailed description of the strategy settings
This section is your main guide to all the switches and options available in the strategy. Understanding each setting is the key to unlocking the full potential of this powerful tool.
1. 🛡️ Risk Management 🛡️
This group contains fundamental parameters that determine the basic logic of risk management and the geometry of grid orders.
* Strategy type: Determines the direction of transactions.
* Long: The strategy will only open long positions (buy).
* Short: The strategy will only open short positions (sell).
* Both: The strategy will work both ways, opening long or short depending on the incoming signal.
* SO Count: Sets the maximum number of Safety (averaging) Orders (SO) that the strategy will place within the same grid. If you have MultiGRID enabled, this number applies to each individual grid.
* SO Step (%): This is the base percentage deviation from the entry price at which the first safety order will be placed. For example, at a value of 0.5, the first SO in a long trade will be placed 0.5% lower than the opening price of the base order.
* SO Multiplier: A coefficient that exponentially increases the step for each subsequent safety order. This allows you to create an expanding grid where averaging orders are placed further and further apart, which is effective with strong and accelerating price movements.
* *The step formula for the nth order*: Step(N) = (SO Step) * (SO Multiplier ^(N-1)).
* If the value is 1, all steps will be the same.
* With a value of 1.6, the step of the second SO will be 1.6 times larger than the first, the step of the third will be 1.6 times larger than the second, and so on.
* 1️⃣ TP/SL: These are simplified settings for quick configuration. They allow you to turn on/off the main take profit and stop loss and set basic percentage values for them. More detailed settings for these parameters can be found in the relevant sections below.
// ------------------------
2. 💰 Money Management 💰
Everything related to position size, leverage, and capital is configured here.
* Volume BO (Base Order): Determines the size of the trade's opening order.
* Volume BO: A fixed amount in the quote currency (for example, in USDT).
* USDT (check mark): Manages the information in the comments to the orders. If enabled, the volume of orders in USDT will be displayed in the comments. This is convenient for visual analysis and for sending the amount of USDT by the placeholder {{strategy.order.comment}} via webhooks when connecting the strategy to the exchange or trading terminals.
* or % of deposit: The amount calculated as a percentage of the available capital of the strategy. The check mark to the right of this field enables this mode. Important: using a percentage activates the effect of compounding (compound interest), as the amount of each new transaction will be automatically recalculated based on the current capital (initial capital + profit/loss). If enabled, the percentage of orders will be displayed in the comments. This is convenient for visual analysis and for sending percentages on the placeholder {{strategy.order.comment}} via webhooks when connecting the strategy to the stock exchange, trading terminals, or creating Copy trading.
* Martingale: The coefficient applied to the volume of orders. It increases the size of each subsequent insurance order compared to the base one.
* Volume formula for the nth SO: Volume SO (N) = (Volume BO) * (Martingale^N).
* With a value of 1.2, the volume of the first SO will be 1.2 times greater than the base, the second — 1.44 times (`1.2 * 1.2`) and so on.
* Leverage: Specify the size of your leverage. This parameter is used exclusively for calculating and displaying the approximate liquidation price. It does not affect the size of positions, but it helps to visually assess the risks.
* Liquidation: Enables or disables the calculation and display of the liquidation line on the chart.
* Margin type: Allows you to select a method for calculating the liquidation price, simulating the logic of exchanges:
* Isolated: The liquidation price is calculated based on the size and leverage of the current open position only.
* Cross: The calculation simulates using the entire available balance to maintain a position. In the strategy, the liquidation price is calculated as the level at which the loss on the current transaction is equal to the current capital.
* Commission (%): Specify the percentage of your exchange's commission per transaction. The correct value of this parameter is crucial for obtaining realistic backtest results.
// ------------------------
3. 🕸️ Grid Management 🕸️
This group is responsible for the logic of safety orders and advanced mechanics such as Channel Mode and MultiGRID.
* SO Type: Defines the logic of placing averaging orders.
* GRID: Classic grid. All safety orders are placed in advance as limit orders.
* DCA: Signal averaging. The strategy is waiting for a signal from an external indicator to place a market averaging order.
* GRID+DCA: Hybrid. The strategy waits for a signal, and if it arrives, places a limit order at the appropriate price level of the grid or executes a market order if the signal has arrived below the limit order level.
* Signal for SO: A data source (indicator) that will be used for signals in DCA and GRID+DCA modes.
* ↔️ Channel Mode: When this option is enabled, the strategy tries to trade in a sideways range. After partially closing a take profit position, it immediately places a limit order for re-entry at the price of the last triggered safety order. This creates a buy-sell cycle within the local channel.
* Best Price Only: This filter adds an additional condition for averaging in DCA and MultiGRID modes (when it operates on a signal). The next averaging order or a new grid will be activated only if the current price is more favorable (lower for long, higher for short) than the price of the previous entry.
* 🧩 MultiGRID ⮕ Enables cascading grid mode.
* Grid Count: The total number of grids that can be activated sequentially.
* Offset: Percentage deviation from the price of the last order of the previous grid. When this margin is reached, the following grid of orders is activated (this mode does not require a signal).
* Or signal: Allows you to use the signal from an external indicator as a trigger to activate the next grid. The checkmark on the right turns on this mode.
// ------------------------
4. 🎯 Entry and Stop 🎯
This group of settings allows you to fine-tune the conditions for starting a new trade and all aspects related to protective stop orders, including the complex mechanics of trailing and managing SL after partial take profits.
* 🎯 Signal: A data source (indicator) that will be used to determine when to enter a trade. The strategy expects a value of 1 for the start of a long trade and -1 for a short trade.
* Min Bars: Sets the minimum number of candles that must pass from the moment of opening the previous trade to the moment of opening the next one. A value of 0 disables this filter. This is a useful tool to prevent overly frequent entries in a "noisy" market.
* Non-stop: If this option is enabled, the strategy ignores the Entry Signal and opens a new trade immediately after closing the previous one (taking into account the Min Bars filter, if it is set). This turns the strategy into a constantly working mechanism that is always on the market.
* 🛑 SL Type: Defines the base price from which the stop loss percentage will be calculated. The stop loss in the first section must be enabled for this block of settings to work.
* From the entry point: SL is always calculated from the opening price of the very first base order. It remains static throughout the entire transaction unless it is moved by other functions.
* From breakeven line: SL is dynamically recalculated and shifted each time a safety order is executed. It always follows the average price of the position, being at a given percentage distance from it.
* From last executed SO: SL is recalculated from the price of the last executed order, whether it is a base or a safety order.
* From last SO: SL is calculated from the price of the most recent possible safety order in the grid. This is usually the most remote and conservative type of SL.
* Trailing SL Type: Defines the algorithm by which the stop loss will move after its activation.
* Standard: Classic trailing. After activation, SL will follow the price at a fixed distance.
* ATR: SL will follow the price at a distance equal to the value of the ATR indicator multiplied by the specified multiplier.
* External Source: SL will follow any selected line of the third-party indicator.
* Period and Multiplier: Common parameters for all types of trailing.
* Source: The source of the line for the trailing SL of the third-party indicator.
* Trailing SL after entry: The mode of activation of the trailing SL after entering the transaction
* SL management after TP (sections 1️⃣, 2️⃣, 3️⃣): These three blocks allow you to create a complex stop loss management logic as profits are recorded.
For each take profit level (TP1, TP2, TP3), you can configure:
* SL BE / SL TP1 / SL TP2: When the corresponding TP is reached, the stop loss will be moved to the breakeven point (for TP1), to the TP1 price level (for TP2) or to the TP2 price level (for TP3).
* Trailing SL: When the corresponding TP is reached, the trailing stop loss is activated according to the settings above.
* By ↔️ Signal: A very powerful option. If it is enabled, the above action (SL transfer or trailing activation) will occur when the opposite trading signal is received from an external indicator. This allows you to protect profits or reduce losses if the market turns sharply, even before reaching the target.
* SL Delay ⮕ Allows you to delay the activation of the stop loss.
* Number of Bars: The Stop loss will be physically placed on the market only after the specified number of candles has passed since entering the trade. This can help to avoid "taking out" the stop with a random short movement (squiz) immediately after opening a position.
* SL Block: Unique defensive mechanics for trading both ways (`Strategy Type: Both`).
* Number of SL: If the strategy receives the specified number of stop losses in a row in one direction (for example, 2 stops long), it temporarily blocks the opportunity to open new trades in that direction.
* Lock Reset mode:
* By direction: The lock is lifted if a profitable trade is closed in the allowed direction or if a stop loss is triggered in the opposite direction.
* First profit: The lock is lifted after closing any profitable transaction, regardless of its direction.
// ------------------------
5. ✅ Take Profit ✅
This group of settings provides comprehensive control over profit taking, from a simple take profit to a complex system of partial closures and trailing.
* ✅ TP Type: Defines the base price for calculating the percentage deviation of the take profit.
* From entry point: TP is calculated from the base order price.
* From breakeven line: TP dynamically follows the average position price.
* From last executed SO: TP is calculated from the price of the last executed order.
* Filters for closing on signal
* Only ➕: If TP is triggered by a signal, the deal will be closed only if it is in the black relative to the average price.
* Or >TP: If TP is triggered by a signal, the trade will be closed only if the closing price is better than (or equal to) the estimated price of this TP.
* TP type of trailing: Yes, take profit has a trailing too! It works differently than the SL trailing.
* Standard / ATR: After the price touches the "virtual" TP level, the trailing is activated. He does not place a stop order, but begins to move away from the price, dynamically moving the limit order to close further and further in the profitable direction, allowing him to collect the maximum from the impulse movement.
* External Source: TP will follow any selected line of the third-party indicator.
* Period and Multiplier: Parameters for calculating the trailing margin TP.
* Source: The source of the line for the trailing TP of the third-party indicator.
* TP level settings (sections 1️⃣, 2️⃣, 3️⃣, 4️⃣): The strategy supports up to four independent take profit levels, which allows for a flexible system of partial commits.
For each level, you can set:
* TP: Enable the level and set its percentage deviation from the base price.
* Size: What percentage of the current position will be closed when this level is reached. For the last active TP, this parameter is ignored, and 100% of the remaining position is closed.
* Trailing TP: Enable the above-described trailing mechanism for this particular level.
* Signal: Enable closing based on the signal from the external indicator for this level.
* Or take: If both the closing on the signal and the limit order are enabled, then whatever comes first will work.
* After SO: Activate this TP level only after the specified number of safety orders has been executed. This allows you to set closer targets for riskier (deeply averaged) positions.
// ------------------------
6. 🔬 GRID and MultiGrid Analysis on Lower TFs (LTF) 🔬
This group activates one of the most important functions for accurate testing of grid strategies.
* Enable LTF Calculation ⮕ The main switch of the analysis mode on the lower timeframes.
* Timeframe selection: A drop-down list where you can select a timeframe for detailed analysis. For example, if your main schedule is 1 hour, you can select 1 minute here. The strategy will emulate the trading of minute candles within each hour candle.
❗️Important: As mentioned in the first part, the use of this mode is critically necessary to obtain realistic backtest results, especially for strategies with a dense grid of orders. Without it, the results may be overly optimistic and not reflect the real dynamics of the market. It should be remembered that TradingView imposes a limit on the number of intra-bars (minor TF bars) that can be requested. This is usually about 100,000 bars.
// ------------------------
7. 🕘 Backtest Date Range 🕘
This group allows you to focus testing on a specific historical period.
* Limit Date Range: Enables date filtering.
* Start time: The date and time when the strategy will start analyzing and opening deals.
* End time: The date and time after which the strategy will stop opening new deals and complete testing.
// ------------------------
8. 🎨 Visualization 🎨
All the options responsible for the appearance and information content of the chart are collected here.
* Show PnL labels: Enables/disables the display of text labels with the result (profit/loss) after closing each trade.
* Statistics Table: Enables/disables the main dashboard with detailed statistics on the results of the backtest.
* Strategy Settings Table: Enables/disables an additional panel that summarizes all the key parameters of the current configuration.
* Monthly Profit Table: Enables/disables a table with a breakdown of percentage returns by month and year.
* Table settings: For each of the three tables, you can individually adjust the Text size and Table Position on the screen to position them as conveniently as possible.
* Decimal places: Defines how many decimal places will be displayed in numeric values in tables and on labels.
// ------------------------
9. ✉️ Webhook Settings ✉️
This group is intended for traders who want to automate trading on strategy signals using third-party services and exchanges (for example, 3Commas, WunderTrading, Cryptorobotics, Cryptohopper, Bitsgap, Binance, ByBit, OKX, Pionex, Bitget or proprietary solutions).
For each key event in the strategy, there is a separate switch and a text field:
* Webhook for Open: Enable and set a message for the webhook that will be sent when the base order is opened.
* Webhook for Averaging: A message sent when executing any insurance order.
* Webhook for Take Profit: A message sent when closing on take profit (including partial ones).
* Webhook for Stop-Loss: A message sent when a stop loss is closed.
You can insert a JSON code or any other message format that your service requires for automation into the text fields. The strategy supports special placeholders (for example, `{{strategy.order.alert_message}}`), which allow you to dynamically insert the necessary data into the message, such as the amount of USDT or the percentage of the deposit for entry, averaging and take profit orders.

cd_sweep&cisd_CxOverview:
When the price is at a significant zone/level on a higher time frame (HTF), and it sweeps (breaks through and then closes back below/above) the high or low of the previous HTF candle, it is common to look for a Change in State of Delivery (CISD) on a lower time frame (LTF) to enter a trade.
This model can be summarized as:
HTF Sweep → LTF CISD (Optional: SMT / Divergences)
________________________________________
Working Principle & Details:
1. The indicator monitors price action on the selected HTF and tracks any sweep (violation) of the previous HTF candle's high or low. Simultaneously, it identifies CISD levels on the LTF. If SMT is enabled, it will appear as a label on the chart.
When both HTF sweep and LTF CISD conditions are met, the indicator marks the chart at the open of the next candle and triggers an alert if set.
CISD levels are tracked and updated whenever a new HTF high/low is formed.
2. The indicator monitors the formation of entry models on up to six selected pairs, displaying results in two separate tables:
o HTF Sweep Query Table: Monitors live HTF candles and reports pairs that meet the sweep condition.
o CISD Table: Displays the pairs where a valid entry model has formed. A "🔥" symbol indicates the condition has occurred.
3. Bias Visualization:
Based on the selected HTF, a visual band is shown at the bottom of the chart using the chosen bullish/bearish colors.
Bias is determined by:
o Candle closing above/below the previous one suggesting continuation.
o A failed close after a sweep implying potential reversal.
4. HTF Candles:
Displays HTF candles based on the user-defined time frame.
5. Optional SMT (Smart Money Technique):
Must be enabled in the menu and requires the correlated pair to be entered correctly for accurate results.
Displayed only as a visual confirmation, not a requirement for model formation.
If the currently open symbol sweeps the previous candle while the correlated symbol does not (or vice versa), an "SMT" label appears on the chart.
6. Color & Table Positioning:
Controlled via the settings menu.
________________________________________
Warnings:
• The indicator only marks CISDs that form at HTF high/low zones.
• Entering every time the model forms does not guarantee profitability.
• Waiting for the model to appear at significant HTF levels/zones increases the likelihood of success.
• HTF and LTF selections should follow commonly accepted combinations or user-tested time frames.
• If you want to trigger alerts only for symbols entered in the indicator, ensure the "Use indicator alerts" option is enabled.
• To set alerts for the TradingView watchlist instead, disable the "Use indicator alerts" option.
________________________________________
Feel free to share your thoughts and suggestions.
Happy trading! 💫

Timeframe LoopThe Timeframe Loop publication aims to visualize intrabar price progression in a new, different way.
🔶 CONCEPTS and USAGE
I got inspiration from the Pressure/Volume loop, which is used in Mechanical Ventilation with Critical Care patients to visualize pressure/volume evolution during inhalation/exhalation.
The main idea is that intrabar prices are visualized by a loop, going to the right during the first half and returning to the left towards its closing point. Here, the main chart timeframe (CTF) is 4 hours, and we see the movements of eight 30-minute lower timeframe (LTF) periods, highlighted by four yellow dots/lines (first 2 hours -> "Right") and four blue dots/lines (last 2 hours <- "Left"):
🔹 BTF
If "Show Lowest TF" is enabled, the LTF is split into another lower TF (BTF - "Base TF"); in this case, the 30-minute LTF is split into 10 parts of 3 minutes (BTF):
Enabling "Loop Lowest TF" will enable the BTF to react similarly to the largest loop; from halfway, it will return to its startpoint:
Here is a more detailed example:
🔹 Mini-Candles
The included option "Mini-Candles" will bring even more detail, showing the LTF as Japanese candlesticks with user-defined colors and adjustable body width; in this example, the mini-candles associated with the first half (yellow lines/dots) are green/red, while blue/fuchsia in the second half (blue lines/dots):
CTF 10 minutes, LTF 1 minute, BTF 5 seconds
One can see the detailed intrabar price progression in one glance.
CTF 5 minutes, LTF 1 minute, BTF 5 seconds
If the LTF/BTF ratio, divided by two, results in a non-integer number, the right side will be a vertical line instead of just a turning point. In that case, the smaller, most right blue loop will be situated at the right of that line.
10 minutes / 1 minute = 10 -> 10 / 2 = 5 parts
5 minutes / 1 minute = 5 -> 5 / 2 = 2.5 parts
🔶 SETTINGS
🔹 Timeframes
Lower Timeframe 1
Lower Timeframe 2
No need to worry about the order of both timeframes; BTF will be the lowest TF of the 2, LTF the highest; both have to be lower than the main chart TF (CTF); otherwise, it will result in the error: "`Lower Timeframes` should be lower than current chart timeframe".
The ratio LTF / BTF should be equal or higher than 2; otherwise, this error will show: "`Lower Timeframe` should minimally be twice the `Base (smallest) Timeframe`"
Lastly, the ratio CTF / BTF should be lower than 500; otherwise, this error will pop up: "`Current Chart timeframe` / `Lower Timeframe` should be less than 500."
I have tried to capture runtime errors as best I could. If one should be triggered (red exclamation mark next to the title), it is best to increase the lowest TF.
🔹 Options
Show Lowest TF: Show BTF progression.
Loop Lowest TF: Enabling will let the BTF line return halfway.
Show Mini-Candles
Show Steps
"Show Steps" can be useful to see how the script works, where the location of the current price is compared against the position of the left (L) and right (R) labels:
🔹 Style

Power of Three FractalsIntroducing Power of Three Fractals—an advanced, all-in-one TradingView toolkit designed to bring higher timeframe context directly onto your primary chart. This isn't just another candle overlay; it's a sophisticated analytical suite built for the serious price action trader. Developed with the core principles of "smart money" concepts, this indicator helps you see the market in a new dimension.
Key Features:
Floating Candlestick Display:
Forget cluttered chart backgrounds. Power of Three Fractals displays your chosen higher timeframe candles as a clean, stylized series of candlesticks in a dedicated space on the right side of your chart, allowing you to analyze HTF structure without losing focus on live price action.
Intelligent Adaptive Timeframe:
This is a game-changer. If you set the indicator to show 4H candles but switch your main chart to the Daily, it won't produce an error. Instead, it automatically adapts, recognizing the invalid selection and seamlessly switching to display the next logical timeframe (e.g., Weekly candles). This provides a flawless analytical experience as you move through timeframes.
Precision High/Low Anchors:
Dotted Lines: Instantly see which lower timeframe (LTF) candle created the high and low of the current HTF candle. This is perfect for visualizing manipulation wicks and the true Power of Three delivery.
Solid Lines: Automatically identify the absolute highest high and lowest low across the entire displayed range of HTF candles. The script then draws a solid line back to the exact LTF candle that formed these critical points, defining your true trading range. This feature intelligently hides itself if the current candle is making the high/low to avoid unnecessary clutter.
Automated Liquidity Sweep Detection:
This powerful, built-in algorithm automatically identifies one of the most critical price action events: a liquidity sweep. When a newer HTF candle takes the low of the oldest displayed candle and then closes back above it, the indicator instantly alerts you.
It draws a dashed line from the initial low to the end of the range and places a bold 'x' marker below the specific candle that performed the sweep, giving you a clear, unmissable signal of this key market event.
Integrated HTF Countdown Timer:
Stay perfectly in sync with the market. A clean, floating timer in the bottom-right corner displays a live countdown to the close of your selected higher timeframe candle, complete with a header so you always know which timeframe you're tracking.
Fully Customizable Aesthetics:
Tailor the indicator to your personal chart theme. You have full control over the colors of bullish/bearish candles, wicks, and all connecting lines, allowing for a seamless visual integration.
Who Is This Indicator For?
The Power of Three Fractals indicator is built for the discerning trader who understands that context is key. It is ideal for:
Day Traders & Scalpers needing constant awareness of higher timeframe control.
Swing Traders looking to time entries based on HTF structure and LTF shifts.
Price Action & "Smart Money Concept" Traders who utilize concepts like liquidity sweeps, order blocks, and fractals.
What You Get:
Access to the Power of Three Fractals indicator on TradingView.
All future updates, bug fixes, and feature enhancements.
Stop trading in the dark. Elevate your analysis, gain a critical edge, and make more informed trading decisions with the Power of Three Fractals indicator.
Disclaimer: The Power of Three Fractals is an analytical tool and should not be considered financial advice or a signal service. All trading involves risk, and past performance is not indicative of future results. Please use this tool as part of a comprehensive trading plan with proper risk management.

Candle Range Trading (CRT) with Alerts
📌 Description:
The Candle Range Trading (CRT) indicator identifies potential reversal or continuation setups based on specific two-candle price action patterns.
It analyzes pairs of candles to detect Bullish or Bearish CRT patterns and provides visual signals (triangles) and alert notifications to support scalp or swing trading strategies.
🔍 How It Works:
🔻 Bearish CRT Pattern:
Candle 1 is bullish
Candle 2 is bearish
Candle 2's high > Candle 1's high
Candle 2 closes within Candle 1’s range
🔺 Red triangle above candle
🔺 Bullish CRT Pattern:
Candle 1 is bearish
Candle 2 is bullish
Candle 2's low < Candle 1's low
Candle 2 closes within Candle 1’s range
🔻 Green triangle below candle
📈 Visual Features:
🔺 Red triangle = Bearish CRT
🔻 Green triangle = Bullish CRT
📏 Optional box showing CRT High and CRT Low
🔔 Built-in Alerts:
Bullish CRT Alert: "Bullish CRT Pattern Detected"
Bearish CRT Alert: "Bearish CRT Pattern Detected"
Set alerts to get notified instantly when a pattern is detected.
⚠️ Note:
Use in conjunction with trend filters, support/resistance, or volume for best results.
Ideal for scalping or short-term trades.
Avoid trading in choppy or low-volume markets.
⚠️ Disclaimer:
This script was generated with the assistance of ChatGPT by OpenAI and is intended for educational and informational purposes only.
All strategies, alerts, and signals derived from this indicator should be thoroughly backtested and validated before using in live trading.
Trading involves substantial risk, and past performance is not indicative of future results. The author and ChatGPT bear no responsibility for any trading losses or financial decisions made using this script.
Users are solely responsible for the risks associated with their trading actions. Always apply proper risk management and perform your own due diligence before making any financial decisions.

FVG Reversal Sentinel🔵 FVG Reversal Sentinel – Multi-Timeframe Fair Value Gap Indicator
The FVG Reversal Sentinel is a powerful TradingView indicator designed to help traders identify and track Fair Value Gaps (FVGs) across multiple timeframes, all within a single chart.
This tool allows you to select up to five separate timeframes, ensuring you never miss key market shifts, whether you are scalping, day trading, or swing trading. You can use this indicator in any asset (Cryptos, Futures, Indices, Forex Pairs, etc.).
🔵 - Key Features -
Multi-Timeframe FVG Tracking – Select and display up to five different timeframes on one chart, providing a comprehensive view of market structure.
Customizable Colors – Adjust bullish and bearish FVG colors to match your chart theme for a seamless trading experience.
Enhanced Market Context – Quickly identify key liquidity zones and refine your entries and exits with precision.
Hide the lower timeframes FVGs to get a clear view in a custom timeframe.
Show or hide mitigated FVGs to declutter the chart.
FVGs boxes are going to be displayed only when the candle bar closes
FVGs are going to be mitigated only when the body of the candle closes above or below the FVG area.
No repainting
Whether you're looking to fine-tune your entries or gain a broader market perspective, the FVG Reversal Sentinel indicator ensures you have the tools to stay ahead of price action and capitalize on market inefficiencies.
🔵 - Customization-
You can change the indicator settings as you see fit to achieve the best results for your use case.
TIMEFRAMES
This indicator provides the ability to select up to 5 timeframes. These timeframes are based on the trader's timeframes including any custom timeframes.
Select the desired timeframe from the options list.
Add the label text you would like to show for the selected timeframe.
Check or uncheck the box to display or hide the timeframe from your chart.
FVG SETTINGS
Length of boxes: allows you to select the length of the box that is going to be displayed for the FVGs.
Delete boxes after fill?: allows you to show or hide mitigated FVGs on your chart.
Hide FVGs lower than enabled timeframes?: allows you to show or hide lower timeframe FVGs on your chart. Example - You are in a 15 minutes timeframe chart, if you choose to hide lower timeframe FVGs you will not be able to see 5 minutes FVG defined in your Timeframes Settings, only 15 minutes or higher timeframe FVGs will be displayed on your chart.
BOX VISUALS
Bullish FVG box color: the color and opacity of the box for the bullish FVGs.
Bearish FVG box color: the color and opacity of the box for the bearish FVGs.
LABELS VISUALS
Bullish FVG labels color: the color for bullish labels.
Bearish FVG labels color: the color for bearish labels.
Labels size: the size of the text displayed in the labels.
Labels position: the position of the label inside the FVGs boxes (right, left or center).
BORDER VISUALS
Border width: the width of the border (the thickness).
Bullish FVG border color: the color and the opacity of the bullish box border.
Bearish FVG border color: the color and the opacity of the bearish box border.
🔵 - How to use the indicator -
Just add the indicator in your chart and click in the settings option to customize it.
Make sure you select the desired timeframes and set the colors and opacity for the FVGs boxes.
This indicator can be used in many trading strategies, such as:
SILVER BULLET
iFVG
iFVG RETEST
These strategies are based on the use of FVGs, this tool can help you analyze the market and make the right decision.
🔵 - How was the indicator designed? -
I have spent a lot of time testing other open source indicators from the community. All of these indicators do a great job, but they have a problem, they not only mitigate FVGs when a candle closes above or below the FVG, they also mitigate FVGs when the candle closes exactly to the tick (not above or below the FVG). This is a problem for many strategies that rely on FVGs mitigation.
What makes this indicator different is that it focuses on just mitigating imbalances at the right time for these strategies.
I have taken ideas and some pieces of code from many community indicator developers, such as:
@twingall
@tflab
@marktools
@nacho-fx
@pmk07
... and many other people, to whom I thank for their valuable work and have allowed me to create this tool by making modifications to their source code.
🔵 - Disclaimer -
This tool is intended solely for informational and educational purposes and should not be regarded as financial, investment, or trading advice. It's not designed to predict market movements or offer specific recommendations. Users should be aware that past performance is not indicative of future results and should not rely on any indicator for financial decisions.

[EmreKb] Pinbar AnalysisDescription
The Pinbar Analyzer tool will count how many ltf candles are inside the wick and the total volume inside the wick.
How it works?
Calculate candle count of inside wick and volumes. Than display like below image
T/iW: Total Candle / Total inside Wick
ROiW: Rate of inside wick candle count
TV/WV: Total volume / Wick volume

HTF CandlesHTF Candles, Plot of a Higher/Lower Timeframe Candles on any chart.
This HTF / LTF candle plot displays the previous 3 daily candles with the current update of the price with reference to a lower time frame.
Candles includes 3 Candles of HTF
last HTF candle includes 4 previous candles from LTF
Candle High Low Open Close are plotted.
these OHLC values act as Support and Resistance With reference to current Price.
very useful in making HTF and LTF analysis with reference to current timeframe.

Lanczos CandlesThis indicator reconstructs price action using Lanczos resampling, incorporating lower timeframe data to create a more detailed representation of market movements. Traditional candle aggregation on higher timeframes tends to lose some price action detail - this indicator attempts to preserve more of that information through mathematical resampling.
The indicator samples price data from a lower timeframe and uses the Lanczos algorithm, a mathematical method commonly used in signal processing and image resampling, to reconstruct the price series at the chart's timeframe. The process helps maintain price movements that might otherwise be smoothed out in regular candle aggregation.
The main settings allow you to select the source timeframe for sampling, adjust the Lanczos filter width to balance smoothness versus detail preservation, and optionally enable Heikin Ashi calculation. The filter width parameter (default: 3) affects how aggressive the smoothing is - higher values produce smoother results while lower values retain more of the original variation.
This approach can be useful for technical analysis when you want to work with higher timeframes while maintaining awareness of significant price movements that occurred within those candles. The optional Heikin Ashi mode can help visualize trends in the resampled data.
The indicator works best when there's a clear ratio between your chart timeframe and the source timeframe (for example, using 1-minute data to build 5-minute candles).
libTFLibrary "libTF"
libTF: Find higher/lower TF automatically
This library to find higher/lower TF from current timeframe(timeframe.period) for Pine Script version6(or higher).
Basic Algorithm
Using a timeframe scale Array and timeframe.in_seconds() function to find higher/lower timeframe.
Return value is na if could not find TF in the timeframe scale.
The timeframe scale could be changed by the parameter 'scale'(CSV).
How to use
1. Set higher/lower TF
higher()/lower() function returns higher/lower TF.
Default timeframe scale is "1, 5, 15, 60, 240, 1D, 1M, 3M, 12M".
example:
htf1 = higher()
htf2 = higher(htf1)
ltf1 = lower()
ltf2 = lower(ltf1)
2. Set higher/lower TF using your timeframe scale
The timeframe scale could be changed by the parameter.
example:
myscale="1,60,1D,1M,12M"
htf1 = higher(timeframe.period,myscale)
htf2 = higher(htf1,myscale)
ltf1 = lower(timeframe.period,myscale)
ltf2 = lower(ltf1,myscale)
3. How to use with request.*() function
na value is set if no higher/lower TF in timeframe scale.
It returns current timeframe's value, when na value as timeframe parameter in request.*().
As bellow, if it should be na when timeframe is na.
example:
return_value_request_htf1 = na(htf1)?na:request.security(syminfo.tickerid,htf1,timeframe.period)
return_value_request_ltf1 = na(ltf1)?na:request.security(syminfo.tickerid,ltf1,timeframe.period)
higher(tf, scale)
higher: find higher TF from TF string.
Parameters:
tf (string) : default value is timeframe.period.
scale (string) : TF scale in CSV. default is "1,5,15,60,240,1D,1W,1M,3M,12M".
Returns: higher TF string.
lower(tf, scale)
lower: find lower TF from TF string.
Parameters:
tf (string) : default value is timeframe.period.
scale (string) : TF scale in CSV. defalut is "1,5,15,60,240,1D,1W,1M,3M,12M".
Returns: lower TF string.

See LTF Candles and VolumeThis indicator will show you the candles, wicks, and their volumes from a lower timeframe chart. You can also select a different symbol in inputs.
This indicator uses requests to receive data from different timeframe or symbols, and it simply draws boxes and lines from the requested data.
VEMA_LTFVEMA indicator is based on lower time frame volume data and it has 3 lines.
20, 50, 100 moving averages of the close price in each candle with the highest volume.
Effectively working fine and hence sharing.
Will Add more information with examples in next update
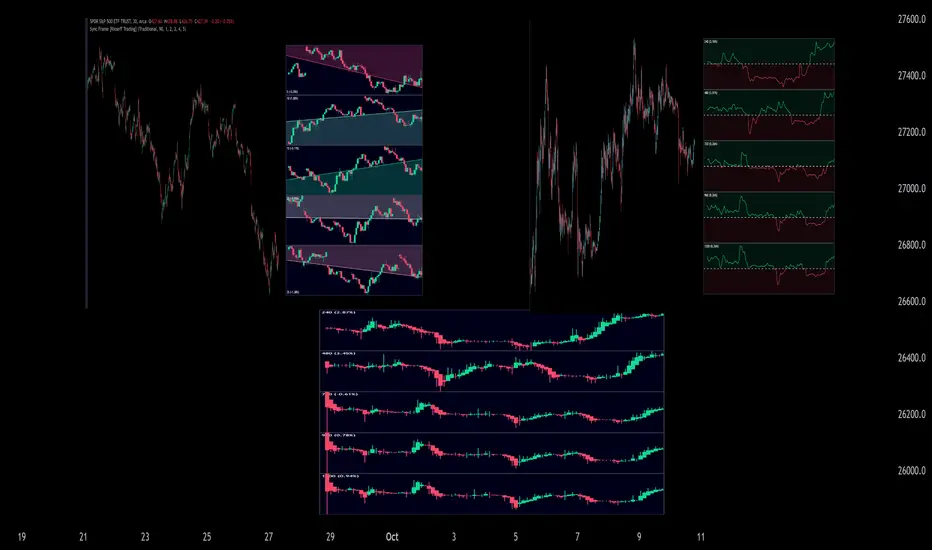
Sync Frame (MTF Charts) [Kioseff Trading]Hello!
This indicator "Sync Frame" displays various lower timeframe charts for the asset on your screen!
5 lower timeframe candle charts shown
Timeframes auto-calculated using the new timeframe.from_seconds() function
Heikin-Ashi candles available
Baseline chart type available
Dynamic Scaling for ease of use
User customizable timeframes
Simple script (:
The image above shows the baseline chart type.
Time image above shows a traditional candlestick chart.
The image above shows a hekin-ashi chart.
The image above shows the indicator when nearly zoomed in as much as possible. The lower timeframe charts adjust to my chart positioning.
The image above shows my screen fully zoomed out; the lower timeframe charts adjust in both height and width to accommodate my chart positioning!
Thank you for checking this out (:
Volume Delta Trailing Stop [LuxAlgo]The ' Volume Delta Trailing Stop ' indicator uses Lower Time Frame (LTF) volume delta data which can provide potential entries together with a Volume-Delta based Trailing Stop-line .
🔶 USAGE
Our 'Volume Delta Trailing Stop' script can show potential entries/Stop Loss lines
A trigger line needs to be broken before a position is taken, after which a Volume Delta-controlled Trailing Stop-line is created:
🔶 DETAILS
🔹 Volume rises when bought or sold
🔹 When the opening price appears on the chart, a buy/sell order has been executed.
If that order is less than the available supply of that particular price, volume will rise, without moving the price.
🔹 When the opening price is the same as the closing price, the volume of that bar can be seen as "neutral volume" (nV); nor "up", nor "down" volume.
Example
A buy order doesn't fill the first available supply in the order book. This price will be the opening price with a certain volume.
When at closing time, price still hasn't moved (the first available supply in the order book isn't filled, or no movement downwards),
the closing price will be equal to the opening price, but with volume. This can be seen as "neutral volume (nV)".
🔹 Delta Volume (ΔV): this is "up volume" minus "down volume"
🔹 Standard volume is colored red when closing price is lower than opening price ( = "down volume").
🔹 Standard volume is colored green when closing price is higher OR equal (nV) than opening price ( = "up volume").
🔹 Neutral Volume
The "Neutral-Volume" is considered "Up-Volume" - setting will dictate whether nV is considered as green 'buy' volume or not.
🔶 EXAMPLE
29 July 10:00 -> 10:05, chart timeframe 5 minutes, open 29311.28, close 29313.89
close > open, so the volume (39.55) is colored green ("up volume").
(The Volume script used in the following examples is the open-source publication Volume Columns w. Alerts (V) from LucF )
Let's zoom to the 1-minute TF:
The same period is now divided into more bars, volume direction (color) is dependable on the difference between open and close.
Counting up and down volume gives a more detailed result, it remains in an upward direction though):
(ΔV = +15.51)
Let's further zoom in to the 1-second TF:
The same period is now divided into even more bars (more possibility for changing direction on each bar)
Here we see several bars that haven't moved in price, but they have volume ("neutral" volume).
(neutral volume is coloured light green here, while up volume is coloured darker green)
When we count all green and red volume bars, the result is quite different:
(ΔV = -0.35)
In total more volume is found when price went downwards, yet price went up in these 5 minutes.
-> This is the heart of our publication, when this divergence occurs, you can see a barcolor changement:
• orange: when price went up, but LTF Volume was mainly in a downward direction.
• blue: when price went down, but LTF Volume was mainly in an upwards direction.
When we split the green "up volume" into "up" and "neutral", the difference is even higher
(here "neutral volume" is colored grey):
(ΔV = -12.76; "up" - "down")
🔶 CONCEPTS
bullishBear = current bar is red but LTF volume is in upward direction -> blue bar
bearishBull = current bar is green but LTF volume is in downward direction -> orange bar
🔹 Potential positioning - forming of Trigger-line
When not in position, the script will wait for a divergence between price and volume direction. When found, a Trigger-line will appear:
• at high when a blue bar appears ( bullishBear ).
• at low when an orange bar appears ( bearishBull ).
Next step is when the Trigger-line is broken by close or high/low (settings: Trigger )
Here, the closing price went under the grey Trigger-line -> bearish position:
🔹 Trailing Stop-line
When the Trigger-line is broken, the Trailing Stop-line (TS-line) will start:
• low when bullish position
• high when bearish position
You can choose (settings -> Trigger -> Close or H/L ) whether close price or high/low should break the Trigger-line
When alerts are enabled ("Any alert() function call"), you'll get the following message:
• ' signal up ' when bullish position
• ' signal down' when bearish position
After that, the TS-line will be adjusted when:
• a blue bullishBear bar appears when in bullish position -> lowest of {low , previous blue bar's high or orange bar's low}
• an orange bearishBull bar appears when in bearish position -> highest of {high, previous blue bar's high or orange bar's low}
When alerts are enabled ("Any alert() function call"), and the TS-line is broken, you'll get the following message:
• ' TS-line broken down ' when out bullish position
• ' TS-line broken up ' when out bearish position
🔹 Reference Point
Default the direction of price will be evaluated by comparing closing price with opening price.
When open and close are the same, you'll get "neutral volume".
You can use "previous close" instead (as in built-in volume indicator) to include gaps.
If close equals open , but close is lower than previous close , it will be regarded as " down volume ",
similar, when close is higher than previous close , it will be regarded as " up volume "
Note, the setting applies for the current timeframe AND Lower timeframe:
Based on: " open " (close - open)
Based on: " previous close " (close - previous close)
🔹 Adjustment
When the TS-line changes, this can be adjusted with a percentage of price , or a multiple of " True Range "
Default (Δ line -> Adjustment - 0)
Δ line -> Adjustment 0.03% (of price)
Δ line -> Mult of TR (10)
🔶 SETTINGS
🔹 LTF: choose your Lower TimeFrame: 1S (seconds), 5S, 10S, 15S, 30S, 1 minute)
🔹 Trigger: Choose the trigger for breaking the Trigger-line ; close or H/L (high when bullish position, low when bearish position)
🔹 Δ line ( Trailing Stop-line ): add/subtract an adjustment when the TS-line changes ( default: Adjustment ):
• Adjustment ( default: 0 ): add/subtract an extra % of price
• Mult of TR : add/subtract a multiple of True Range
🔹 Based on: compare closing price against:
• open
• previous close
🔹 "Neutral-Volume" is considered "Up-Volume" : this setting will dictate whether nV is considered as green 'buy' volume or not.
🔶 CONSIDERATIONS
🔹 The lowest LTF (1S) will give you more detail and will get data close to tick data.
However, a maximum of 100,000 intrabars can be used in calculations .
This means on the daily chart you won't see anything since 1 day ~ 86400 seconds. (just over 1 bar)
-> choose a lower chart timeframe, or choose a higher LTF (5S, 10S, ... 1 minute)
🔹 Always choose a LTF lower than the current chart timeframe.
🔹 Pine Script™ code using this request.security_lower_tf() may calculate differently on historical and real-time bars, leading to repainting .

See inside Candles: Directionality %; Constituent Bars & GapsSee inside candles based on user-input LTF setting: get data on 'Directionality' of your candle; Gaps (total and Sum; UP and DOWN); Number of Bull or Bear constituent candles
//Features:
-DIRECTIONALITY: compare length of the 'zig-zag' random walk of lower time frame constituent candles, to the full height of the current candle. Resulting % I refer to as 'directionality'.
-GAPs: what i refer to as 'gaps' are also known as Volume imbalances: the gap between previous candles close and current candle's open (if there is one).
--Gaps total (up vs down gaps). Number of Up gaps printed above bar in green, down gaps printed below bar in red.
--Gaps Sum (total summed UP gap, total summed down gaps. Sum of Up gaps printed above bar in green, Sum of down gaps printed below bar in red.
-Candles Total: Numer of LTF up vs down candles within current timeframe candle. Number of up candles printed above bar in green, Number of down candles printed below bar in red.
//USAGE:
-Primary purpose in this was the Directionality aspect. Wanted to get a measure of how choppy vs how directional the internals of a candle were. Idea being that a candle with high % directionality (approaching 100) would imply trending conditions; while a candle which was large range and full bodies but had a low % directionality would imply the internals were back-and-forth and => rebalanced, potentially indicating price may not need to retrace back into it and rebalance further. All rather experimental, please treat it as such: have a play around with it.
-Number of gaps, Sums of up and down gaps, ratio of up and down constituent candles also intended to serve a similar purpose as the above.
-Set the input lower timeframe; this must obviously be lower then your current timeframe. You will significant differences in results depending on the ratio your timeframes (chart timeframe vs user-input timeframe).
//User Inputs:
-Lower timeframe input (setting child candle size within current chart parent candle).
-Choose function from the four listed above.
-typical formating options: Bull color/bear color txt for gaps functions.
-display % unit or not.
-display vertical or horizontal text.
-Set min / max directionality thresholds; and color code results.
-Toggle on/off 'hide results outside of threshold' to declutter the chart.
-choose label style.
//NOTES:
-Directionality thresholds can be set manually; Max and Min thresholds can be set to filter out 'non-extreme' readings.
-Note that directionality % can sometimes exceed 100%, in cases where price trends very strongly and gaps up continuously such that sum of constituent candles is less than total range of parent candle.
-Personally i like the idea of seeking bold, large-range, full bodied candles, with a lower than typical directionality %; indicating that a price move is both significant and it's already done it's rebalancing; I would see this as potentially favourable for continuation (obviously depending on context).
---- Showcase of the other functions beyond Directionality percentage ----
Candles Total (bull vs Bear). ES1! Hourly; ltf = 5min: Candles total: LTF up candles and LTF down candles making up the current HTF candle (constituent number of UP candles printed above in green, Down candles printed below in red):
Gaps SUM. SPX hourly, ltf = 5min. Sum of 'UP' gaps within candle printed above in green, sum of 'DOWN' gaps printed below in red:
Gaps TOTAL: SPX hourly, ltf = 1min. Simply the total of 'up' gaps vs 'down' gaps withing our candle; based on the user input constituent candles within:

lower_tf█ OVERVIEW
This library is a Pine programmer’s tool containing functions to help those who use the request.security_lower_tf() function. Its `ltf()` function helps translate user inputs into a lower timeframe string usable with request.security_lower_tf() . Another function, `ltfStats()`, accumulates statistics on processed chart bars and intrabars.
█ CONCEPTS
Chart bars
Chart bars , as referred to in our publications, are bars that occur at the current chart timeframe, as opposed to those that occur at a timeframe that is higher or lower than that of the chart view.
Intrabars
Intrabars are chart bars at a lower timeframe than the chart's. Each 1H chart bar of a 24x7 market will, for example, usually contain 60 intrabars at the LTF of 1min, provided there was market activity during each minute of the hour. Mining information from intrabars can be useful in that it offers traders visibility on the activity inside a chart bar.
Lower timeframes (LTFs)
A lower timeframe is a timeframe that is smaller than the chart's timeframe. This framework exemplifies how authors can determine which LTF to use by examining the chart's timeframe. The LTF determines how many intrabars are examined for each chart bar; the lower the timeframe, the more intrabars are analyzed.
Intrabar precision
The precision of calculations increases with the number of intrabars analyzed for each chart bar. As there is a 100K limit to the number of intrabars that can be analyzed by a script, a trade-off occurs between the number of intrabars analyzed per chart bar and the chart bars for which calculations are possible.
█ `ltf()`
This function returns a timeframe string usable with request.security_lower_tf() . It calculates the returned timeframe by taking into account a user selection between eight different calculation modes and the chart's timeframe. You send it the user's selection, along with the text corresponding to the eight choices from which the user has chosen, and the function returns a corresponding LTF string.
Because the function processes strings and doesn't require recalculation on each bar, using var to declare the variable to which its result is assigned will execute the function only once on bar zero and speed up your script:
var string ltfString = ltf(ltfModeInput, LTF1, LTF2, LTF3, LTF4, LTF5, LTF6, LTF7, LTF8)
The eight choices users can select from are of two types: the first four allow a selection from the desired amount of chart bars to be covered, the last four are choices of a fixed number of intrabars to be analyzed per chart bar. Our example code shows how to structure your input call and then make the call to `ltf()`. By changing the text associated with the `LTF1` to `LTF8` constants, you can tailor it to your preferences while preserving the functionality of `ltf()` because you will be sending those string constants as the function's arguments so it can determine the user's selection. The association between each `LTFx` constant and its calculation mode is fixed, so the order of the arguments is important when you call `ltf()`.
These are the first four modes and the `LTFx` constants corresponding to each:
Covering most chart bars (least precise) — LTF1
Covers all chart bars. This is accomplished by dividing the current timeframe in seconds by 4 and converting that number back to a string in timeframe.period format using secondsToTfString() . Due to the fact that, on premium subscriptions, the typical historical bar count is between 20-25k bars, dividing the timeframe by 4 ensures the highest level of intrabar precision possible while achieving complete coverage for the entire dataset with the maximum allowed 100K intrabars.
Covering some chart bars (less precise) — LTF2
Covering less chart bars (more precise) — LTF3
These levels offer a stepped LTF in relation to the chart timeframe with slightly more, or slightly less precision. The stepped lower timeframe tiers are calculated from the chart timeframe as follows:
Chart Timeframe Lower Timeframe
Less Precise More Precise
< 1hr 1min 1min
< 1D 15min 1min
< 1W 2hr 30min
> 1W 1D 60min
Covering the least chart bars (most precise) — LTF4
Analyzes the maximum quantity of intrabars possible by using the 1min LTF, which also allows the least amount of chart bars to be covered.
The last four modes allow the user to specify a fixed number of intrabars to analyze per chart bar. Users can choose from 12, 24, 50 or 100 intrabars, respectively corresponding to the `LTF5`, `LTF6`, `LTF7` and `LTF8` constants. The value is a target; the function will do its best to come up with a LTF producing the required number of intrabars. Because of considerations such as the length of a ticker's session, rounding of the LTF to the closest allowable timeframe, or the lowest allowable timeframe of 1min intrabars, it is often impossible for the function to find a LTF producing the exact number of intrabars. Requesting 100 intrabars on a 60min chart, for example, can only produce 60 1min intrabars. Higher chart timeframes, tickers with high liquidity or 24x7 markets will produce optimal results.
█ `ltfStats()`
`ltfStats()` returns statistics that will be useful to programmers using intrabar inspection. By analyzing the arrays returned by request.security_lower_tf() in can determine:
• intrabarsInChartBar : The number of intrabars analyzed for each chart bar.
• chartBarsCovered : The number of chart bars where intrabar information is available.
• avgIntrabars : The average number of intrabars analyzed per chart bar. Events like holidays, market activity, or reduced hours sessions can cause the number of intrabars to vary, bar to bar.
The function must be called on each bar to produce reliable results.
█ DEMONSTRATION CODE
Our example code shows how to provide users with an input from which they can select a LTF calculation mode. If you use this library's functions, feel free to reuse our input setup code, including the tooltip providing users with explanations on how it works for them.
We make a simple call to request.security_lower_tf() to fetch the close values of intrabars, but we do not use those values. We simply send the returned array to `ltfStats()` and then plot in the indicator's pane the number of intrabars examined on each bar and its average. We also display an information box showing the user's selection of the LTF calculation mode, the resulting LTF calculated by `ltf()` and some statistics.
█ NOTES
• As in several of our recent publications, this script uses secondsToTfString() to produce a timeframe string in timeframe.period format from a timeframe expressed in seconds.
• The script utilizes display.data_window and display.status_line to restrict the display of certain plots.
These new built-ins allow coders to fine-tune where a script’s plot values are displayed.
• We implement a new recommended best practice for tables which works faster and reduces memory consumption.
Using this new method, tables are declared only once with var , as usual. Then, on bar zero only, we use table.cell() calls to populate the table.
Finally, table.set_*() functions are used to update attributes of table cells on the last bar of the dataset.
This greatly reduces the resources required to render tables. We encourage all Pine Script™ programmers to do the same.
Look first. Then leap.
█ FUNCTIONS
The library contains the following functions:
ltf(userSelection, choice1, choice2, choice3, choice4, choice5, choice6, choice7, choice8)
Selects a LTF from the chart's TF, depending on the `userSelection` input string.
Parameters:
userSelection : (simple string) User-selected input string which must be one of the `choicex` arguments.
choice1 : (simple string) Input selection corresponding to "Least precise, covering most chart bars".
choice2 : (simple string) Input selection corresponding to "Less precise, covering some chart bars".
choice3 : (simple string) Input selection corresponding to "More precise, covering less chart bars".
choice4 : (simple string) Input selection corresponding to "Most precise, 1min intrabars".
choice5 : (simple string) Input selection corresponding to "~12 intrabars per chart bar".
choice6 : (simple string) Input selection corresponding to "~24 intrabars per chart bar".
choice7 : (simple string) Input selection corresponding to "~50 intrabars per chart bar".
choice8 : (simple string) Input selection corresponding to "~100 intrabars per chart bar".
Returns: (simple string) A timeframe string to be used with `request.security_lower_tf()`.
ltfStats()
Returns statistics about analyzed intrabars and chart bars covered by calls to `request.security_lower_tf()`.
Parameters:
intrabarValues : (float [ ]) The ID of a float array containing values fetched by a call to `request.security_lower_tf()`.
Returns: A 3-element tuple: [ (series int) intrabarsInChartBar, (series int) chartBarsCovered, (series float) avgIntrabars ].

AfterHours Spike DetectorThe script pulls Lower Timeframe (30min) data to draw High/Low of Out-of-hours/AfterHours session (post-market session & next day pre-market session) on the Daily regular session chart. It then identifies significant AfterHours price changes and what happens to these price Spikes by the Open of the next day regular session.
You can change:
wether to show AfterHours High/Lows
wether to show AfterHours price Spikes
the AfterHours price Spike threshold (default = +/- 10%)
Magnifying Glass (LTF Candles) by SiddWolf█ OVERVIEW
This indicator displays The Lower TimeFrame Candles in current chart, Like Zooming in on the Candle to see it's Lower TimeFrame Structure. It plots intrabar OHLC data inside a Label along with the volume structure of LTF candle in an eloquent format.
█ QUICK GUIDE
Just apply it to the chart, Hover the mouse on the Label and ta-da you have a Lower Timeframe OHLC candles on your screen. Move the indicator to the top and shrink it all the way up, because all the useful data is inside the label.
Inside the label: The OHLC ltf candles are pretty straightforward. Volume strength of ltf candles is shown at bottom and Volume Profile on the left. Read the Details below for more information.
In the settings, you will find the option to change the UI and can play around with Lower TimeFrame Settings.
█ DETAILS
First of all, I would like to thank the @TradingView team for providing the function to get access to the lower timeframe data. It is because of them that this magical indicator came into existence.
Magnifying Glass indicator displays a Candle's Lower TimeFrame data in Higher timeframe chart. It displays the LTF candles inside a label. It also shows the Volume structure of the lower timeframe candles. Range percentage shown at the bottom is the percentage change between high and low of the current timeframe candle. LTF candle's timeframe is also shown at the bottom on the label.
This indicator is gonna be most useful to the price action traders, which is like every profitable trader.
How this indicator works:
I didn't find any better way to display ltf candles other than labels. Labels are not build for such a complex behaviour, it's a workaround to display this important information.
It gets the lower timeframe information of the candle and uses emojis to display information. The area that is shown, is the range of the current timeframe candle. Range is a difference between high and low of the candle. Range percentage is also shown at the bottom in the label.
I've divided the range area into 20 parts because there are limitation to display data in the labels. Then the code checks out, in what area does the ltf candle body or wick lies, then displays the information using emojis.
The code uses matrix elements for each block and relies heavily on string manipulation. But what I've found most difficult, is managing to fit everything correctly and beautifully so that the view doesn't break.
Volume Structure:
Strength of the Lower TimeFrame Candles is shown at the bottom inside the label. The Higher Volume is shown with the dark shade color and Lower Volume is shown with the light shade. The volume of candles are also ranked, with 1 being the highest volume, so you can see which candle have the maximum to minimum volume. This is pretty important to make a price action analysis of the lower timeframe candles.
Inside the label on the left side you will see the volume profile. As the volume on the bottom shows the strength of each ltf candles, Volume profile on the left shows strength in a particular zone. The Darker the color, the higher the volume in the zone. The Highest volume on the left represents Point of Control (Volume Profile POC) of the candle.
Lower TimeFrame Settings:
There is a limitation for the lowest timeframe you can show for a chart, because there is only so much data you can fit inside a label. A label can show upto 20 blocks of emojis (candle blocks) per row. Magnifying Glass utilizes this behaviour of labels. 16 blocks are used to display ltf candles, 1 for volume profile and two for Open and Close Highlighter.
So for any chart timeframe, ltf candles can be 16th part of htf candle. So 4 hours chart can show as low as 15 minutes of ltf data. I didn't provide the open settings for changing the lower timeframe, as it would give errors in a lot of ways. You can change the timeframe for each chart time from the settings provided.
Limitations:
Like I mentioned earlier, this indicator is a workaround to display ltf candles inside a label. This indicator does not work well on smaller screens. So if you are not able to see the label, zoom out on your browser a bit. Move the indicator to either top or bottom of all indicators and shrink it's space because all details are inside the label.
█ How I use MAGNIFYING GLASS:
This indicator provides you an edge, on top of your existing trading strategy. How you use Magnifying Glass is entirely dependent on your strategy.
I use this indicator to get a broad picture, before getting into a trade. For example I see a Doji or Engulfing or any other famous candlestick pattern on important levels, I hover the mouse on Magnifying Glass, to look for the price action the ltf candles have been through, to make that pattern. I also use it with my "Wick Pressure" indicator, to check price action at wick zones. Whenever I see price touching important supply and demand zones, I check last few candles to read chart like a beautiful price action story.
Also volume is pretty important too. This is what makes Magnifying Glass even better than actual lower timeframe candles. The increasing volume along with up/down trend price shows upward/downward momentum. The sudden burst (peak) in the volume suggests volume climax.
Volume profile on the left can be interpreted as the strength/weakness zones inside a candle. The low volume in a price zone suggests weakness and High volume suggests strength. The Highest volume on the left act as POC for that candle.
Before making any trade, I read the structure of last three or four candles to get the complete price action picture.
█ Conclusion
Magnifying Glass is a well crafted indicator that can be used to track lower timeframe price action. This indicator gives you an edge with the Multi Timeframe Analysis, which I believe is the most important aspect of profitable trading.
~ @SiddWolf

Liquidity Heatmap LTF [LuxAlgo]This indicator displays column heatmaps highlighting candle bodies with the highest associated volume from a lower user selected timeframe.
Settings
LTF Timeframe: Lower timeframe used to retrieve the closing/opening price and volume data. Must be lower than the current chart timeframe.
Other settings control the style of the displayed graphical elements.
Usage
It can be of interest to show which candles from a lower timeframe had the highest associated volume, this allows for the highlighting of areas where a candle body was the most traded by market participants.
The area with the highest activity is highlighted in the script with a yellow color (or another user selected color) and additionally by two lines forming an interval.
When the candle body with the highest volume is overlapped by a candle body with lower volume this one will be highlighted instead, hence why certain areas of high activity might not be highlighted by the heatmap.
It is recommended to hide regular candles or use a more discrete graphical presentation of prices when using this tool. Lines are also displayed to highlight the full candle range as well as if a candle was bullish (in green) or bearish (in red). These lines can be hidden if the user is only interested in the heatmap.

HTF Candle CloseThis draws a label to alert user when a higher timeframe candle closes on a intraday chart.
Purpose of it is so that people who mainly use lower timeframe charts do not forget to look at higher timeframe candle closes.

CactusTrend-8HThis a trend based indicator that can help with finding both low timeframe and high timeframe trends within price action. I personally like to use this indicator on a 8H timeframe (2h also works well), the clouds represent high timeframe trend, bullish when blue and bearish when red. The candles themselves are coloured based on low timeframe trend when red PA is bearish LTF and when blue PA is bullish LTF. I think using both trend indicators together can be pretty rewarding, as it can be super profitable to take LTF profits when price is touching HTF trend support etc.