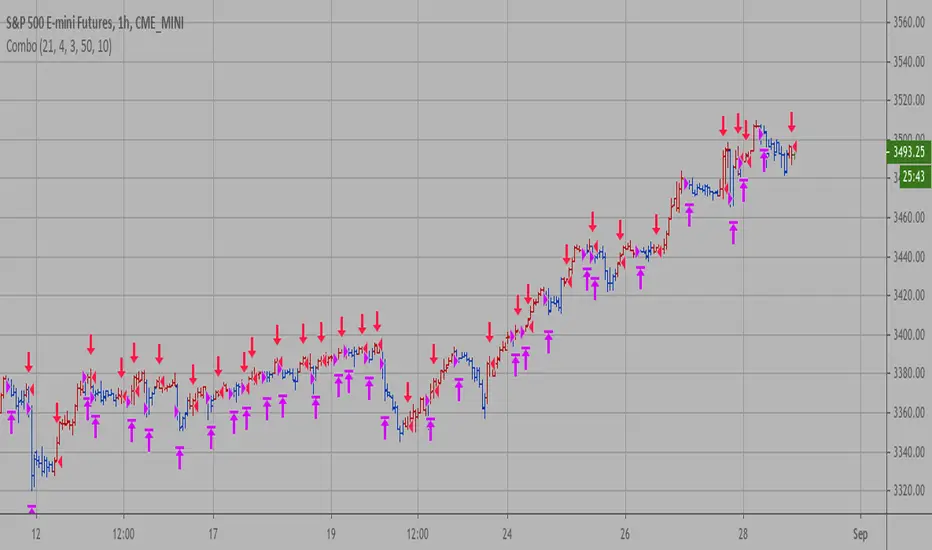
Combo Backtest 123 Reversal & Volume SMA This is combo strategies for get a cumulative signal.
First strategy
This System was created from the Book "How I Tripled My Money In The
Futures Market" by Ulf Jensen, Page 183. This is reverse type of strategies.
The strategy buys at market, if close price is higher than the previous close
during 2 days and the meaning of 9-days Stochastic Slow Oscillator is lower than 50.
The strategy sells at market, if close price is lower than the previous close price
during 2 days and the meaning of 9-days Stochastic Fast Oscillator is higher than 50.
Second strategy
Volume and SMA
WARNING:
- For purpose educate only
- This script to change bars colors.
M-oscillator

Combo Backtest 123 Reversal & Gann Swing Oscillator This is combo strategies for get a cumulative signal.
First strategy
This System was created from the Book "How I Tripled My Money In The
Futures Market" by Ulf Jensen, Page 183. This is reverse type of strategies.
The strategy buys at market, if close price is higher than the previous close
during 2 days and the meaning of 9-days Stochastic Slow Oscillator is lower than 50.
The strategy sells at market, if close price is lower than the previous close price
during 2 days and the meaning of 9-days Stochastic Fast Oscillator is higher than 50.
Second strategy
The Gann Swing Oscillator has been adapted from Robert Krausz's book,
"A W.D. Gann Treasure Discovered". The Gann Swing Oscillator helps
define market swings.
WARNING:
- For purpose educate only
- This script to change bars colors.

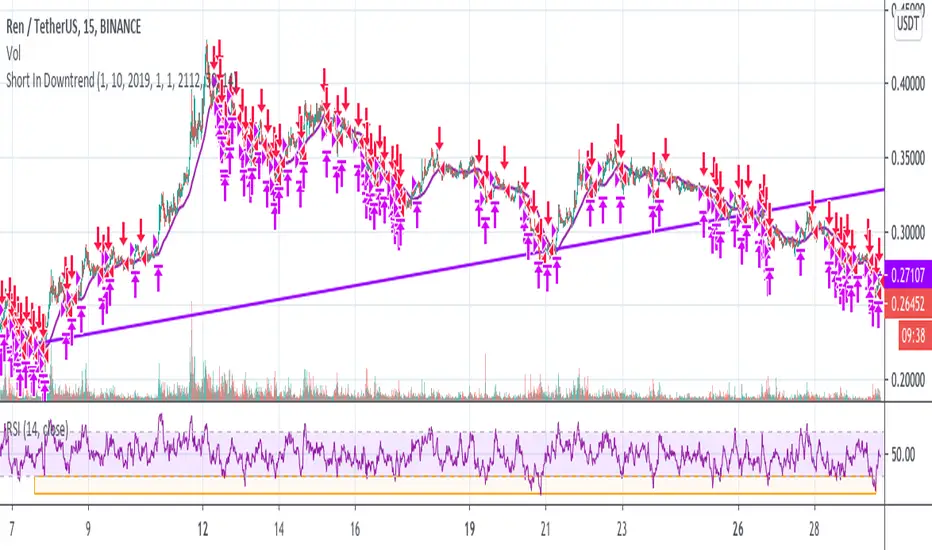
Short In Downtrend Below MA100 (Coinrule)This is a simple strategy to take advantage of downtrends. It's useful to run such a strategy as a hedge in times of market uncertainty.
The Sell Condition - Entry
The sell signal triggers when:
the coin has MA (100) greater than the price in a timeframe of 15 minutes, meaning that the coin is in a short-term downtrend.
the coin has an RSI greater than 30 in a timeframe of 15 minutes, indicating that it didn't reach oversold conditions yet, so there is still room for a further price drop.
On Coinrule, you can launch the strategy on real market conditions, setting up multiple sequential sell orders. The strategy would keep selling while the price stays below the MA(100). In that case, it's advisable to set low amounts for the sell orders. the position will grow gradually while the downtrend intensifies. Set a minimum time interval between the sell orders will also help to have control over the overall position size.
The Buy Condition - Exit
The bot connects to each trade a stop loss and a take profit. The percentages are optimized for short term trades on mid-cap coins. You can adjust the percentages depending on the specific coin you are trading. A ratio of 1:1.5 between the stop loss and the take profit could work as the strategy trades in the same direction of the trend.
Stop loss at 3% from the entry price
Take profit at 2% from the entry price
A slightly larger stop loss allows tolerating more volatility to reduce the case of stops triggering when it shouldn't.
Combo Backtest 123 Reversal & FX Sniper: T3-CCI This is combo strategies for get a cumulative signal.
First strategy
This System was created from the Book "How I Tripled My Money In The
Futures Market" by Ulf Jensen, Page 183. This is reverse type of strategies.
The strategy buys at market, if close price is higher than the previous close
during 2 days and the meaning of 9-days Stochastic Slow Oscillator is lower than 50.
The strategy sells at market, if close price is lower than the previous close price
during 2 days and the meaning of 9-days Stochastic Fast Oscillator is higher than 50.
Second strategy
This simple indicator gives you a lot of useful information - when to enter, when to exit
and how to reduce risks by entering a trade on a double confirmed signal.
You can use in the xPrice any series: Open, High, Low, Close, HL2, HLC3, OHLC4 and ect...
WARNING:
- For purpose educate only
- This script to change bars colors.

Combo Backtest 123 Reversal & Volatility Finite Volume ElementsThis is combo strategies for get a cumulative signal.
First strategy
This System was created from the Book "How I Tripled My Money In The
Futures Market" by Ulf Jensen, Page 183. This is reverse type of strategies.
The strategy buys at market, if close price is higher than the previous close
during 2 days and the meaning of 9-days Stochastic Slow Oscillator is lower than 50.
The strategy sells at market, if close price is lower than the previous close price
during 2 days and the meaning of 9-days Stochastic Fast Oscillator is higher than 50.
Second strategy
This is another version of FVE indicator that we have posted earlier
in this forum.
This version has an important enhancement to the previous one that`s
especially useful with intraday minute charts.
Due to the volatility had not been taken into account to avoid the extra
complication in the formula, the previous formula has some drawbacks:
The main drawback is that the constant cutoff coefficient will overestimate
price changes in minute charts and underestimate corresponding changes in
weekly or monthly charts.
And now the indicator uses adaptive cutoff coefficient which will adjust to
all time frames automatically.
WARNING:
- For purpose educate only
- This script to change bars colors.

Bollinger Bands and RSI mix with DCAThis strategy uses a mix of Bollinger Bands and RSI to enter long positions. It impliments DCA.

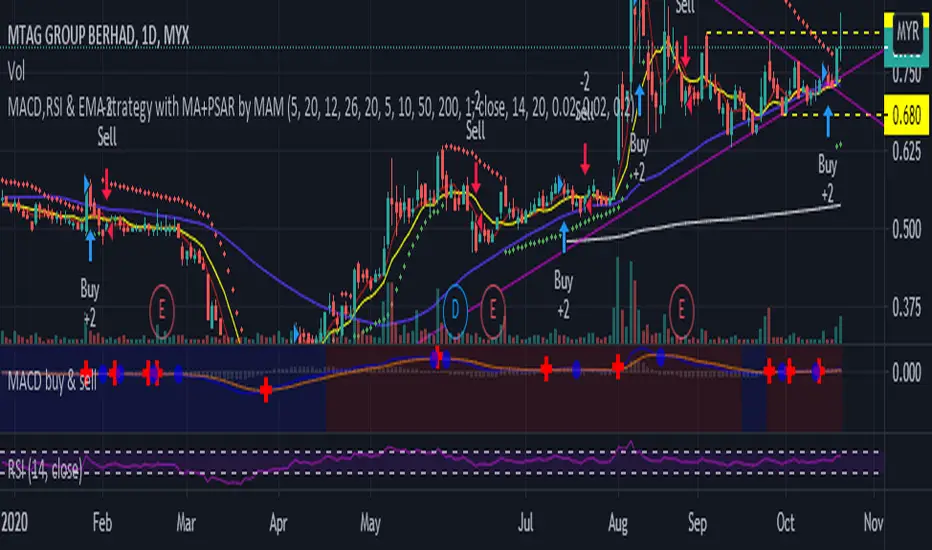
MACD,RSI & EMA strategy with MA+PSAR by MAMMACD,RSI & EMA strategy with MA+PSAR
Buy strategy
- MACD above signal
- RSI above RSI signal
- Close price above EMA
Sell Strategy
- MACD below signal
- RSI below RSI signal
- Close price below EMA
Aroon Oscillator StrategyThis is simple strategy based on Aroon Oscillator. I have found that using length 144 or 169 on hourly chart shows excellent results.
Tested on SPY , QQQ and AAPL. Especially when you look at AAPL results , it has 60% profitable in recent trades. ( Dont assume this will be same for other stocks or ETFs)
Aroon Oscillator setting : 169 ( 169 is square root of 13 ... you can also use fib level 144 , which is square root of 12 )
BUY
When Aroon Oscillator crosses above zero line
Add
if Long position is already opened, and current close is less than BUY price and RSI 13 crossing above 30 line
Exit
when Aroon Oscialltor crosses below zero line
Stop Loss
default stop loss has been set to 5%
Note: I have not plotted RSI to the chart. Please include RSI 13 to see how position gets added ... Also add ema 169 to see how the price is aligned with the Aroon Oscillator
Warning
For the educational purposes only

Combo Backtest 123 Reversal & FSK (Fast and Slow Kurtosis) This is combo strategies for get a cumulative signal.
First strategy
This System was created from the Book "How I Tripled My Money In The
Futures Market" by Ulf Jensen, Page 183. This is reverse type of strategies.
The strategy buys at market, if close price is higher than the previous close
during 2 days and the meaning of 9-days Stochastic Slow Oscillator is lower than 50.
The strategy sells at market, if close price is lower than the previous close price
during 2 days and the meaning of 9-days Stochastic Fast Oscillator is higher than 50.
Second strategy
This indicator plots the Fast & Slow Kurtosis. The Kurtosis is a market
sentiment indicator. The Kurtosis is constructed from three different parts.
The Kurtosis, the Fast Kurtosis(FK), and the Fast/Slow Kurtosis(FSK).
WARNING:
- For purpose educate only
- This script to change bars colors.

Custom Triple Moving Average Strategy | Auto BacktestingCreate your own MA Strategy set of up to three moving averages!
Auto Backtesting.
Cloud between MA1 and MA2.
Many different MA types to choose from.
Totally Custom!
Happy Trading, and algorithm analysis!
Combo Backtest 123 Reversal & Fractal Chaos Oscillator This is combo strategies for get a cumulative signal.
First strategy
This System was created from the Book "How I Tripled My Money In The
Futures Market" by Ulf Jensen, Page 183. This is reverse type of strategies.
The strategy buys at market, if close price is higher than the previous close
during 2 days and the meaning of 9-days Stochastic Slow Oscillator is lower than 50.
The strategy sells at market, if close price is lower than the previous close price
during 2 days and the meaning of 9-days Stochastic Fast Oscillator is higher than 50.
Second strategy
The value of Fractal Chaos Oscillator is calculated as the difference between
the most subtle movements of the market. In general, its value moves between
-1.000 and 1.000. The higher the value of the Fractal Chaos Oscillator, the
more one can say that it follows a certain trend – an increase in prices trend,
or a decrease in prices trend.
Being an indicator expressed in a numeric value, traders say that this is an
indicator that puts a value on the trendiness of the markets. When the FCO reaches
a high value, they initiate the “buy” operation, contrarily when the FCO reaches a
low value, they signal the “sell” action. This is an excellent indicator to use in
intra-day trading.
WARNING:
- For purpose educate only
- This script to change bars colors.

Combo Backtest 123 Reversal & Fractal Chaos Bands This is combo strategies for get a cumulative signal.
First strategy
This System was created from the Book "How I Tripled My Money In The
Futures Market" by Ulf Jensen, Page 183. This is reverse type of strategies.
The strategy buys at market, if close price is higher than the previous close
during 2 days and the meaning of 9-days Stochastic Slow Oscillator is lower than 50.
The strategy sells at market, if close price is lower than the previous close price
during 2 days and the meaning of 9-days Stochastic Fast Oscillator is higher than 50.
Second strategy
Stock market moves in a highly chaotic way, but at a larger scale, the movements
follow a certain pattern that can be applied to shorter or longer periods of time
and we can use Fractal Chaos Bands Indicator to identify those patterns. Basically,
the Fractal Chaos Bands Indicator helps us to identify whether the stock market is
trending or not. When a market is trending, the bands will have a slope and if market
is not trending the bands will flatten out. As the slope of the bands decreases, it
signifies that the market is choppy, insecure and variable. As the graph becomes more
and more abrupt, be it going up or down, the significance is that the market becomes
trendy, or stable. Fractal Chaos Bands Indicator is used similarly to other bands-indicator
(Bollinger bands for instance), offering trading opportunities when price moves above or
under the fractal lines.
The FCB indicator looks back in time depending on the number of time periods trader selected
to plot the indicator. The upper fractal line is made by plotting stock price highs and the
lower fractal line is made by plotting stock price lows. Essentially, the Fractal Chaos Bands
show an overall panorama of the price movement, as they filter out the insignificant fluctuations
of the stock price.
WARNING:
- For purpose educate only
- This script to change bars colors.

ADX strategy (considering ADX and +DI only )I have been checking the strategies on ADX indicator.
I have found that +DI crossing above ADX line under threshold 30 and exit on crossdown when ADX above 30 has better results than just following crossovers of +DI and -DI , ADX crossing above 30 .
BUY Rule
========
fast ema is above slow ema (default 13 and 55 , you can change these values in settings)
+DI cross above ADX well beloe threshold level (default 30)
Exit reule
========
when +DI cross down ADX , well above on threshold level
Stop Loss
=========
Default is set to 8%
Take a look and let me know how your symbol works with this strategy
Note : Bar color changes to yellow when the BUY condition is met.
Bar color and Background color shows to blue --- if Long position is active
fast ema and long ema doesnt print on the chart -- please add manually to the chart
Warning : for the use of educational purposes only

Combo Backtest 123 Reversal & Floor Pivot Points This is combo strategies for get a cumulative signal.
First strategy
This System was created from the Book "How I Tripled My Money In The
Futures Market" by Ulf Jensen, Page 183. This is reverse type of strategies.
The strategy buys at market, if close price is higher than the previous close
during 2 days and the meaning of 9-days Stochastic Slow Oscillator is lower than 50.
The strategy sells at market, if close price is lower than the previous close price
during 2 days and the meaning of 9-days Stochastic Fast Oscillator is higher than 50.
Second strategy
The name ‘Floor-Trader Pivot,’ came from the fact that Pivot points can
be calculated quickly, on the fly using price data from the previous day
as an input. Although time-frames of less than a day can be used, Pivots are
commonly plotted on the Daily Chart; using price data from the previous day’s
trading activity.
WARNING:
- For purpose educate only
- This script to change bars colors.

RSI cyclic smoothed strategy backtestI added a few lines of code to "when to trade"'s code to see that backtest result of "RSI cyclic smoothed v2".
Daytrader strategies for major currenciesHello,
This technique is for those who want the most simple method that is almost fool-proof. It must be done only during the busiest trading hours, 3 am to 11 am EST. This method doesn't work in sideways markets, only in volatile trending markets.
Indicators:
Ema 3
MA 20
Awesome Oscillator.
Enter Long: when the red 3 EMA has crossed up through the middle band at the same time, the AO should be approaching or crossing it's zero line, going up.
Enter Short: when the red 3 EMA has crossed down through the middle band at the same time, the AO should be approaching or crossing it's zero line, going down.
In this strategy, both the entry and exit happen only during the london session.

Wavetrend strategy with trading session for any time chartHello there
Today I am glad to provide you a strategy based on the wave trend oscillator. If you want to use it as an indicator, just disable long and short to not make any shops.
It works on all time frames.
The way it works its like an RSI .
We have overbought and oversold levels, and together with a channel and length we calculate the wave trend.
And then like in RSI, when we cross those lines we buy or sell depending on which lines we cross.
For risk management, so far its not implemented, but it can be done in many ways.
The only thing I applied is to always close a trade at the end of friday day. At the same time it can be applied the rule to sell when % of equity is lost, or at the end of a trading session like london,neywork and so on.
For any questions or doubts, let me know.
Hope you enjoy it :)

Coppock Curve StrategyThis strategy makes use of a not widely known technical indicator called "Coppock Curve".
The indicator is derived by taking a weighted moving average of the rate-of-change (ROC) of a market index such as the S&P 500 or a trading equivalent such as the S&P 500 SPDR ETF. For more info: (www.investopedia.com)
This strategy uses $SPY Coppock curve as a proxy to generate buy signals on other ETF's and stocks.
Buy signals are generated when the Coppock Curve crosses above zero, and sell signals are generated when it crosses below.
An optional, trailing stop loss is available, with default settings to 100% so that it does not currently affect the buy and sell signals solely generated by the Coppock Curve. But you may find adding a Trailing stop loss may improve results on certain ETF's/Stocks.
You may also change the symbol for which signals are generated for, default is $SPY.
The published example shows using this strategy on a leverage ETF $TQQQ w/ starting capital of 10k, w/ 10k per trade. Try it on other stocks such as $AAPL, $AMZN $NFLX ect... I have found it to be an effective strategy that has a favorable risk to reward profile.
Any questions, please let me know!

Combo Backtest 123 Reversal & Future Lines of Demarcation This is combo strategies for get a cumulative signal.
First strategy
This System was created from the Book "How I Tripled My Money In The
Futures Market" by Ulf Jensen, Page 183. This is reverse type of strategies.
The strategy buys at market, if close price is higher than the previous close
during 2 days and the meaning of 9-days Stochastic Slow Oscillator is lower than 50.
The strategy sells at market, if close price is lower than the previous close price
during 2 days and the meaning of 9-days Stochastic Fast Oscillator is higher than 50.
Second strategy
An FLD is a line that is plotted on the same scale as the price and is in fact the
price itself displaced to the right (into the future) by (approximately) half the
wavelength of the cycle for which the FLD is plotted. There are three FLD's that can be
plotted for each cycle:
An FLD based on the median price.
An FLD based on the high price.
An FLD based on the low price.
WARNING:
- For purpose educate only
- This script to change bars colors.

EURUSD 5min london session strategyHey, today I bring you another strategy that I pull up together.
Its a KISS system ( keep it stupid simple )
We have 2 ma of 5 lenght each, one applied to the high and the other to low. With this we create a channel.
If the candle close above or below the channel we got a signal. Then we can optionally verify with the RSI to increase our chances.
At the same time, this system, only trades during the london session ( can be changed), and it has 2 rules, preferably no more than 5 trades / day, and no more than 2% risk of equity lost .
We also have a TP/SL system made of pips.
Enjoy it.

Simple and efficient 1h strategyThis strategy is made from a crossover of 2 ema : 4 and 8 in this case, together with a RSI of lenght 10 applied to hl2
The strategy is simple : we enter when we have a cross between the 2 ma's and rsi at the same time is in ascending or descending position crossing the middle line of 50.
For exit we have : at the end of a session( we trade only between london and newyork in this case, so we exit newyork), or through a tp/sl pip point system.
Hope you enjoy it.

VWAP and RSI strategyThis strategy combines VWAP and RSI indicators
BUY RULE
1. EMA50 > EMA 200
2. if current close > vwap session value and close>open
3. check if RSI3 is dipped below 10 for any of last 10 candles (as defined rsi_buy_level)
EXIT RULE
1. RSI3 crossing down 90 level (as defined in rsi_sell_level)
STOP LOSS EXIT
1. default is set to 5%
you need to add EMA 50 , EMA 200 and VWAP (session) indicators to the chart to see how these signals are generated
This strategy is tested on SPY and QQQ index stocks on hourly chart.
Warning
for educational purposes only
Combo Backtest 123 Reversal & Fisher Transform Indicator This is combo strategies for get a cumulative signal.
First strategy
This System was created from the Book "How I Tripled My Money In The
Futures Market" by Ulf Jensen, Page 183. This is reverse type of strategies.
The strategy buys at market, if close price is higher than the previous close
during 2 days and the meaning of 9-days Stochastic Slow Oscillator is lower than 50.
The strategy sells at market, if close price is lower than the previous close price
during 2 days and the meaning of 9-days Stochastic Fast Oscillator is higher than 50.
Second strategy
Market prices do not have a Gaussian probability density function
as many traders think. Their probability curve is not bell-shaped.
But trader can create a nearly Gaussian PDF for prices by normalizing
them or creating a normalized indicator such as the relative strength
index and applying the Fisher transform. Such a transformed output
creates the peak swings as relatively rare events.
Fisher transform formula is: y = 0.5 * ln ((1+x)/(1-x))
The sharp turning points of these peak swings clearly and unambiguously
identify price reversals in a timely manner.
WARNING:
- For purpose educate only
- This script to change bars colors.