Grid SystemThis script plots a a square composed of 8 equilateral triangles ("grid"). User can set the frequency of calculation/interval by adjusting the 't' parameter.
Steps for calculating grid:
1. Find the highest high and lowest low for last 't' periods.
2. Calculate midpoint for prices during that interval (highest high + lowest low) / 2.
3. Center of the grid = {time , price midpoint}.
Interpretation:
Volatility : If price is volatile for a given period, the area of the grid will expand, since the top and bottom sides are based on the highest high and lowest low for the period. So as range for a given period increases, the grid's area increases.
Support and resistance : The grid's center line often acts as the support / resistance line.
Trend Following : The example chart shows Cognex (CGNX) price using an interval of t=365. When the stock's trend was bullish, the area of the grids became increasingly larger and the y-coordinate of each grid was greater than that of the previous grid.
Market Geometry

[JRL] Murrey Math LinesMurrey Math Lines are support and resistance lines based on geometric mathematical formulas developed by T.
H. Murrey. MM lines are a derivation of the observations of W.D. Gann. Murrey's geometry facilitate the use of Gann's theories in a somewhat easier application. According to Gann's theory, price tends to trend and retrace in 1/8th intervals. The most important MM line levels are the 0/8, 4/8 and 8/8 levels, which typically provide strong support and resistance points. The 3/8 and 5/8 levels represent the low and high of the typical trading range. When price is above the typical trading range, it is considered overbought, and when it is below it is considered oversold. The 2/8 and 6/8 levels provide strong pivot points.
Some of the other Murrey Math indicators on TradingView use different formulas and therefore produce varying results. I've checked my indicator against MM indicators on other platforms and it is consistent with those indicators.
This indicator also allows users to switch to alternative timeframes for analysis and it includes labels for the MM lines. If you have any suggestions or comments, please leave them below.
Cheers!

[RS]Function - Geometric Line Drawingsfunctions using the new line functions in V4 to draw multiple geometric shapes.

MC Market StructureMC Market Structure © is one of the five MC Fractal Studies ©
MC Fractal Studies (c) disassemble the market data in an objective way and organize charts information in order to identify all the various Waves on all the various fractal scales, that make up the typical market charts, and show them to the eyes of investors in an inclusive but detailed way.
The ability to view and examine the multi-scale fractal market structure of a chart can immensely help an investor, giving him an edge that can be used to increase trading performance.

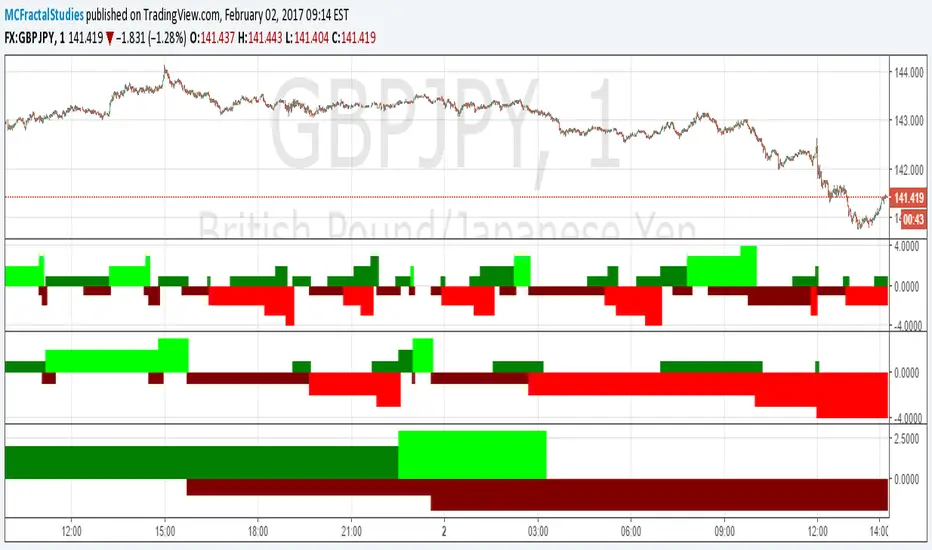
MC Waves OscillatorMC Waves Oscillator © is one of the five MC Fractal Studies ©
MC Fractal Studies (c) disassemble the market data in an objective way and organize charts information in order to identify all the various Waves on all the various fractal scales, that make up the typical market charts, and show them to the eyes of investors in an inclusive but detailed way.
The ability to view and examine the multi-scale fractal market structure of a chart can immensely help an investor, giving him an edge that can be used to increase trading performance.

MC Waves SizeMC Waves Size © is one of the five MC Fractal Studies ©
MC Fractal Studies (c) disassemble the market data in an objective way and organize charts information in order to identify all the various Waves on all the various fractal scales, that make up the typical market charts, and show them to the eyes of investors in an inclusive but detailed way.
The ability to view and examine the multi-scale fractal market structure of a chart can immensely help an investor, giving him an edge that can be used to increase trading performance.

MC Wave Structure OnChartMC Wave Structure OnChart © is one of the five MC Fractal Studies ©
MC Fractal Studies (c) disassemble the market data in an objective way and organize charts information in order to identify all the various Waves on all the various fractal scales, that make up the typical market charts, and show them to the eyes of investors in an inclusive but detailed way.
The ability to view and examine the multi-scale fractal market structure of a chart can immensely help an investor, giving him an edge that can be used to increase trading performance.

MC Market Structure OscillatorMC Market Structure Oscillator © is one of the five MC Fractal Studies ©
MC Fractal Studies (c) disassemble the market data in an objective way and organize charts information in order to identify all the various Waves on all the various fractal scales, that make up the typical market charts, and show them to the eyes of investors in an inclusive but detailed way.
The ability to view and examine the multi-scale fractal market structure of a chart can immensely help an investor, giving him an edge that can be used to increase trading performance.