Scalping Acciones PRO (Entradas + TP + SL) leo
How to use it correctly
• Timeframe: 1m or 5m
• High-volume stocks (SPY, AAPL, TSLA, NVDA…)
• Take Profit (TP): VWAP or EMA 21
• Stop Loss (SL): low/high of the signal candle
⸻
If you want, in the next message I can:
• 🔧 add automatic Stop Loss and Take Profit
• 🚀 convert it into a strategy (Strategy Tester)
• 🎯 filter only strong reversals (fewer false signals)
Moving Averages

Hosoda ZHosoda’s Clouds is a trend-following strategy designed to trade only long positions in traditionally trending markets with a strong bullish bias: SPY(D); DJI (D); NDX (D); XAUUSD (D); Tesla (D, H4, H1); AAPL (D, H4, H1); GOOG (D, H4); META (D, H4); NVDA (D, H4); AMZN(D, H4).
Strategy Parameters
Initial Capital: $10,000 USD.
Position Size: Risks 10% of your equity per trade.
Commission: 0.1%
Indicators
The strategy combines two main technical tools:
A. Ichimoku Cloud This is the core of the strategy. It calculates the classic lines:
• Tenkan-sen (Fast Line): Average of the highest high and lowest low of the last 9 periods.
• Kijun-sen (Base Line): Average of the last 26 periods.
• Cloud (Senkou Span A and B): Projects future support/resistance.
B. EMA 500 (Trend Filter)
• A 500-period Exponential Moving Average is calculated.
• Function: Serves as a very long-term trend filter. If the price is above the EMA 500, the market is considered bullish in the long term.
Entry Rules
• Bullish Cross (Bull Cross): The fast line (Tenkan) crosses above the base line (Kijun). This is the classic Ichimoku entry signal.
• Trend Filter (Optional):
•If you check the "Enable EMA Filter" box in the options, the system will only buy if the closing price is above the EMA 500.
•If the box is unchecked, it will ignore the EMA and buy based solely on the Ichimoku cross.
Exit Rules
A. Stop Loss (Loss Protection) It is a dynamic Stop Loss based on market structure, not a fixed percentage.
• At the moment of entry, the code looks back 12 bars (configurable in sl_bars_back) and finds the lowest price (low).
• It places the Stop Loss at that minimum level.
• Visual: Draws a dotted red line on the chart showing where your Stop Loss is.
B. Technical Take Profit (Exit due to Weakness) Lets profits run until the trend shows weakness.
• Condition: Closes the trade if the Tenkan line crosses below the bottom of the Cloud .
• This means short-term momentum has been lost and the price has entered or crossed below the cloud.
Statistics Panel
In the top right corner, the code draws a table (Panel) that updates in real-time or at the end of Backtesting. It shows:
• Total P&L: Net profit or loss in dollars.
• Win Rate: Percentage of winning trades.
• Trades: Total number of trades executed.
Summary
1. The script waits for the blue line (Tenkan) to cross over the red line (Kijun).
2. It verifies if the price is above the orange line (EMA 500) (if the filter is active).
3. If so, it BUYS.
4. It immediately places a Stop Loss at the low of the last 12 candles (red dotted line).
5. It keeps the trade open until the Stop Loss is hit or until the Tenkan line drops below the Cloud.
Customizable Settings
• Whether to use the EMA filter or not.
• The EMA length (default is 500).
• The Ichimoku periods (9, 26, 52 are standard).
• How many bars to look back to set the Stop Loss.

MARKET CONDITIONS TOOLBOX PROMARKET CONDITIONS TOOLBOX PRO** is a visual market-state dashboard designed to summarize multiple technical conditions of the S&P 500 ETF (SPY) in a single table.
The script pulls SPY data from user-selectable higher timeframes (daily by default) and evaluates several widely used technical indicators, converting each into a simple **Bullish / Neutral / Bearish** status. The results are displayed in a compact table for quick reference.
Indicators included:
-Directional Strength (based on directional movement)
-MACD (positive vs. negative momentum)
-RSI (above or below midpoint)
-Stochastic Oscillator
-CCI
-Momentum Velocity (custom weighted momentum calculation)
-SPY daily candle direction (green/red/neutral)
Each indicator is assessed independently using objective threshold rules (for example, above or below zero or 50). No indicator is modified to repaint or look ahead.
An overall Market Condition is shown:
-Bullish when all indicators and the SPY daily candle align positively
-Bearish* when all indicators and the SPY daily candle align negatively
-Neutral when conditions are mixed
A simplified -Risk Status- (“Risk On”, “Risk Off”, or “Neutral”) mirrors this alignment to provide a high-level market context.
Key characteristics:
-Uses SPY as a broad market proxy
-Multi-timeframe capable via user inputs
-Non-predictive, informational display only
-No alerts, trade entries, exits, or signals
-Designed for market context, not automation
I use this tool really to gauge risk, when i'm paying with the direction of the market, when to risk off.

UT Bot + SMC PRO (PROP) + VISUAL SIGNALS-DE ALEJANDRO PONCEHOW TO USE THEM TOGETHER (GOLDEN RULE)
Reading Sequence
UT → without B Bounce / pullback
B → without UT Weak break
UT → B (same direction) ✅ Valid setup
UT ↔ Opposite Bs Noise / range

HSI Long & Short: BG + EMA330Strategy: HSI 5-min mean-reversion with EMA10/20 crossover and EMA330 filter.
Background green (EMA10 > EMA20) or red (EMA10 < EMA20).
Long entry: Background turns green AND price below EMA330.
Short entry: Background turns red AND price above EMA330.
Exit long: Background turns red.
Exit short: Background turns green.
No new entries 15:01–16:00 HKT.
Reverses position on signals; 100% equity per trade.

Buy the dips StrategyThis strategy getting in long position only after the price drop- Buy the dips
The % of the drop is Determined by SMA for the first trade
The inputs of SMA and % of the drop can be adjust from the User
After that Strategy start taking safe trades if not take profit from the first trade
The safe trades are Determined by step down deviation % and by quantity
There is no Stop loss is not for one with small tolerance to getting under
if any question ask

[TradingPulse] - Overlay+ PRO ScalpingTrade like a don on 1 min scalps.
sdäajdfkjsKLÖJfd#
sf
dasfd
asfa
dadf
affdsa
affda
adfs

3VWMA MTF3VWMA MTF – IRONGAR plots three Volume Weighted Moving Averages (VWMA) on your chart, with multi-timeframe support.
-It is designed to help traders identify trend direction, dynamic support & resistance, and
volume-confirmed momentum across different timeframes — all in one clean indicator.
-The indicator calculates three separate VWMAs:
VWMA 7 (Green) – Short-term momentum
VWMA 25 (Blue) – Medium-term trend
VWMA 99 (Red) – Long-term structure
-You can choose:
Chart timeframe (default), or
A custom higher/lower timeframe using the VWMA Timeframe input
-Each VWMA is calculated on the selected timeframe and plotted on the current chart.
A Volume Weighted Moving Average (VWMA) gives more weight to candles with higher trading volume.
-Formula: VWMA = Σ(Price × Volume) / Σ(Volume)
This means:
High-volume moves have more influence
Low-volume noise has less impact
Best used in combination with price action and proper risk management.
-Huge shoutout to my teacher @tradecitypro for all his time and effort. I'm so grateful!
-Next, I will break down my strategy and show you how to apply it for yourself.
simple and easy :))))

Colored HMA + Color SARThis is a simple yet effective chart setup that I really like and trade with. I use the Heiken Ashi candlesticks so with this I get three conformations in one. If you like it great. I am not a coder but I do know what works for my brain and thought I would share this, thanks to Chat GBT.
I use it for entry most of the time on the 5 minute chart New York open. I also like the Orb break and retest by Quant Crawler as my second indicator.

ZLSMA AO Session Strategy by kernchentradingStrategy Logic
Trend Filter:
The ZLSMA is used to determine the prevailing short-term direction. Long signals are only considered when price is above the ZLSMA, while short signals are only considered when price is below it.
Momentum Confirmation:
The Awesome Oscillator is used to detect momentum shifts. Entries occur only when a multi-period sequence of rising or falling AO values is present, indicating the start of a new impulse.
Entries:
Long: Positive momentum in the AO combined with price trading above the ZLSMA
Short: Negative momentum in the AO combined with price trading below the ZLSMA
Only one position per direction is held at any time.
Exits:
Positions are closed when momentum weakens according to the AO or when a predefined pip threshold is reached.
Trading Hours:
The strategy uses a time filter and trades only during specified hours to avoid periods of low liquidity.
Parameters
ZLSMA length and offset
Position size (volume)
Timeframe and Notes:
I trade Gold using this strategy on the 5-minute and 15-minute charts. In flat, sideways market conditions, the ZLSMA has weaknesses. In such cases, it can be helpful to use an additional trend strength indicator (e.g., TSI). In general, the greater the distance between price and the ZLSMA, the more reliable the signal tends to be.

EMA/SMA Full color signal candles💡 What It Does:
The indicator calculates and plots the 21-period Exponential Moving Average (EMA) and the 30-period Simple Moving Average (SMA). It then analyzes the closing price of each candle and colors the entire candlestick (body and border) according to pre-defined trend conditions.
This visualization allows traders to identify strong trend environments versus periods of consolidation or indecision at a glance, removing the need to constantly check the price relationship manually.
🎨 Color Conditions and Meaning:
The indicator uses three distinct color states to signal the market's current momentum:
Color,Condition,Market Interpretation
🟢 GREEN,Closing Price is ABOVE both the 21 EMA AND the 30 SMA.,Strong Bullish Trend: Suggests high momentum and confirmation of an uptrend. Ideal for long bias.
🔴 RED,Closing Price is BELOW both the 21 EMA AND the 30 SMA.,Strong Bearish Trend: Suggests high downward pressure and confirmation of a downtrend. Ideal for short bias.
⚫ GRAY,"Closing Price is in any other state (e.g., between the two MAs, or under one and over the other).","Neutral / Consolidation: Indicates uncertainty, low momentum, or potential trend exhaustion/reversal. Caution is advised."
🔧 Customization Options:The indicator is fully customizable, allowing users to fine-tune the periods to match their preferred trading style (e.g., scalping, swing trading).Dĺžka EMA (Length EMA): Allows you to change the period for the Exponential Moving Average (default is 21).Dĺžka SMA (Length SMA): Allows you to change the period for the Simple Moving Average (default is 30).
I added also Extra 4 EMA lines to have extra edge.
EMA SMA Rhythmic Lite Public V1.1 by SRTEMA SMA Rhythmic Lite Public V1.1 by SRT
A clean, lightweight trend-rhythm engine designed for traders of all levels. Built on a robust combination of EMAs and SMAs, this indicator provides clear directional bias signals while remaining fully non-repainting.
Key Features:
Multi-Timeframe Friendly: Works seamlessly on M1 to Daily (D) charts. MA stacking and signal logic automatically adapt to any timeframe.
Bias Detection: Determines bullish, bearish, or neutral market conditions using a 4-MA stack.
Engulfing Bar (EB) & Long-Tail Body (LTB) Detection: Highlights strong price action setups, filtered by body size and ATR-based thresholds.
Flush Markers: Visual cues showing where price aligns with MA stack for trend confirmation.
Bias Table: Displays current MA bias and presence of LTB on the chart for at-a-glance clarity.
Advanced Alerts:
Flush Alerts: Trigger when MA stack aligns with price, signaling trend continuation.
Combo Alerts: Trigger when EB or LTB appears in alignment with MA bias.
LTB-only Alerts: For monitoring significant price action reversals.
Customizable Visualization: Colors, widths, and visibility of all MAs, labels, and flush dots can be tailored to your preference.
Why Lite?
This is the most lightweight version in the SRT rhythm series, optimized for any timeframe, from scalping to swing trading. Perfect for traders who want a clear bias engine without unnecessary complexity.
If you like this EMA SMA Rhythmic Lite, you may also explore:
▶ H1 Bias Rhythmic Lite Public (Free)
▶ SRT Premium Series
Invite-only advanced indicators with stronger bias enforcement and execution frameworks.

Multiple SMAs-EMAs & CrossesMoving averages (MA) are the bedrock of trend analysis. Choosing between Simple (SMA) and Exponential (EMA) depends on whether you prioritize stability or speed.SMA vs. EMA: The Main DifferenceThe core difference lies in how they handle data.
Simple Moving Average (SMA): Treats all days equally. A 50-day SMA averages the last 50 closing prices with no bias. It is smoother and less prone to "fake-outs," making it the gold standard for identifying long-term trends (e.g., the 200-day SMA).
Exponential Moving Average (EMA): Places more weight on the most recent price data. It reacts much faster to sudden market shifts. Short-term traders (scalpers and day traders) prefer EMAs to catch trend changes early.
The Crossover Strategy
A crossover occurs when a "fast" (short-period) MA crosses a "slow" (long-period) MA. This signals a shift in market momentum.
Golden Cross: Fast MA (e.g., 50) crosses above Slow MA (e.g., 200). Bullish: Indicates a potential long-term uptrend.
Death Cross: Fast MA (e.g., 50) crosses below Slow MA (e.g., 200).Bearish: Indicates a potential long-term downtrend.
Using Multiple Moving Averages, Traders often use a "ribbon" or a stack of three MAs to filter noise: Short-term (e.g., 9 or 20): Shows immediate price direction.Medium-term (e.g., 50): Acts as a trend filter and dynamic support/resistance. Long-term (e.g., 200): Defines the "big picture" macro trend.


CS Trendline ProTitle: CS Trendline Pro
Description:
CS Trendline Pro is a comprehensive scalping and day-trading system designed to filter out noise and identify high-probability breakout setups. It combines the structural precision of Fractal Trendlines with a robust Dual-EMA Filter, visualized through an intuitive "Traffic Light" color system.
This tool is specifically engineered for traders who want to trade Trendline Breakouts but need a safety mechanism to avoid false signals (fakeouts) and counter-trend traps.
🚦 How the "Traffic Light" Logic Works
The core feature of this script is the dynamic coloring of the candles, which acts as a visual filter for your entries:
🟢 GREEN Zone (Safe Buy):
Condition: A Bullish Trendline Breakout has occurred AND the price is holding ABOVE the EMA 30 (Yellow Line).
Meaning: Momentum is bullish, and you are in a safe zone to look for Long entries.
🔴 RED Zone (Safe Sell):
Condition: A Bearish Trendline Breakout has occurred AND the price is holding BELOW the EMA 30 (Yellow Line).
Meaning: Momentum is bearish, and you are in a safe zone to look for Short entries.
⚪ GRAY Zone (No Trade / Wait):
Condition: A breakout occurred, but the price is on the "wrong side" of the EMA 30.
Meaning: Indecision. The market structure is conflicting with the immediate momentum. It is recommended to stay out until the color changes.
🛠️ Key Features
** automated Trendlines:** Automatically draws Support and Resistance dynamic trendlines based on pivot points (LuxAlgo engine).
Dual EMA Filter:
EMA 30 (Yellow): Acts as the immediate "Safe Zone" filter.
EMA 200 (White): Displays the macro trend. (Pro Tip: Only take Green signals if price is above the White line).
CS-BUY / CS-SELL Labels: Clear text markers appear exactly when a valid breakout occurs.
Customizable: Adjustable sensitivity (Length), EMA periods, and Slope calculation methods (ATR, Stdev, Linreg).
📉 How to Trade with CS Trendline Pro
For Scalping (5m / 15m):
Identify the Main Trend: Look at the White EMA (200).
If Price > EMA 200 → Focus on BUY signals.
If Price < EMA 200 → Focus on SELL signals.
Wait for the Signal:
Wait for the candle to turn Teal (Green) or Red.
Ensure the candle closes with the new color.
Risk Management:
Place Stop Loss below the recent swing low (for buys) or above the swing high (for sells).
Target a 1.5 Risk/Reward ratio or trail your stop using the EMA 30.
⚠️ Important Note on Backpainting
This indicator uses pivot points to draw trendlines. By nature, a pivot point can only be confirmed after a few bars have passed (Lag).
Backpaint Setting (Default ON): Keeps your historical chart clean by connecting the exact pivot points in the past.
Real-Time Behavior: In live trading, the trendline and signal will appear once the pivot is confirmed (based on your 'Length' setting). This is normal behavior for any trendline script.
Settings Recommended:
5-Minute Chart: Length 10 or 14.
15-Minute Chart: Length 14.
Enjoy trading with precision! ~ CS Trading


Sell-to-Buy Pressure RatioSell/Buy Pressure Ratio
What It Measures
The Sell/Buy Pressure Ratio quantifies the aggressiveness of sellers versus buyers by comparing conviction-weighted volume on down candles versus up candles. It answers a simple question: who is more committed right now—buyers or sellers?
How It Works
The indicator examines each candle and determines directional conviction based on where price closes within the bar's range. A candle that closes near its high shows strong buyer conviction. A candle that closes near its low shows strong seller conviction. This conviction percentage is then multiplied by volume to create a weighted measure of buying and selling pressure.
The ratio divides total selling pressure by total buying pressure over a lookback period. A ratio of 1.5 means sellers are 50% more aggressive than buyers. A ratio of 0.5 means buyers are twice as aggressive as sellers.
Key Features
Conviction weighting: Not all volume is equal. A strong close near the high counts more than a weak close mid-range.
Doji handling: Indecisive candles (where open and close are nearly equal) split volume 50/50 between buyers and sellers.
Volume filtering: Low-volume bars below 60% of average are excluded to focus on meaningful activity.
Normalized output: Optional -1 to +1 scale for cross-stock comparison.
Interpretation
RatioMeaning≤ 0.5Strong buyers — accumulation, continuation setups0.5 – 0.8Buyers favored — healthy environment for longs0.8 – 1.2Balanced — equilibrium, wait for direction1.2 – 1.5Sellers favored — caution warranted≥ 1.5Strong sellers — distribution, avoid new longs
Primary Use
Timing entries within confirmed trends. The ratio identifies when selling pressure has exhausted itself, signaling safer entry points. Rather than buying strength, traders wait for the ratio to transition from elevated levels back toward equilibrium—buying when selling stops being dangerous.
What It Does Not Do
This indicator does not predict direction. It measures current pressure dynamics. Pair it with trend analysis (moving averages, price structure) to determine direction, then use the pressure ratio to time entries and exits.

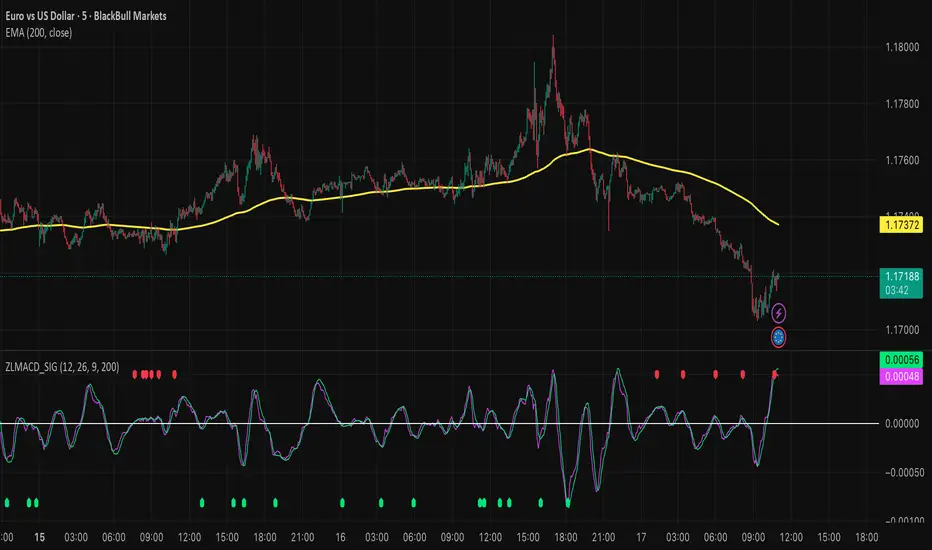
Zero Lag MACD and EMA 200 with SignalsZero Lag MACD with EMA Filter and Smart Signals
This indicator is an enhanced version of the traditional MACD that uses Zero Lag EMA calculations to provide faster and more responsive signals for scalping and day trading.
Key Features:
🎯 Zero Lag Technology - Uses double-smoothed EMA calculations to eliminate lag and provide earlier signals compared to standard MACD
📊 Clean Visualization - Displays histogram with MACD and Signal lines for clear trend analysis
🔍 Smart Signal Logic - Only shows valid trading signals based on strict conditions:
Buy Signal (Green dot at bottom): Triggers when price is above 200 EMA AND MACD crosses Signal line from below AND crossover occurs below zero line
Sell Signal (Red dot at top): Triggers when price is below 200 EMA AND MACD crosses Signal line from above AND crossover occurs above zero line
🔔 Built-in Alerts - Easy alert setup for both buy and sell signals so you never miss a trading opportunity
📈 200 EMA Filter - Incorporates trend filter to avoid counter-trend trades and improve signal quality
⚙️ Fully Customizable - Adjust all parameters:
Fast EMA Length (default: 12)
Slow EMA Length (default: 26)
Signal Length (default: 9)
EMA Filter Length (default: 200)
How to Use:
-Add the indicator to your chart
-Look for green dots (buy signals) when price is in an uptrend above 200 EMA
-Look for red dots (sell signals) when price is in a downtrend below 200 EMA
-Set up alerts by clicking "Create Alert" and selecting "Buy Signal" or "Sell Signal"
-Use signals in conjunction with your trading strategy and risk management
Best Practices:
-Works best on 1-15 minute timeframes for scalping
-Combine with support/resistance levels for confirmation
-Use proper stop-loss and take-profit levels
-Not all signals will be profitable - use proper risk management
-Signals are filtered to reduce noise and false entries
Color Scheme:
Histogram: Red (bearish) / Cyan (bullish)
MACD Line: Fuchsia/Pink
Signal Line: Lime/Green
Buy Signal: Green dot (bottom)
Sell Signal: Red dot (top)
This indicator is perfect for traders who want a cleaner, faster-responding MACD with built-in trend filtering and clear entry signals. Free to use and customize!

Tamil - BOS/CHOCH Demand & SupplyTamil – BOS/CHOCH Demand & Supply is a Smart Money Concepts (SMC) indicator that automatically detects Break of Structure (BOS) and Change of Character (CHOCH) events and draws clean Demand (bullish) and Supply (bearish) zones directly on the chart.
It supports multiple pivot lookback periods at the same time (ex: 1,2,3,5,11,15,20) to map structure from micro to higher swings, and it keeps zones updated as price interacts with them.
What it does
• Creates Demand zones (green) when price confirms a bullish break above a prior swing high (BOS/CHOCH).
• Creates Supply zones (red) when price confirms a bearish break below a prior swing low (BOS/CHOCH).
• Labels each zone as “BOS Demand/Supply” or “CHOCH Demand/Supply” and includes the lookback period used to form it.
Zone lifecycle (auto-managed)
• Active zone: drawn and extended forward until invalidated.
• Mitigation: when price revisits the zone (first touch), the zone turns gray to mark it as mitigated.
• Break / invalidation: if price fully breaks the zone (below demand bottom / above supply top), the zone is deleted.
Optional “Inducement / Liquidity Grab” filter (IDM)
If enabled, zones are only drawn when the swing that created the break also swept liquidity from the previous swing (a common SMC “inducement” condition), helping focus on higher-probability zones.
Alerts included
• New confirmed Demand zone
• New confirmed Supply zone
• Zone Mitigated
• Zone Broken
Notes
This is an indicator for structure + zone mapping (not a backtest strategy). Use proper risk management and confirm zones with your own execution rules.


